USDT dominance chart grows stronger#usdt #tether dominance has bounced after bullish divergence and a W bounce emerged in LTF. #usdtd is now looking stronger. Upside movements will damage #altcoins and #btc #eth . Losing the double bottom zone at %3.90 is the invalidation. Not financial advice.
USDT.D trade ideas

USDT.Dominance Chart Update !!The chart shows USDT dominance in a downward channel.
The recent price movement tested the upper trendline and faced rejection, indicating the downtrend remains intact.
Moving Average:
The 50-period EMA (red line) acts as resistance, reinforcing bearish pressure.
Resistance: 4.10% (channel top and 50 EMA).
Support: 3.85% (channel bottom).
Rejection at the upper trendline points to a likely continuation toward 3.85%.
A breakout above 4.10% and the channel could signal a potential reversal, with an upside toward 4.30%.
Disclaimer: This analysis is for informational purposes and is not financial advice. Always stay updated with market movements and adjust your trading strategies as needed.
You can DM us for information on any other coin.
@Peter_CSAdmin

Total Market Cap 2 and Total 3 + USDT.D Market WarningsIn this video, I briefly review the USDT.T bear market signals I covered in a recent video below.
But also noticing that Total 2, Total 3 and also the OTHERS are either hitting or very close to hitting their all time highs from the prior market cycle in 2021, which was the start of the Bear.
I do think we see more profit taking Monday afternoon into Tuesday through Thursday which is projected Dec 5th market cycle low from a cycles perspective.
Notice how the alts have been flying the last few days, and this weekend -- setting us up for major profit taking tomorrow and to fool all the new crypt tourists into buying the highs.
Protection capital here IMO and wait to buy back lower.
Let me know your thoughts, and please like the video if you found value.
- Brett
PS> My other Bear Market indicator fired today when I went out for Italian at my favorite local restuarant (sneaking in right at closing time as usual b/c I work 14 hour days)... and the bus-boy saw my Bitcoin hat -- and starting giving me crypto tips!
This is like the 'Taxi Cab' indicator of 1999, when the cabbie started giving me stock recommendations ... I had a feeling the top was in!

Will the Support Zone of USDT.D Cause a Cryto Correction ?We are close to the bottom of the bullish channel and on a static level that has supported Tether's dominance. If we see Tether's dominance rise again from this zone, it is likely that the cryptocurrency market will undergo a correction.

Destiny 1H USDT.DOne of the rules of the price action trend line pattern clearly states that the fourth touch of the candles creates support and propels the price.

USDT Dominance showing possible continuation for BTC for nowUSDT.D closing a monthly candle at 3,95% shows that Bitcoin could go to higher prices, broking an ascending broadening wedge that is forming since 2017 and could lead the dominance to reach the all time history point of control with confluence of 0,786% fibonacci between 2,56% and 2%. If the dominance reach theses levels it will probably be at the same time as bitcoin would be forming the cycle top.

USDT.D w Bull end scenarioBINANCE:BTCUSDT CRYPTOCAP:USDT.D possible returns lvl of usdt.d trendline is important to watch.

Usdt dominance Bears are at a critical support here . They have to defend it with their lives they probably praying right now for the market to go down . This is a major support this means if the support is broken btc and alts will rally and keep growing but if the support holds it means btc can fall from current prices and put pressure on all the market so . Anything can happen just be careful . Gona keep some cash just in case

Destiny USDT.D 1H Falling Wedge PatternAccording to the default RSI oscillator, a positive divergence has occurred, and the candlestick trend is in a state of compression within a descending wedge, indicating that a significant rise is very close.

Destiny Of USDT.D 1HPositive divergence is very clear, the downward trendline has been broken, and a pullback has occurred. The one-hour base is static support. You shouldn't act emotionally; as a trader, you should proceed with knowledge and technical analysis.


Analyzing Liquidity Dominance: Key Data Insights
The chart provided offers a comprehensive view of Liquidity Dominance within the cryptocurrency market, showcasing pivotal relationships between market activity, trading volume, and liquidity flow. This analysis dissects the chart and explores key patterns, trends, and their implications for traders and investors.
Understanding Liquidity Dominance
Liquidity dominance represents the proportion of trading volume, capital flow, or liquidity concentrated in specific assets or market sectors. It serves as a barometer for understanding market behavior, as it highlights where capital is being deployed or withdrawn. On my chart, liquidity dominance provides a lens into the dynamics between:
Stablecoins (e.g., USDT): Representing safety and risk aversion.
Altcoins: Capturing speculative capital.
Bitcoin Dominance (BTC.D): Indicating market confidence in Bitcoin versus other assets.
Key Observations from the Chart
1. Stablecoin Liquidity Dominance (USDT.D)
Current Trend:
A noticeable decline in USDT.D suggests that capital is moving out of stablecoins, signaling increased risk appetite among traders. This typically aligns with bullish sentiment in the broader market, as investors allocate funds to Bitcoin or altcoins.
Market Implications:
If USDT.D continues its downward trajectory, we could expect a rally in cryptocurrencies, particularly in altcoins, as traders seek higher returns.
A sudden reversal in USDT.D (spiking higher) could signal market uncertainty or panic, as investors flee to stable assets.
2. Bitcoin Liquidity Dominance (BTC.D)
Current Trend:
The relatively stable BTC.D indicates that Bitcoin retains its share of liquidity without significant outflows to altcoins. This suggests that while altcoins may rally, Bitcoin remains a primary safe haven for large capital.
Market Implications:
A breakout to the upside in BTC.D could signal a Bitcoin-led market cycle, often observed during early bull markets.
A breakdown in BTC.D could indicate the onset of an "altseason," where altcoins outperform Bitcoin.
3. Altcoin Liquidity (TOTAL2 - Altcoin Market Cap)
Current Trend:
The chart indicates increasing TOTAL2 dominance, showing growing interest in altcoins. This suggests speculative capital is rotating from Bitcoin or stablecoins into altcoins, likely driven by expectations of higher returns.
Market Implications:
A continuation of this trend supports the idea of an emerging altcoin season, especially if TOTAL2 outpaces BTC.D consistently.
If TOTAL2 stagnates or declines, it may signal profit-taking or reduced confidence in altcoin performance.
Key Data Insights
1. Divergences Between USDT.D and BTC.D
A strong divergence between USDT.D and BTC.D often highlights market turning points:
Bullish Divergence:
If USDT.D declines while BTC.D rises, it suggests strong confidence in Bitcoin leading the market, often a precursor to a bull run.
Bearish Divergence:
If USDT.D increases while BTC.D falls, it indicates risk aversion and capital flight to safety, hinting at potential market downturns.
2. Correlation Between TOTAL2 and USDT.D
The inverse correlation between TOTAL2 and USDT.D is a critical marker:
As TOTAL2 rises and USDT.D declines, it signals risk-on behavior with a focus on altcoins.
If TOTAL2 falls alongside a rise in USDT.D, it could indicate market-wide selling pressure.
3. Price Action Confirmation
The interaction of liquidity dominance with price action across key support and resistance zones provides confirmation of market sentiment. Key observations include:
Strong resistance in BTC.D coinciding with declines in TOTAL2 could signal a Bitcoin-led consolidation phase.
Support in TOTAL2 while BTC.D declines suggests capital rotation into altcoins, supporting a rally.
Predictions Based on Current Trends
Short-Term Outlook:
With USDT.D trending downward, the market appears to be in a risk-on phase.
If BTC.D remains stable while TOTAL2 gains dominance, altcoins are likely to experience significant upside.
Medium-Term Outlook:
A breakout in TOTAL2 above key levels would confirm altseason momentum, particularly if USDT.D continues to decline.
However, if USDT.D rebounds sharply, expect market-wide corrections, with Bitcoin potentially absorbing most of the liquidity.
Long-Term Outlook:
Sustained declines in BTC.D combined with TOTAL2 growth could indicate prolonged altcoin outperformance.
Conversely, a reversal in BTC.D dominance with stable USDT.D suggests a return to Bitcoin-led cycles.
Strategies for Traders
1. Monitor Liquidity Flows
Use the interaction between USDT.D, BTC.D, and TOTAL2 as a guide for market sentiment.
Look for divergences between these metrics and price action to spot potential reversals.
2. Align with Dominance Trends
If BTC.D is rising, focus on Bitcoin as the primary trade.
If TOTAL2 gains dominance and USDT.D declines, shift focus to altcoins for higher returns.
3. Risk Management
During periods of rising USDT.D, reduce exposure to altcoins and focus on stablecoins or Bitcoin.
Use liquidity dominance trends to time entries and exits at major support and resistance levels.
Conclusion
My Liquidity Dominance chart provides a powerful framework for understanding capital flow dynamics across cryptocurrencies. The current trends suggest a risk-on environment favoring altcoins, but the stability of BTC.D implies Bitcoin remains a key player. Monitoring these metrics closely will help you navigate market cycles effectively, identifying both opportunities and risks as they arise.

USDT.D Update - Nov 29 2024Looking at the chart, it seems USDT dominance is possibly forming a bullish consolidation pattern these days. Based on current chart's status, another drop can be expected before we see a possible strong upward move towards 4.35% - 4.70% zone.
in that case, BTC can form a new ATH (102,000 - 104,000 area) before a possible strong dump towards the CME gap.
It is possible that the market is going to give us a nice discount on many coins, so it is suggested to have liquidity/cash to buy the dip.

Stablecoin dominance inverse cup and handle = SUPER CYCLEIf this breaks down, the super cycle starts.
Stablecoin dominance going down = our bags go up.
GTFO at the target no matter how you feel.
Not financial advice.

USDT dominance on the 4-hour timeframe.The price is trading within a clearly defined descending channel.
The current movement indicates rejection near the upper trendline, which suggests continued bearish momentum.
The 50-period EMA (red line) acts as a dynamic resistance.
The recent retest and failure to close above it confirms the bearish bias.
The chart suggests a move towards the channel's lower trendline, around 3.85%- 3.90%, as the next support area.
The lack of breakout volume indicates continued selling pressure.
If USDT dominance breaks below 3.90%, it could signal strength in crypto assets, with altcoins seeing a rise.
A breakout above the 50 EMA and upper channel trendline could reverse the trend.
Disclaimer: This analysis is for informational purposes and is not financial advice. Always stay updated with market movements and adjust your trading strategies as needed.
You can DM us for information on any other coin.
@Peter_CSAdmin

Quick Thoughts and Analysis on #USDT.DThe rise in USDT dominance has sent the market into a tailspin, with #BTC dropping to nearly $6K.
It's not just #bitcoin that's taken a beating; alts have too, and many are down by 30%.
I'm honestly expecting a 1.618 reversal on the H4 TF for #USDT.D at 4.33(4)%. If that doesn't happen, we might see more carnage as it heads towards 4.49%.
We're seeing some decent pattern formations here – BAT and Anti BAT – but we'll have to wait and see if #USDT.D can break 4.33% or reverse for these patterns to be valid.
I'm really hoping for a reversal here. If it happens, I'm looking for it to bounce back to 4.04% to sweep the H4 FVG and return to the HTN (High Traded Nodes H1 for Volume), which would both be great entries to short #BTC and alts again.
Additional note
Potential areas to bounce besides 4.04%: 4.16%, 4.17%, and 4.11%.
Disclaimer:
The information provided is for educational and informational purposes only and should not be construed as financial advice. I am not a financial advisor, and my opinions are based on my own analysis and research. Trading involves significant risk and is not suitable for everyone. Always conduct your own research (DYOR) and consider seeking advice from a licensed financial advisor before making any investment decisions. Trade at your own risk, and never invest more than you can afford to lose.

USDTDominance chart update !!USDT Dominance (USDT.D) chart continues to confirm the descending channel pattern, with dominance currently testing the upper trendline.
Dominance remains within the descending channel, with the upper boundary acting as a crucial resistance level near 4.30%-4.35%.
Recent price action shows rejection at this resistance, indicating a possible continuation of the downtrend.
The middle line of the channel may provide minor support around 4.10%.
Strong support lies near the lower boundary at 3.85%-3.90%.
Immediate resistance remains at 4.30%-4.35%.
A breakout above this level would signal a possible reversal in dominance, invalidating the bearish channel.
The current rejection is in line with the bearish outlook.
Momentum suggests that dominance could test the lower trendline again, especially if crypto markets maintain bullish momentum.
The short-term target is the lower limit near 3.85%.
Bullish invalidation occurs above 4.35%.
Monitor further rejection at the upper limit for short entries.
Confirm the breakdown with rising volume.
Disclaimer: This analysis is for informational purposes and is not financial advice. Always stay updated with market movements and adjust your trading strategies as needed.
You can DM us for information on any other coin.
@Peter_CSAdmin

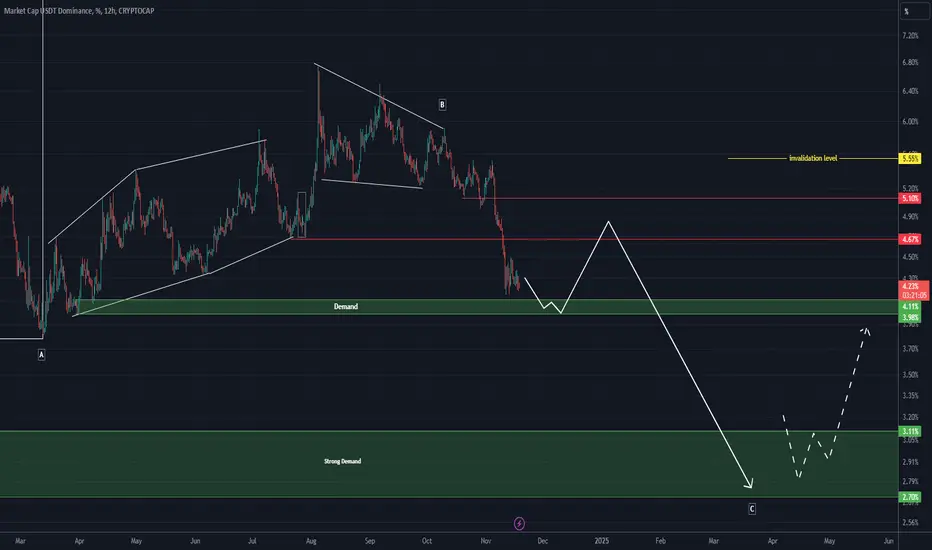
USDT DOMINANCE UPDATE (1D)🔷 First of all you should know that "USDT Dominance" is always moving inverse of BTCUSDT .
It seems that Tether Dominance has entered a large C wave.
The Tether dominance is near a support level, which could lead to a correction in its downtrend.
Such a move can be anticipated for Tether dominance.
Let’s wait and see what happens.
For risk management, please don't forget stop loss and capital management
Comment if you have any questions
Thank You
USDT.D Scenario 8HI think USDT dominance has set itself up for a continued upward trend after breaking through the important level of 4.22% and stabilizing above that. This could push it to even higher numbers, which might lead to a market correction...

usdt.d toch again the weakly trendline usdt.d toch again the weakly trendline that is in shape to tell breaked .also we may wait and see


USD.D Forcasting (Update)Always and at all times. All events will occur in the chart.
Trend Prediction - USD.D Forecasting - Resistance and Support Lines
**** Yousef Sharafi ****
Follow me here for more analysis

what is your comment about USDT.D??if trend RSI in 30 min be true i think this path for move ...
USDT.D monthly candle is breaking the trend line in 5 days ahead if
candle close down of trend market get high but i dont sure for this such easy
news can change anything ...
please search yourself this is not a signal for buy or sell orders
