USDT Dominance broke the important support!!Join our community and start your crypto journey today for:
In-depth market analysis
Accurate trade setups
Early access to trending altcoins
Life-changing profit potential
Let's analyse USDT dominance in LTF here.
USDT.D was trading above the midline of its channel, but the likelihood of it bouncing back to the upper channel has diminished after breaking a crucial support level following the Fed's 50 basis point interest rate cut yesterday. This indicates a bullish sign for a BTC rally towards $70,000.
Support Levels:
5.43%
5.17%
Resistance Level:
5.78%
If you find this analysis helpful, please hit the like button to support my content! Share your thoughts in the comments and feel free to request any specific chart analysis you’d like to see.
Happy Trading!!
USDT.D trade ideas

Crypto analist USDT.D will try one more to brake key-level 5.71% then i want to see weekness and bullish on alt-pair

Final Bear Trap Before Bull run?From this USDT. Dominance chart, whose upward move shows that more people are buying stables, we could see one final shake out of longs. We pamp in Uptober with this.

USDT dominance Bearish formationGreetings traders,
USDT dominance (log chart) had broken down the macro trend when BTC started rallying end of 2023.
As BTC peaked in March this year, USDT started grinding up and is currently re-testing those level from beneath, and has produced another lower high on August 5th.
Another bearish pattern is forming, a rising wedge, that typically breaks to the downside.
Very visible on the daily chart. MACD has printed a bearish divergence as well.
Before breaking down however, there is a probability of another move up towards the horizontal resistance and the descending trendline. This will have BTC back around 52-53k region where last week CME gap is.
Obviously it is possible, but less likely in my opinion, that this chart will break to the upside. This would mean BTC going to low 40k.
I personally use USDT chart as a confirmation of BTC direction, not as leading indicator.
And this chart is giving me more conviction that very soon BTC and altcoins will break to the upside.
Good luck everyone.

CRACKS ARE FORMING IN USDT DOMINANCE! THE END IS NEAR!USDT has completely dominated the stablecoin market for a long time now, but cracks are beginning to form in its foundation that could cause the whole structure to come crashing down. People are losing trust in USDT, even though the vast majority of trading platforms use it as the sole medium of exchange on their platforms. Competitors are turning up the heat in this market, and companies like Circle (USDC), which are fully audited, as well as newcomers like Ripple's RLUSD, could pose a serious challenge to USDT if it doesn't prove its reserves through regular audits and restore investor confidence.
I personally believe that USDT is a Ponzi scheme, similar to the Federal Reserve, which continuously counterfeits dollars by minting excess tokens, with nothing but faith backing them. I also believe that the time of USDT's dominance is coming to a swift end.
Once RLUSD is released and available for purchase to Wall Street and Main Street, I believe that the majority of stablecoin holders will switch from USDT to RLUSD, as Ripple is one of the most transparent and reputable companies within the crypto space. I am one of these people.
Good luck, and don't put all your eggs in one basket!

USDT Dominance Inverse H&S Indicating Potential BTC Dump!Join our community and start your crypto journey today for:
In-depth market analysis
Accurate trade setups
Early access to trending altcoins
Life-changing profit potential
Hello everyone,
As anticipated, market volatility has increased. Given the current market conditions, it was already advised to avoid long positions in futures in our community.
There's a growing likelihood of a Bitcoin pullback due to the formation of an inverse head and shoulder pattern in USDT dominance. Additionally, a breakout from a triangle pattern on the hourly timeframe suggests potential short-term weakness in BTC.
While a retest is possible, a larger downward move for Bitcoin is probable in the higher timeframes.
Key Points:
USDT Dominance: Forming an inverse head and shoulder pattern.
Hourly Chart: Triangle breakout indicates potential weakness in BTC.
USDT dominance upper resistance: 6.56%
If you find this analysis helpful, please hit the like button to support my content! Share your thoughts in the comments and feel free to request any specific chart analysis you’d like to see.
Happy Trading!!

1 year chart
"Test for Chart Viewing" typically refers to a process used in various applications, especially those involving financial markets, data analytics, or performance monitoring, to ensure that the visualization or graphical representation of data works as expected. This can involve testing features like:

USDT.D in daily timeframe USDT.D in daily timeframe
If the upcoming resistance is not broken, it will most likely correct... this correction will increase the price of Bitcoin

LIVE Crypto Trading Signals: Buy/Sell Alerts for BTC & AltcoinsReal-time crypto trading signals for Total Market Cap $, Bitcoin (BTC), Ethereum ETH, DOGEcoin, BNB, and Solana (SOL).
Whether you're a seasoned trader or just getting started, our expert analysis will help you make informed decisions in the fast-paced world of cryptocurrency.
🔔 What to Expect:
Live Buy/Sell Alerts: Stay ahead of the market with our real-time trading signals.
Technical Analysis: In-depth chart analysis and insights to help you navigate market trends.
Market Updates: Get the latest news and updates affecting BTC and SOL prices.
Q&A Session: Ask your questions live and get answers from our trading experts.
📈 Why Follow Our Signals?
We have a proven track record of accurate predictions.
Easy-to-follow signals for all trading levels.
Maximize your profits and minimize risks with expert guidance.
💡 Don’t miss out! Hit the subscribe button and turn on notifications to stay updated with the latest crypto trading signals. Like and share this video to help others benefit from our live trading insights!
💡 All these signals are over 100% Profit since JAN 2023.
#cryptocommunity #cryptotrader #cryptoenthusiast #cryptotalk #askmeanything #cryptoanalysis
#cryptosignals #cryptotips #cryptoeducation #cryptonews #daytrading #swingtrading #scalping
#technicalanalysis #fundamentalanalysis #arbitrage #hedging #dollarcostaveraging #cryptocurrency
#bitcoin #ethereum #blockchain
#cryptotrading #cryptoinvesting
#altcoins #defi #nft
Note: This is for educational purposes. Leave your comment for more trading Pairs.

Bye Bye Usdt.D we are losing you like a dramatic song
like a huge news about Crypto
And here you go
Crypto market Pump Soon 61k BitCoin 🅱️🚀

USD.D Forcasting (Update)Always and at all times. All events will occur in the chart. Trend Prediction -
USD.D Forecasting - Resistance and Support Lines
**** Yousef Sharafi ****
Follow me here for more analysis

Dominance TetherDominance Tether, according to the analysis as shown in the image, will have a decline after pullback up to the ceiling from where it is reversed

Will USDT Dominance Surge or Sink in September?I anticipate that USDT dominance will stay relatively strong, with price action likely remaining in the upper part of the wedge for most of September, a month that could be quite volatile. I expect a breakout from the wedge in October, indicating a decrease in USDT dominance and a rally for strong crypto assets. Given the potential volatility in September, having additional capital to buy dips could prove advantageous.

USDT.D analysisIt is about reading the price pattern and the result of the indicators
I will only share with you what the result of the analysis shows. + other crypto coin analysis.
rsi has been in a green position for a long time, red is not far, considering the rhythm of rsi history (point b and the crypto market is green)
point c is bloodshed.
This could be wrong. MD

Tether.d AndBitcoin showing Fall Best Wey to trade .In the Previous analysis, we observed the confirmation of the descending channel, now we have to examine the ascending channel of Usdt.d, which is another confirmation of the fall of Bitcoin. Currently, the resistance of 6.1 has been broken. And the first resistance target is 7.8 and 8.1 so that Bitcoin can see the targets of 48000 and 42000. According to previous experience, we can buy altcoins in this range.

USDT.DUSDT.D rebounded and started to rise exactly where I expected, it was easy to guess because it always happened since 2017.
At the moment, it looks like a continuation of the correction in the crypto market.
Not financial advice, just for fun.

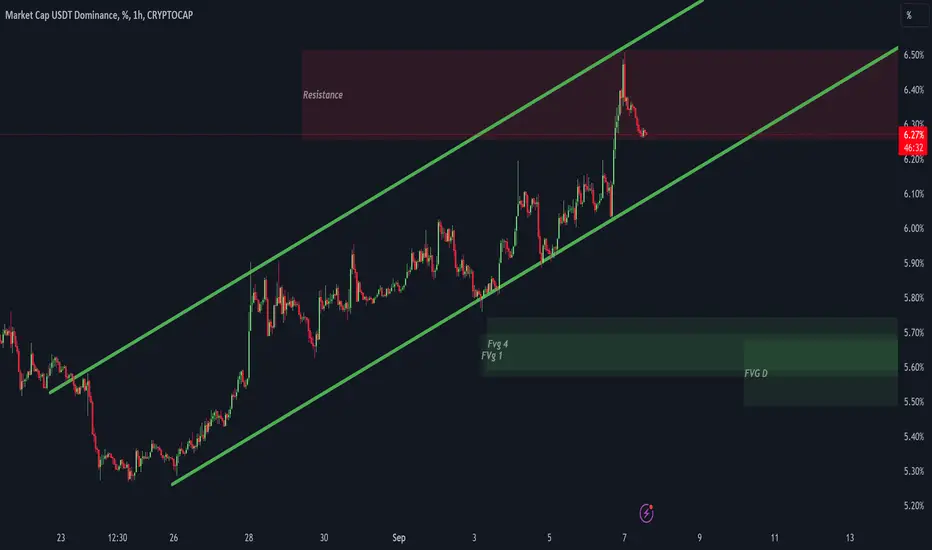
Dominance Tether WeekEnd Updatein dominance we face with a strong reistance zone that apears with RED AREA
Also we have some Fvgs in charts that not filled yet
we are in bullish movement and still long trend line is valuable
So if you want to Buy Crypto ? its time to risk or you can wait for more confirmations
like passing last higher low and breakout Trend line
@TradeWithMky
USDT dominance analysis, Upcoming rally in alts!!!Join our community and start your crypto journey today for:
In-depth market analysis
Accurate trade setups
Early access to trending altcoins
Life-changing profit potential
Hello everyone,
Let's analyze USDT Dominance (USDT.D) in daily timeframe!!
In my previous ETHUSDT post, I highlighted that ETH was approaching the 200MA, a key support zone, from which we could anticipate a bounce for both ETH and altcoins. Similarly, USDT.D has recently reached the upper boundary of the parallel channel it's been trading in. Historically, whenever USDT.D touches this upper boundary and the StochRSI forms a bearish crossover in the overbought region, it often signals a significant rally in the market.
At present, a similar pattern is unfolding, with USDT.D touching the channel's upper boundary and the StochRSI forming a bearish crossover in the overbought region. Additionally, both BTC and ETH are approaching critical support levels.
Based on these signals, entering altcoins may prove profitable as these indicators suggest a potential upcoming rally in the altcoin market. However, this analysis would be invalidated if USDT.D breaks above the channel.
Resistance zone:
- 6.56%
Support zones:
- 6.17%
- 5.90%
If you find this analysis helpful, please hit the like button to support my content! Share your thoughts in the comments and feel free to request any specific chart analysis you’d like to see.
Happy Trading!!

dominance of the TetherAccording to the analysis, according to the image, the dominance of the Tether will decrease from the desired point

Dominance is at Resistance!USDT Dominance Alert 🔥
USDT dominance is approaching a crucial resistance zone at 6.03-6.27%. A breakout above this range could push dominance to 7.6%, potentially driving BTC toward the $40K mark! 📉
However, if dominance faces rejection, it could dip to the 4.37% support level, which would be extremely bullish for Bitcoin.
Key levels to watch closely. Stay alert! ⚠️
Crypto #Bitcoin

USD.D Price Prediction-30 Minute Time Frame TradingAlways and at all times. All events will occur in the chart.
Trend Prediction - USD.D Forecasting - Resistance and Support Lines
Rising Wedge Pattern in Uptrend
**** Yousef Sharafi ****
Follow me here for more analysis

USDT.D in Strong Uptrend - Bitcoin Recovery at Risk?Today, USDT.D (Tether Dominance) is exhibiting a clear continuation of its upward trend, characterized by a series of higher highs and higher lows. Currently, USDT.D is approaching the upper boundary of a key resistance channel. As long as this resistance is not tested or breached, there remains a potential for continued downward pressure on Bitcoin and altcoin prices.
Should USDT.D manage to break through or "sweep" this upper channel level, we could see further weakness in the cryptocurrency market, with the possibility of an extended decline in Bitcoin’s price. However, if USDT.D fails to break this level and instead retraces, this could signal a temporary trend reversal, providing room for a rebound in crypto prices.
In summary, the current momentum in USDT.D suggests caution. Market participants should closely monitor these critical levels to respond promptly to any potential trend shifts.

USD.D Forcasting (Update)Always and at all times. All events will occur in the chart.
Trend Prediction - USD.D Forecasting - Resistance and Support Lines
**** Yousef Sharafi ****
Follow me here for more analysis
