Tether Dominance Analysis by the Technical Team at MallicastThe analysis team at Mallicast has outlined two potential scenarios for Tether's (USDT) dominance. Currently, Tether's dominance is hovering around 5.94%, a range characterized by substantial liquidity. Given these conditions, there is a potential for a price correction that could bring the dominance down to the 5.63% level. Such a correction might present a good buying opportunity for currency pairs.
On the other hand, there are signs of upward momentum. If this momentum continues, Tether's dominance could stabilize at higher levels. In such a scenario, investors should closely monitor the market and make decisions based on the prevailing trends.
Ultimately, the choice between a price correction scenario and a continued upward trend depends on a careful analysis of market data and attention to price movement signals. It is recommended that traders employ appropriate risk management strategies to take advantage of potential market changes.
USDT.D trade ideas

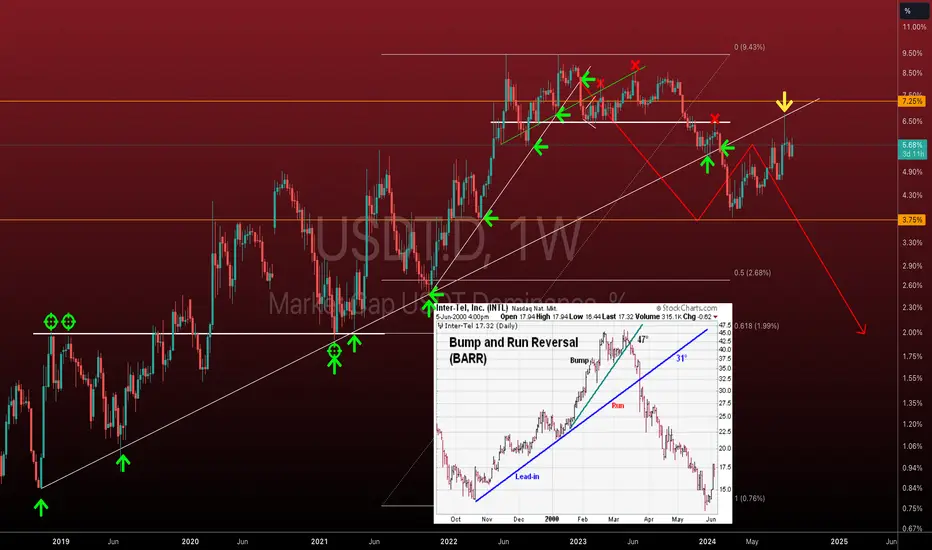
Party is over for USDT.DThis is a huge , an ascending giant channel from early 2018 broke and retested . By the next year this time if they haven’t already done printing billions more of usdt ,the share of the market would be so small that nobody goes to take it seriously for market movements .
Have patience lads we gonna make it soon .

Usdt.D ; bullrun map .Second chart tonight , same as previous chart ( bitcoin ) here we have a channel that candles respect some levels . In time based cycles we are at the time for bullrun and we might start it at the very level 1 which is shown in light red circle, this one is more possible of course after some game playing, circle 2 could be definitely a bullrun point and life changing opportunity but less likely to happen. Tbh i give it a very tiny small chance and I'm gonna invest very heavily probably twice as this moment if we get there but as I said i think we wont and the top of the channel is to fool traders and make them short and to get liquidated eventually . Next chart for tonight would be the same usdt.d but logarithmic and a huge one .

Bitcoin and usdt.d percentage comparison + theoryWhy does my theory say usdt.d will NEVER go below 3.8%?
Major usdt.d falling below the previous major drop has never happened and is suspected even today.
Major rises in usdt.d have always(*when i mean *major*) started above the previous usdt.d major high.
Depending on the movement or the situation, the average calculation is that *if btc goes down, usdt.d goes up about twice as much*. On smaller usdt.d increases 1.5x and on larger ones 2x or even 3x more than bitcoin. It also depends on the speed(volume) at which the usdt market capital rises, everything is relative
if I think positively and see that the yellow box is about 150%+, then I divide it by three and get the btc drop percentage. it makes btc -50% from higher peak. it can also be less than -50%. THIS IS AN APPROXIMATE CALCULATION AND ONLY A GUESS. theory and assumption that btc's strong rise will start when usdt.d is at a new high.
I will analyze bitcoin this year *minimum* 45k. it may drop to 40k, but time will tell. in the area where btc is now i don't believe a 100k+ rise because usdt.d theory doesn't allow it. maybe next year? hmm.
The summary is that if usdt.d is in the yellow area, then btc rises.
My vision may be absolutely wrong or absolutely true. MD

USDT Dominance - An update around breakdownUSDT Dominance continues to look weak. Last update I gave was around the retest of the major trendline that started formed in late 2018 when BTC crashed to $3100. Back then USDT dominance started to pick up as alts got decimated even though BTC did find a bottom there. USDT Dominance bottomed around 0.85% at that time.
Now here we are where USDT Dominance is at 5.6% which is about 6x higher than the bottom, and BTC is 1920% higher. How can that be? Alts. Alts haven't even started to recover yet. This will change in the coming months. There's no knowing when it's going to start, but that retest I outlined should have been an indicator that USDT dominance is going to move down.
I'm watching other indications such as BTC.D to give an indcation when alt season is going to start. Full disclosure, I have invested the capital I want to put on the line into alts.
As I've stated many times previously, crypto trading is risky and only a small portion of your net worth should be invested in crypto if you're interested in this market. Watch out, though, because if this chart is right , we will see USDT.D go down to at least 2.00% and possibly even lower. Only time will tell.
USDT Dominance Bullishwe have seen bottom head and shoulder pattern in USDT.D chart so in coming weeks, slow growth is expected

USDT Dominance Bullishwe have seen bottom head and shoulder pattern in USDT.D chart so in coming weeks, slow growth is expected

USD.D Forcasting (Update)-Always and at all times. All events will occur in the chart.
Trend Prediction - USD.D Forecasting - Resistance and Support Lines
**** Yousef Sharafi ****

USD.D Forcasting (Update)Always and at all times. All events will occur in the chart.
Trend Prediction - USD.D Forecasting - Resistance and Support Lines
**** Yousef Sharafi ****

Located in an important trend reversal zoneHello, traders.
If you "Follow", you can always get new information quickly.
Please click "Boost" as well.
Have a nice day today.
-------------------------------------
(1D chart)
USDT dominance is located in an important reversal zone.
It is an important point to watch whether it can meet resistance near the M-Signal indicator of the 1M chart and fall below the M-Signal indicator of the 1W chart, creating a state where the M-Signal of the 1D chart < M-Signal of the 1W chart < M-Signal of the 1M chart.
Since the decline in USDT dominance is likely to show an upward trend in the overall coin market, if the M-Signal indicator reverses this time, a trend reversal is expected.
-------------------------------------
(BTCUSDT 1D chart)
Accordingly, the 61099.25 point is an important support and resistance zone.
-
Have a good time.
Thank you.
--------------------------------------------------

Usdt dominance to take little correction Usdt dominance to take little correction and then we will upside which would cause crypto market to nose dive lil further.
If this works out then we will witness btc between 51 to 53k where I would personally be going all in.

bull trap for the whole crypto community?crazy wick from the top and a bearish engulfing on the W TF, if you just look at the price action (candles) tether is pretty exhausted, but if you take all the structure it broke from the 3 month to the 1W TF its just a clean break and retest to continue up as tether broke really heavy resistance and it has to come back, in the last 4 months since i called the top ive seen this unclean break and retest to continue going up countless times across all timeframes, id be very careful and not deploy all yo capital at this moment , DCA?

Usdt4h.kingBTCThe red path can be considered for usdt.d
which causes the bit to decrease to 62800 and increase to 66200-67000

Analysis of Tether Dominance by the Mallicast Team AnalystsTether dominance showed a compressed downward price movement last week, and we predict a similar bearish trend for this week. Analysts from the Mallicast team foresee this downward trend as a price correction since there is a significant support level around 3.91%. They predict the decline to extend to the 4.92% range. Additionally, the Mallicast team forecasts the current nature of the crypto market to be bearish, with the highest bullish target for this week set at 5.54%.

Analysis of Tether Dominance by the Mallicast Team AnalystsTether dominance showed a compressed downward price movement last week, and we predict a similar bearish trend for this week. Analysts from the Mallicast team foresee this downward trend as a price correction since there is a significant support level around 3.91%. They predict the decline to extend to the 4.92% range. Additionally, the Mallicast team forecasts the current nature of the crypto market to be bearish, with the highest bullish target for this week set at 5.54%.

Is it time for crypto to start growing again?Dominance Tether is a very good place to see lower targets...could this be the start of a bullish market?
This chart shows that if you see the lower levels of the crypto market, it can start to grow well... this growth can be continued... but for the time being Dominance can reach the important level indicated in the picture

usdt.dIt is very likely that Dominance Tether will hit a low, unlike BTC, because the data shows that the market wants to create a heavy sale. I will consider this range to be limited and valuable. Dear friends.

Usdt Dominance UpdateBing 🔥
Be carefull about your cryptocurrencies we are goin to see Up goin in usDT dominance
so market try to swap their Cryptocurrencies to Tether
then in Charts We have Down Trends 🔻📉📉🔻
This is How Dominance Works .
it is some thing simple 🍏. liquidity ( I mean Money ) 💵🤑 makes Market to Move Up or Down
For Example in BTC/USDT if we got more BTC Chart will go Up
I Mean when we Swap uSDT 💵 💸 TO a Cryptocurrency when we Buy BTC 🔥
so Usdt will go Down and BTc will be more valuable in small size
This is How We Create Charts 📉📈
@TradeWithMky

When #USDT dominance down, it means #BTC and #Crypto bull!!When #USDT dominance down, it means #BTC and #Crypto bull!! 🚀🚀🚀🚀🚀
#BTC #XRP #ADA #DOGE #APT #MERL #MEME #BLUR

Usdt dominance will it continue to grow?I think bitcoin has not finished its fall, the worst month for bitcoin september is ahead, I don't know when it might happen, but from the chart usdt looks very bullish.

Analysis of Dominance by the mallicast TeamFor the analysis of USDT Dominance on the 1-hour chart, the following prediction can be made:
Currently, USDT Dominance is around 5.73%, which is considered a liquidity gathering zone. Given the current conditions, there is a possibility for USDT Dominance to rise to 5.86%. After reaching this level, a corrective drop to 5.80% might occur. Following this correction, a further rise up to the 5.90% area is anticipated.
In summary, USDT Dominance is expected to first rise to 5.86%, then experience a corrective drop to 5.80%, and finally, see another rise to 5.90%.

USDT Dominance (USDT.D) Short Update. USDT dominance is currently trading within a symmetrical triangle formation. The price has been recently rejected at the Ichimoku Cloud resistance level, leading to a slight pullback. However, the 200-day moving average (200MA) remains a key support level beneath the current price, suggesting the potential for a bounce if the price reaches this area.
If USDTD breaks below the 200MA, this could indicate a decline in dominance, which may lead to an upward movement in the broader cryptocurrency market. Traders should keep a close eye on these technical levels to anticipate a possible breakout or breakdown, which could provide insight into the next significant market move.
Stay vigilant and adjust your strategies according to these key technical indicators.
Remember: This is not financial advice. Stay tuned to us for further updates and analysis. Thank you!

USDT Dominance Update.. Bulls wake up!USDT Dom weekly chart looks bearish,
5.6% is hard resistance, tether dominance next Target will be 2% if it cant break the resistance.
Boost & Follow 👍👍
