#USDT.d + #USDC.d + #DAI.d #STABLECOIN ...DOMINANCE DOWN CHANNEL
A useful tool for the crypto investor.
With yields on stablecoins collapsing, this sideline money either exits the space.
Remains as a hedging tool or re-deploys into actual blockchain protocols and coins.
#BTC, #ETH . #ALTS
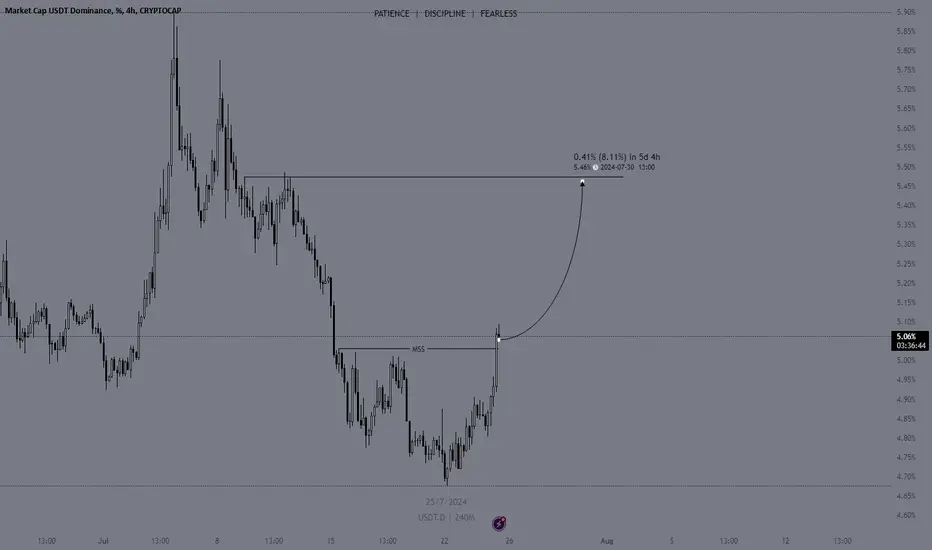
USDT.D trade ideas


#Dominance Alert!USDT dominance is sitting on strong support. A break below could confirm a bullish move! 🚀
However, if support holds, we might see a recovery towards the 5.08% resistance, which isn’t good for the market. 📉
Stay tuned and keep a close eye on the charts! 📊 #Crypto #TechnicalAnalysis #CRYPTOMOJO_TA

USDT Dominance: Channel Breakout or Bounce?USDT dominance has been trading within a well-defined channel for some time. This presents interesting possibilities for short-term and long-term cryptocurrency investors.
Scenario 1: Correction Incoming?
After two weeks of uninterrupted gains, a short-term correction for USDT dominance seems highly likely. This is supported by the fact that the dominance is currently bouncing off the lower trendline of the channel. Resistance levels to watch out for are at 4.81% and 5.10%. These resistance points are further strengthened by the 50MA and 200 MA respectively.
Scenario 2: Bullish Breakout for Bitcoin?
A more dramatic scenario would unfold if USDT dominance breaks down from the established channel. This could signal a significant shift in investor sentiment, potentially leading to a surge in Bitcoin (BTC). In this bullish scenario, key support levels for USDT dominance lie at 4.60% and 4.27%. A drop to these support zones could trigger a strong rally in BTC, potentially pushing its price towards a new all-time high (ATH) above $73.7k. Some analysts even speculate a possible surge to $90k in the near future.
Investment Opportunities?
The current market situation could represent a valuable entry point for investors seeking undervalued projects with high growth potential. It is suggested to look for projects which likely possess strong fundamental characteristics alongside technically appealing charts.
Some of them are already posted in my previous posts.
Happy Trading!!
#DYOR #BTC #USDT

Usdt dominance So usdt dominance is at support . Usdt and the crypto market work inversely ( opposite) so if usdt goes up , crypto market goes down . I think usdt will bounce off this support and head higher . In btc price possible hitting a double bottom from July lows . And if usdt break down this support we could see in btc price march highs . Could go either way depending on how the btc conference goes since that’s the only major think happening in the coming days

A Case Study #3: USDT to 2.5% Morning my friends,
This will be the final Case Study, and this time I bring a chart that I keep on adding things to.
You should go back a few months on my posts and look for this exact chart before a lot happened:
Check it out above!
I added a picture above and I wonder if it'll look good and pop out here.
Anyway my friends, It looks like we could be working on either a bear pennant or a bear flag and the drop would be below the 3%, initiating alt season, bringing ETH above $10k, and BTC near the 100k.
Lets see!
Trade thirsty!
P.S. Obviously, to LONG USDT here doesn't make sense. I put long meaning LONG coins and not USDT cause I believe it will drop! But you already knew that right?!

USD.D Forcasting (Update)Always and at all times. All events will occur in the chart.
Trend Prediction - USD.D Forecasting - Resistance and Support Lines
**** Yousef Sharafi ****

USDT.DOMINANCE 1DAY CHART UPDATE !!
The 21-day moving average acts as resistance indicating that the price needs to move above this level to regain bullish momentum.
If USDTD breaks below the support trendline of the rising wedge and drops below the Ichimoku Cloud, it would confirm the bearish trend.
This scenario would likely correspond to a bullish move in the broader crypto market, as USDT.D moves opposite to major cryptocurrencies like BTC and ETH.
USDT.D could continue to consolidate within the triangle formed by the rising wedge. This would involve sideways movement with possible minor fluctuations, indicating uncertainty and a lack of strong directional bias.
Less likely given the rising wedge pattern, a sustained move above the 21 MA and sustaining above the Ichimoku Cloud would signal renewed bullish strength for USDT.D, potentially signaling a bearish trend for the broader crypto market.
Bearish Indicators: A potential breakdown below the rising wedge pattern and the Ichimoku Cloud indicates a bearish outlook for USDTD.
Remember: This is not financial advice. Stay tuned to us for further updates and analysis. Thank you!

USDT dominance USDT dominance - exactly bouncing from my trendline, if you see my previous Analysis of usdt dominance which I had posted, I told clearly where usdt will bounce from this trendline and even BTC started dumbed from that level(see my btc Analysis).
Closely watch my chart guys for instant BTC moves..
If you like my analysis, please do follow me for many altcoins and BTC analysis.
DYOR.

USDT.D looks bullish!!As depicted on the chart i expect the USDT.D to rise to the depicted SR zones and levels.
The chart is relatively bullish considering the higher highs and higher lows and holding the trend line.this chart also corresponds to the BTC chart analyzed previously (in related links).I expect bleeding through out the Crypto and for BTC to reach at least to 50-52k zone.
Lets see how its gonna play out
Always a Student.

#Usdt Dom 1D chart - What's next step for #Bitcoin?#Usdt Dom 1D chart;
Of course, it was no coincidence that the first scenario from the critical zone I mentioned earlier was realized
Because the continued uncertainties and bearish signals on the #Bitcoin side also helped determine the direction of this chart.
With the trend compression, we may see an upward movement. A rise up to around 6% would not be a surprise. Likewise, we can say that it also supports that the bearish levels we have determined on the Bitcoin side may be possible.

USDT.DAs the Market has shifted structure we will be heading all the way up
be careful with your BTC longs cheers!
#USDT Dominance is approaching a critical resistance level. #USDT Dominance is approaching a critical resistance level.
**Scenario 1 - Rejection:** A rejection at this level could bring relief to BTC and altcoins.
**Scenario 2 - Breakout:** A break and close above 5.05% may push USDT Dominance to 5.27%+, potentially driving BTC towards the early 60ks and causing altcoins to drop by another 20%-30%.
Despite the downturn in my spot holdings, I remain steadfast. Instead of selling, I’m preparing to capitalize on the dips.
Stay strategic, stay patient.
Let me know what you think in the comment section.
Thank you
#PEACE

Tether Dominance effect on BTC priceTether Dominance effect on BTC price
these fib levels on tether dominance are an indicator for which way price will move in BTC
when tether dominance is going higher, btc price goes lower and vise versa
at each of these fib levels you can basically trade resistance & support
helps to signal market tops and bottoms, this combined with volume on BTC/USDT

USDT Dominance is going to plummet soon.Due to its overextended volume for a prolonged period, it dominance has been exhausted. Imo, it will head to 2.85% - 2.95% which will launch the alt season or launch BTC to 75-77k

USDT.D Update - July 21 2024#USDT dominance is near an important mid-term ascending trendline (yellow trendline) and divergence can be seen, it's quite possible that the white trendline will be broken soon and USDT.D will rise causing dump in the market.
So the trigger to exit Buy/Long positions and consider opening Short/Sell ones will be " 4H close above the white trendline".


USDT Dominance on the Risein shorter TF: Potential Impact on BTCUSDT dominance is currently trading around 4.80%, closing above the 50-day Moving Average (MA). A clear break and hold above the 50 MA could indicate a trend reversal towards increasing USDT dominance.
The next resistance level lies at 4.81%. A decisive break above this level could further strengthen the uptrend for USDT dominance.
Next Resistance level- 4.92%
BTCUSDT can show some correction to $60k-$62k support level. BTCUSDT is also forming a Bearish divergence.
If USDT dominance gets rejected from this level, then we will still be in the rally to our BTC $70k rally.
This potential trend reversal could impact your open positions. Consider placing or adjusting stop-loss orders to manage risk in case of a price drop.
If you're in profitable positions, you might consider taking some profits to secure gains.

This will make our jobs easier if #Stablecoin Dominancewas to reach the inverse head & shoulder target :)
Almost the same % when the #crypto market topped out last cycle.
Will it?
IDK!
Should u wait to those low single digit numbers before u emabrk on profit taking?
probably not.
We shall keep an eye on this of course.
Best of Luck

USDT dominance Analysis USDT dominance, follow red boxes and green boxes
Red box - indicates bearish liquidity zone
Green box - indicates bullish LIQUIDITY zones
Watching 4.64-4.68 levels , either do or die for usdt levels to bounce or break.
If the trendline broke down and fall below means bullish for crypto market
If there is any trendline bounce then we can see btc reversal 67.5k -69k levels.

usdt.dThe decline is coming for me USDT has completed five waves 12345 There will be a strong rise for me BTC

USDT.D DOMINANCE CHART: CRUCIAL TIME FOR A BREAKDOWN OR BOUNCEHello everyone,
Here is a quick update of USDT.D in shorter TF.
USDT.D seems to be trading inside this bearish triangle. A strong rejection from the upper resistance could be seen from the chart. Daily chart confirms the candle close below 200MA which has certainly triggered BTCUSDT to $65k.
Also, we have seen a pullback to $62k as a retest. Further retest could be if USDT.D tends to touch 200MA or a bounce from the support trend line. And if there is a further breakdown from this triangle, we could possibly witness a rally.
Happy Trading!!

USDT.DUSDT Dominance forming Rissing Wedge formation.
We have 2 possibilities to complete the formation and reach the target of this pattern.
Whether next move make a new high (which we do not expect it to !!) But our Target will be New Low.
🚨 Meaning: Our Target for CRYPTOCAP:BTC is new ATH !!
Let's see how it goes.
