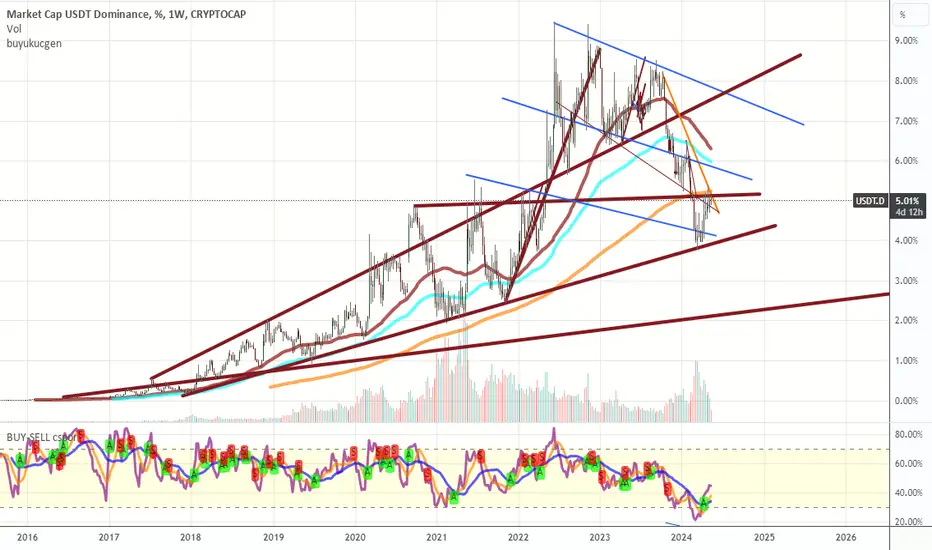
Divergences say that $USDT dominance is getting stronger#usdt #tether dominance chart is rising after bullish divergences occured. Short term continuation is expected. Not financial advice.
USDT.D trade ideas

USDT.DAnalysis of USDT.D daily time frame
In the medium term, Dominance Tether can move towards higher targets after a correction, as a result, we expect a dump of Bitcoin.

Usd.dominance Dominance is currently bearish….trying to get back to it orders before firing off to the upside. Please follow for more updates.

Tether Dominion Bearish Flag Pattern Appears! "USDT.D"Hello, Friends!
Good to see you. Are you all having a good day?
Tether Dominance is on a long berish.
The current wave shows the bearish flag pattern.
If it breaks down the bottom of the Flag, it will go down to the target value.
It's important!
When tether Dominance falls, the BTC and ALT rise.
When Tether Dominance rises, the BTC and ALT fall.

USDT.DOMINANCE CHART UPDATE !!USDT DOMINANCE ANALYSIS
USDT.D is descending following a retest below the rising wedge. It's also breaking through the MA 50, with a candle close below it confirming a bearish sentiment. Notably, a bearish USDTD trend often indicates bullish momentum for the broader crypto market due to their inverse relationship.
I have tried to bring the best possible results in this chart.
If you like it, hit the like button and share your charts in the comments section.
Thank you.

big upside movement forcast by anlyse USDT.Din USDT.D chart we can obviously get our confirmation for another leg up.
the exact confirmation come after break and closing candle under 4.76% line.
next support is about 4% which is resistance of 73000$ in bitcoin

USDT DOM chartUsdt dominance in resistance now, now ready to turn back 4$ levels
it means that btc to 70-75k right now
lets see what happens in a month

USDT DominanceCan we expect such price action for USDT dominance? If so, it's likely that Bitcoin dominance will also continue its uptrend. In that case, altcoins will likely experience a significant downturn.

Daminans USDTGood time
According to the previous analysis, Dominance Tether was touched in the resistance range and tries to break it. If it succeeds in breaking the resistance, it will be next to the specified range
And Bitcoin will correct up to the range of 52000 to 56000
good luck

Daminans USDTGood time
According to the previous analysis, Dominance Tether was touched in the resistance range and tries to break it. If it succeeds in breaking the resistance, it will be next to the specified range
And Bitcoin will correct up to the range of 52000 to 56000
good luck

USDT.DIn the previous analysis, as expected, an ascending log was formed in the form of wave B.
If this analysis is correct
You can wait for the fall of dominance and therefore the possibility of an upward trend in the cryptocurrency market.


$USDT Dominance' s 2 Way#usdt #tether dominance chart may follow these two path. Ascending channel is on the play since 13th March 2024 (Mid term)

Bitcoin and USDT Dominance Compare IYou can use this chart to predict the price of Bitcoin by comparing it to USDT dominance.
When USDT dominance shows signs of increasing, Bitcoin will undergo a correction.


Analysis of Tether's dominance in history 2024/05/09According to the previous analysis of Dominance Tether
It showed a small reaction to the red range and continued the trend
And because there was a cap above the red range, it quickly reached the yellow range

USDT.DDominance analysis of the daily time frame
By analyzing the dominance of Tether, we can have a better view of the movement of Bitcoin.


BEARISH WHITE-SWAN HARMONIC PATTERN ON USDT.D#USDT.D is printing a bearish trend continuation, white-swan harmonic pattern on the daily.
To be noted however is that the price has an upward move towards 6.2-6.5% zone before trend continuation.
This means that the market might keep bleeding for now📉

USDT.DDominance Tether bounced back higher after hitting the support zone
The red range is the dominance resistance, which goes up in case of Sharp's failure
In this move, Sharp Bitcoin reaches the range of 52000

USDT.DUSDT Dominance has apparently completed its downward movement in the 4-hour time frame.. which has been completed in the form of an impulse that can be considered wave A or 1.. which of course we have named wave A for now..
In the following, an upward phase can be completed in the form of wave B. Based on this, we can expect growth up to 5% and even higher levels. Time 4 hours..
