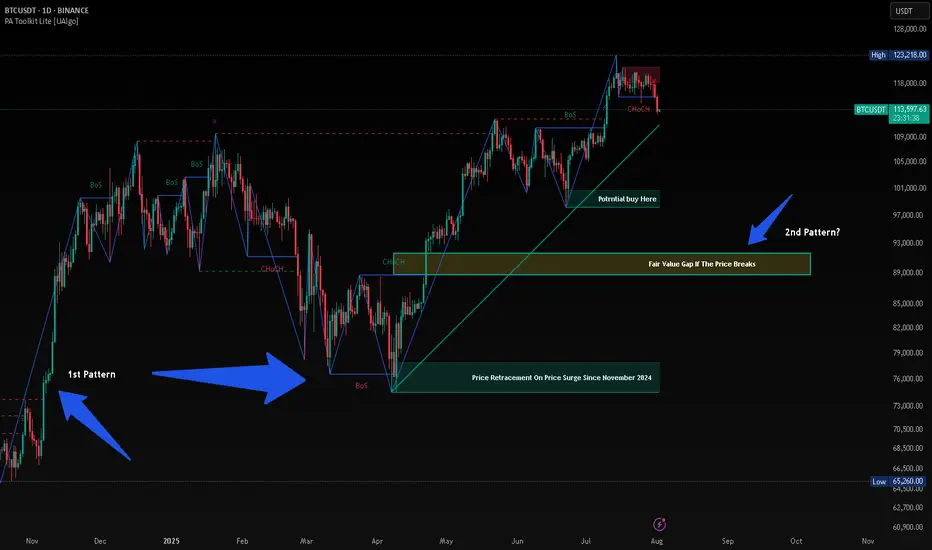
BTC HUNTS LIQUIDITYThis is just my opinion, BTC will hunt liquidity before taking new High. Since November 2024 after President Trump was elected, the price of BTC surge from $74,000 and retrace almost the same price on April 2025 after taking its new High. History will repeat itself and when history failed, there will be a long Bearish at least 90%.
USDTBTC trade ideas
$BTC Retest Before Takeoff?Back on July 27, I shared a path 120K → 114K → 127K
Price has followed this playbook closely and now we’re at a critical zone again.
On daily timeframe, structure is still in an uptrend, but momentum is fading.
Price is consolidating between 119.9K–120.1K (Fib 61.8–65%) and 117.8K–116.6K (Fib 38.2–23.6%). MACD bearish crossover and histogram is still growing. RSI is neutral at 51 but definitely losing bullish energy.
If 117.8K breaks cleanly, we may revisit 114.7K (demand zone + full Fib retracement) before bulls reclaim control.
If we look at lower timeframe (4H). It is forming a tight range, but a lower high + weakening MACD suggests a bit more downside short term. Also, RSI at 46 confirms that consolidation with mild bearish tilt.
Key levels that I am currently looking are 118.8K–117.8K for the short-term intraday range play. And 116.6K & 114.7K for the support & potential bounce zone.
The scenario is still in play
- Rejection at 120K
- Retest 114K–116K zone
🚀 Then potential launch toward 127K (measured move + channel top)
Only a daily close above 120.1K with volume invalidates this retrace idea.
TL;DR
🟥 Resistance: 119.9K–120.1K
🟧 Neutral zone: 117.8K–118.9K
🟩 Support: 116.6K - 114.7K
🟦 Target: 127K if bulls reclaim the high ground
Still playing the patient game. Let’s see if 114K gets tagged one more time. What do you guys think?

Bitcoin Price Flow From Liquidity Grabs to Structural BreakoutsBitcoin Price Action Analysis:
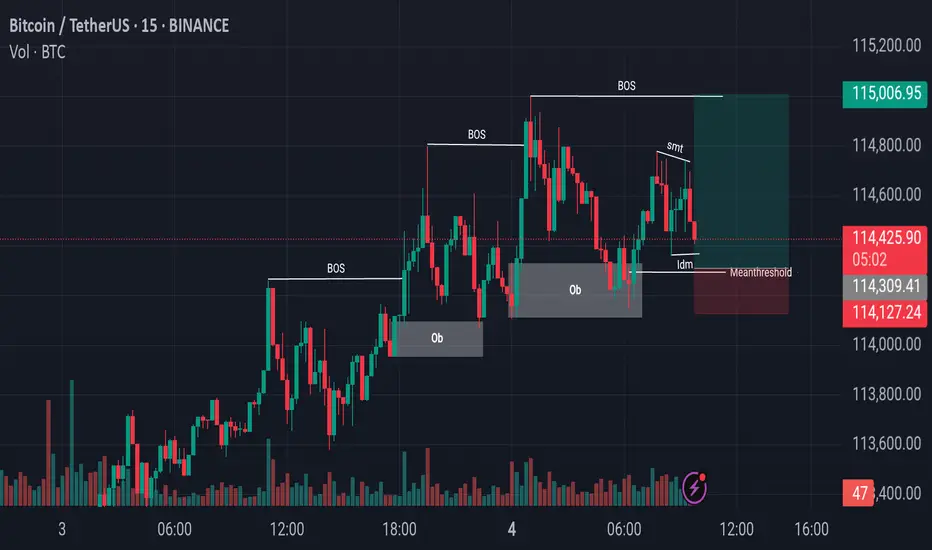
In recent sessions, Bitcoin has been consistently making Breaks of Structure (BoS) to the upside, indicating a strong bullish trend. Most recently, after forming another BoS, the market retraced downward and precisely tapped into a previously established Bullish Order Block (OB). This reaction led to a temporary upward movement; however, during this process, the market also created a zone of internal liquidity.
Currently, Bitcoin is showing signs of a downward move again, potentially aiming to capture Internal Drawdown Market (IDM) liquidity. Just below this level lies another key Order Block, which could serve as a strong support zone. If the price reacts positively from this region, we might see the market initiate another upward leg, potentially forming the next Break of Structure to continue the bullish narrative.
Note: Always perform your own research (DYOR) before making any trading decisions.
daily BTC analysis Bitcoin breaks the $115,000 level and approaches $112,000. Personally, I expect this level to be unsustainable and the next level is $110,000. This analysis is not financial advice in any way.Crypto Futures Trading Could Destroy All Your Money

How to Capture Reversals/Breakouts with MAD IndicatorBTC/USDT 15M – Market Anomaly Detector (MAD) Captures Reversals & Breakouts
⸻
Description:
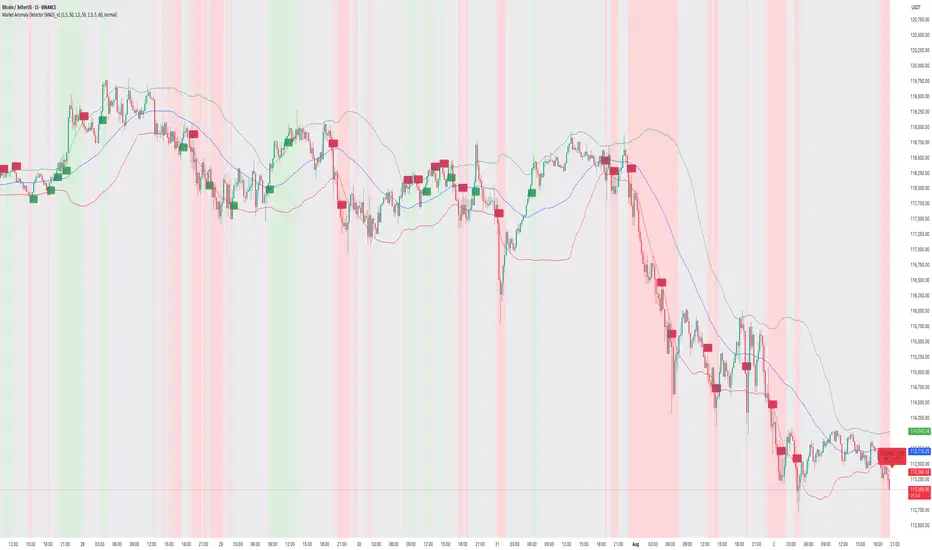
On this BTC/USDT 15-minute chart, the Market Anomaly Detector (MAD) is actively highlighting high-probability market turning points and anomaly zones.
Key Observations from the Chart:
1. Green & Red Zones = Expected Price Range
• Green Line (Upper Band): Expected top of the range.
• Red Line (Lower Band): Expected bottom of the range.
• Price usually travels green → red → green, forming a natural oscillation.
2. Buy/Sell Signals = Breakout + Reversal Detection
• Buy Signal: Triggered when price closes above the green line or recovers from below the red line.
• Sell Signal: Triggered when price closes below the red line or rejects from the green line.
• This reverse psychology logic helps catch false breakouts and stop-loss hunts.
3. Performance on This Chart:
• Signals aligned with key reversals during the sideways-to-downtrend transition.
• The strong downtrend in the second half of the chart shows multiple accurate sell signals, confirming trend continuation.
• Sideways movements had minimal false signals due to cooldown + volume filter.
4. Unique Advantage (USP):
• Statistical approach using Z-Score & Standard Deviation.
• Multi-filter confirmation with RSI, volume, and higher timeframe trend.
• Visually clear anomaly zones:
• Green background = Bullish anomaly
• Red background = Bearish anomaly
• Gray background = Neutral range
Takeaway:
MAD helps traders anticipate anomalies rather than react late, offering high-probability trade entries and reversals in trending and volatile conditions.
BTC Next Move Toward $150K?Bitcoin recently broke out above a long-standing resistance zone ($110K–$115K), supported by a clean move through the volume profile high node. After testing local highs, BTC is now pulling back to retest the breakout area, a critical level that could act as new support.
Key Points:
Breakout Retest: Price has pulled back into the breakout zone around $114K, aligning with strong previous resistance that may now flip to support.
Volume Profile: A strong high-volume node is visible below ($105K–$110K), which reinforces this area as a major demand zone.
EMA Confluence: The 50-day and 100-day EMAs are trending upward and aligning near the retest area, providing additional support.
If this level holds, BTC could resume its bullish leg toward the $150K level.
Cheers
Hexa

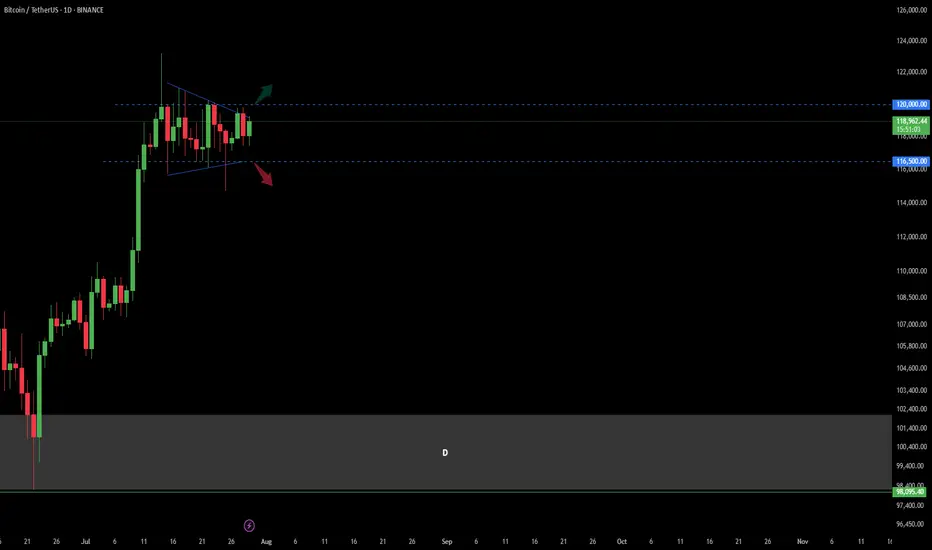
Bitcoin Trend Analaysis UP or DOWN?!Price capped in a wedge in Daily time frame.
There was a fake break from the bottom of this wedge last week and sharply got back to the top of it!
Now : break and confirm above 120 K in Daily would make the market BULLISH
break and confirm under 116.5 K in Daily would make the market BEARISH.
other wise market is still in a range mode...
BTC/USDT Analysis: Testing Strong Support
Hello everyone! This is the daily analysis from CryptoRobotics' trader-analyst.
Yesterday, we tested the local support zones previously marked and moved into a decline. At 21:00 (GMT+3), the U.S. Federal Reserve released its monetary policy statement, which included hawkish comments regarding inflation risks. The interest rate remained unchanged. The market reacted negatively to this news, and Bitcoin accelerated its drop.
At one point, a key buyer zone at $116,200–$115,000 (volume anomalies) was tested. Then, between 21:30 and 22:00 (GMT+3), a report from the White House on digital assets was released, shifting focus toward a more positive regulatory outlook. Bitcoin bounced from the mentioned zone and has since fully recovered the drop.
Currently, there are no immediate resistance levels, so in the near term, we’re likely to see a test of the ~$120,000 level. There, it's important to watch for any signs of selling pressure.
Buy Zones:
• $116,200–$115,000 (volume anomalies)
• $110,000–$107,000 (accumulated volume)
This publication does not constitute financial advice.

#BTC Update #12 – July 31, 2025#BTC Update #12 – July 31, 2025
Bitcoin is currently at the upper boundary of the channel it has been following. It may experience a pullback from this upper boundary. This pullback is estimated to reach the $116,800 level. If it wants to go lower, it could drop as far as the $114,500 level.
There is a significant amount of liquidity between $121,000 and $117,000. Bitcoin may also try to sweep this area. However, despite 4 or 5 attempts, it still hasn’t managed to break above the upper resistance zone. Therefore, a pullback should always be taken into account.
Overall, Bitcoin is still in a correction within a correction. That means no impulsive move has occurred yet. It’s not at a suitable point for either long or short positions. You may choose to trade within this range, but keep in mind that it's quite risky.

BTC 4H – Retest Holding, But Golden Pocket BelowBitcoin’s 4H chart is at a key decision point. After a strong breakout in early July, price has been consolidating just above the prior resistance zone — now acting as support. This white box represents a major reclaim level that has held multiple times, but buyers are starting to look fatigued.
Below this support lies a clean Fibonacci retracement zone:
0.5 at 110,971
0.618 (Golden Pocket) at 108,072
0.786 deeper pullback at 103,945
The structure remains intact for now, but a loss of the current level could trigger a deeper sweep into one of these fib levels — especially with momentum (Stoch RSI) resetting from oversold.
A potential bounce here keeps the uptrend alive. However, if the zone breaks, the .618 area may be the magnet.
📊 Watching for:
Strong reaction or absorption at this support
Bullish divergence forming
Sweep into golden pocket followed by reversal structure
This setup blends price action, key S/R levels, and Fib confluence — a great chart for anticipating the next move, not reacting to the last one.

Bitcoin (BTC): Bullish Start of Week | Eyes on $110KOur attentions are currently at $110K on BTC, where we maintain the bullish plan as long as we are above that zone.
This zone is marked as the BOS area for us, where currently we are seeing the price has retested it and bounced right off again, leading the price back to upper zones here.
So once again, as long as we maintain that area, we are bullish; if we break it, we are going to look for that Bollinger Bands middle line!
Swallow Academy

Bitcoin Retests Broken Trendline Minor Resistance in Focus!Bitcoin has recently taken support from the lower levels and moved upward, successfully breaking above a key trendline resistance. Currently, the market appears to be forming another minor trendline resistance on the short-term chart. Interestingly, the previous trendline that was broken is now acting as a support zone, indicating a potential shift in market structure.
If the price manages to break this newly developing minor trendline resistance, we may expect a possible retest of that level. Should the retest hold, it could provide a strong bullish signal, allowing Bitcoin to continue its upward movement toward higher liquidity zones or resistance levels.

longI think the pullback is complete and the beat can grow, but I'm still paying attention to the Dominance Beat. Thank you for your attention.

4RRI Think the likelihood that we may have finished moving down on bitcoin is over, however, even if that is not the case, This may be a nice trade!

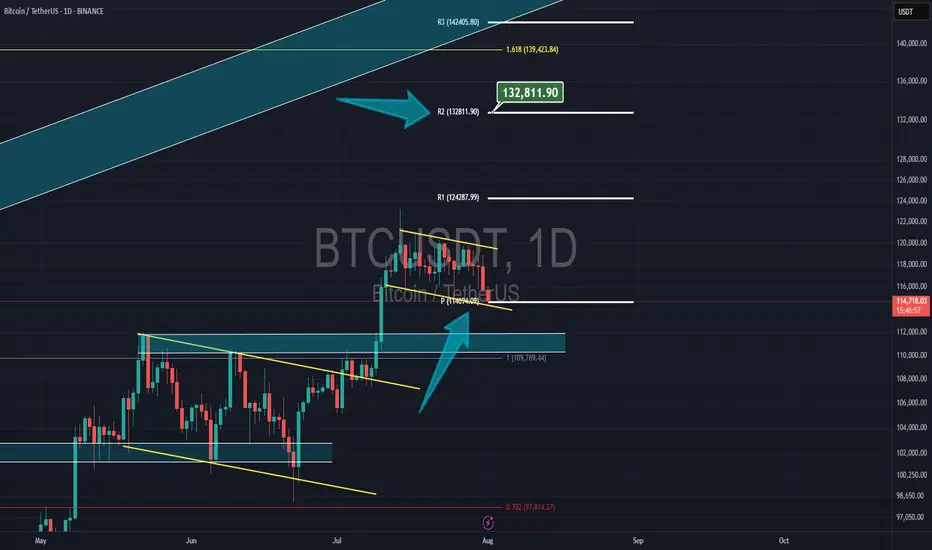
Bitcoin & NEW monthly PivotBitcoin had a correction yesterday but now its still above the new monthly pivot at $14,700 and my target is the 2nd resistance of the pivot at $132,800
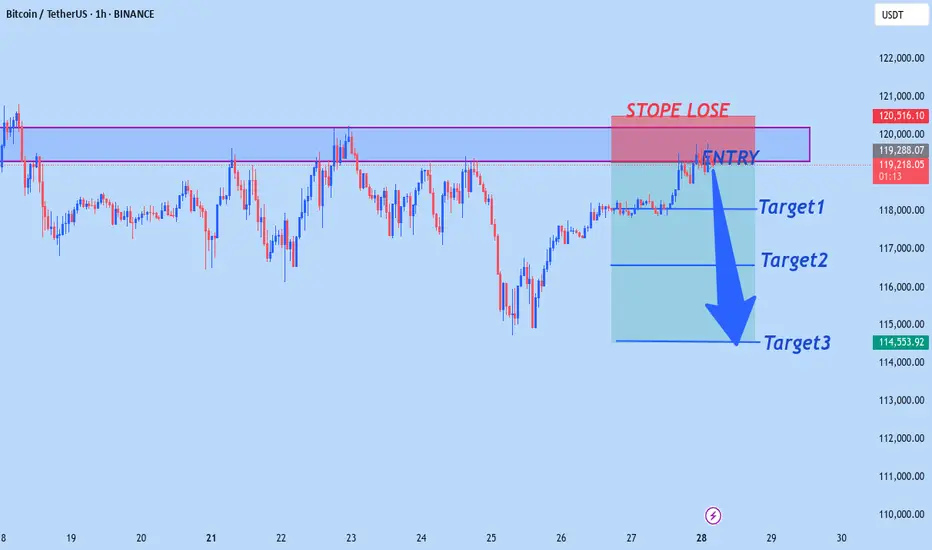
BTCUSD WILL FALLING SOONBtcusd sell from 119,200
Target1 118,000
Target2 116,500
Tagret3 114,500
StopeLose 120,500
Trade at your own risk
BTC ShortAiming for some downside liquidity currently .
First take profit - 0.62 fib
Second take profit - 1 fib

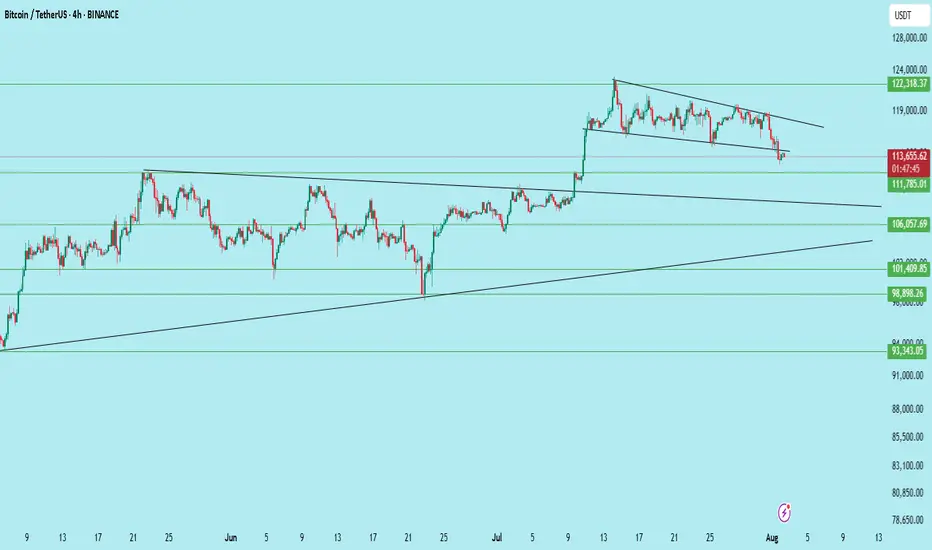
$BTC /USDT – Breakdown from Channel, Bears Gaining ControlBitcoin has broken down from its descending channel on the 4H chart after repeated rejection from the upper trendline. Price is now hovering near key support at $111,785.
Key Technicals:
Rejection from the descending trendline resistance
Breakdown of the mini-channel structure
Current price: $113,637
Support levels:
$111,785 (Immediate)
$106,057
$101,409
$98,398
Bearish continuation is likely if $111,785 breaks with volume
If the $111.7k zone fails to hold, BTC could see further downside toward $106k and even $98k in the coming sessions.
Invalidation: Bullish only on reclaim of $117K+ with strength.
DYOR | Not Financial Advice
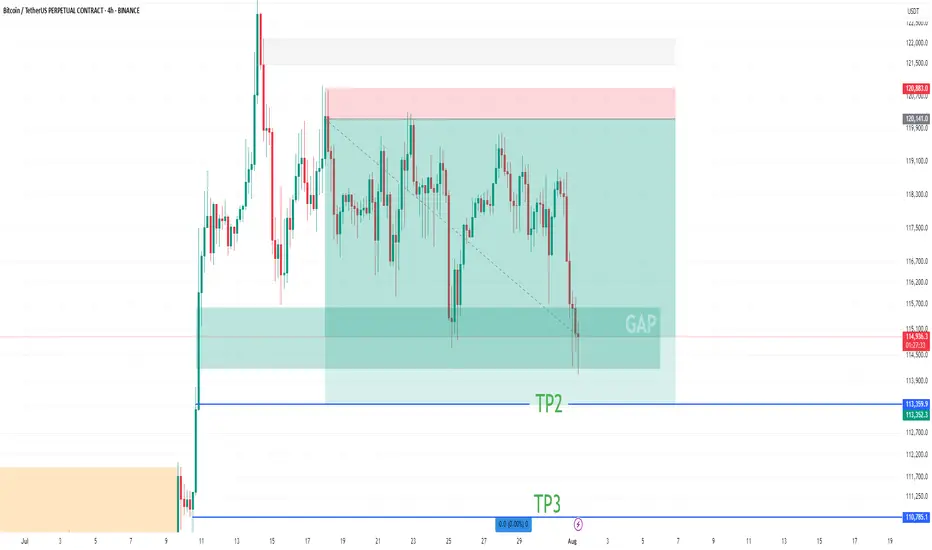
BTC Short Update Hello ❤️
Bitcoin
Let's have an update on Bitcoin analysis
💁♂️ First Target 🔥
Near Second Target
According to the analysis I posted on the page, Bitcoin touched the first target and is now near the second target
It is a good place to save profits. The price gap is filled
Please don't forget to like, share, and boost so that I can analyze it for you with more enthusiasm. Thank you. 💖😍
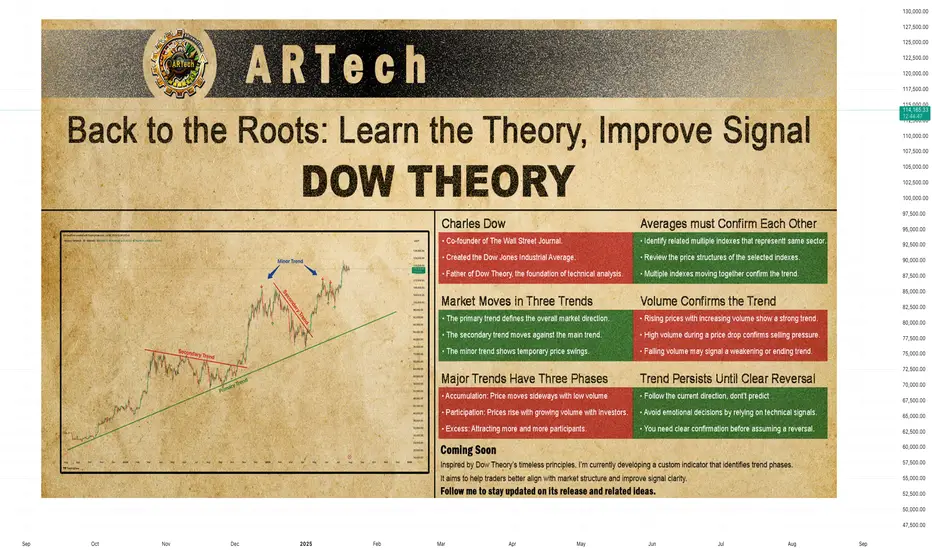
DOW THEORYBack to the Roots: Learn the Theory, Improve Signal
Charles Dow
Before we explore Dow Theory, let’s take a moment to understand who Charles Dow was — and why his ideas still matter today.
Charles Dow wasn’t a financial expert. He was a journalist with a sharp eye for market behavior. In the late 1800s, he began to write about how prices move, how trends form, and what they might mean. His goal was simple: to bring structure and logic to the chaotic world of stock prices.
More importantly, he believed that markets move in trends , and that these trends reflect the collective psychology of all investors. This basic idea became the starting point of technical analysis .
Dow created one of the first stock indexes, which helped investors see the bigger picture instead of focusing only on individual stocks. He also promoted transparency in financial data — long before it was required by law.
In 1889, Dow co-founded The Wall Street Journal, a newspaper that became the voice of financial markets. Through its pages, he published his observations on price behavior, setting the foundation for what would later be known as Dow Theory .
Dow Theory
At the heart of Dow Theory lies a simple but powerful idea:
The market discounts everything.
This means that all known information — earnings reports, interest rates, economic events, political changes, and even future expectations — is already reflected in the price. Price is not random. It is the result of collective investor behavior based on all available knowledge.
Charles Dow didn’t write this exact sentence, but his work clearly reflected this belief. He trusted that by analyzing price movements alone, one could understand the overall direction of the market — because price already includes all the important signals.
Dow and later analysts outlined a set of guiding principles. These are now known as the Six Core Principles of Dow Theory , and they continue to serve as a foundation for modern technical analysis.
The market discounts everything
The market moves in three trends
Major trends have three phases
Averages must confirm each other
Volume confirms the trend
A trend stays in place until it clearly reverses
🔸🔸🔸 The Market Moves in Three Trends 🔸🔸🔸
According to Dow Theory, market movements are not random. Prices move in three different dimensions and time frames: the primary trend , the secondary trend , and the minor (short-term) trend. These three types of movement often occur at the same time. It is very important for an investor to distinguish between them.
The primary trend shows the general direction of the market and can last for months or even years. It’s the major upward or downward movement.
The secondary trend refers to corrections or pullbacks that move in the opposite direction of the primary trend.
The minor trend typically consists of daily or weekly fluctuations and is often considered market “noise.” These short-term movements can occur in the same or opposite direction of the primary trend and may last from a few hours to two or three weeks.
Dow Theory emphasizes that understanding this three-layered structure can protect investors from many mistakes. The theory not only classifies trends but also offers valuable lessons about investor behavior.
It especially highlights the importance of three key principles:
Don’t go against the main trend
Short-term moves can easily confuse traders. Trading against the primary trend often leads to losses. That is why it is crucial to identify the main trend and follow it.
Diversify your exposure
In Dow’s time, technology wasn’t as advanced as it is today, but he still followed multiple indexes (like industrials and transport) to reduce risk. The same principle applies today: investors shouldn’t rely on a single asset — diversification remains a critical part of managing risk.
Define your holding period before entering a trade
Each type of trend comes with a different time expectation. The holding period you choose will play a key role in shaping your trading strategy and aligning it with your financial goals. Instead of debating how long each type of trend should last, it’s more important to define your intended holding period before entering a position.
Your answer to the question “Which holding period suits me?” reflects not only your trading style and lifestyle, but also determines which chart timeframes and indicator timeframes you should use.
🔸🔸🔸 Major Trends Have Three Phases 🔸🔸🔸
According to Dow Theory, major (primary) trends consist of three phases. This structure reflects how investor psychology changes over time and how those emotions are reflected in price action. Regardless of whether the trend is bullish or bearish, each major trend includes these three stages:
Accumulation Phase
The first stage of a bull market often looks like a small bounce during a bear trend. Most people still feel negative about the market. They are afraid to buy again after losing money. Trading volume is low, and prices move in a narrow range. The market stops making new lows, but investors are still unsure. Many have left the market or are very careful now. The price action becomes slow and sideways. It feels boring. But during this quiet time, smart investors slowly start buying. This is how a new trend begins — silently and with doubt.
However, there is no clear signal that a bull market has started. Buying now carries two big risks. First, the market may still go lower. Second, even if a bull trend is coming, no one knows when it will start. How long can you wait while the market does nothing? Holding positions in a flat market has costs — financial, emotional, and missed opportunities elsewhere. That’s why this phase is difficult for most traders to handle.
Public Participation Phase
The market begins to recover, and the broader investor base starts to notice positive changes. News improves, technical indicators give bullish signals. Prices rise, and trading volume increases. This is usually the strongest part of the trend. At this stage, more disciplined and research-driven investors — who follow the market closely — start buying in. They see confirmation in both price action and economic data. Their confidence supports the trend, and momentum grows. The market attracts more attention. Confidence replaces fear. Many investors who stayed out during the earlier phase now feel safer to enter.
Joining the market during this phase is important. The trend is already underway, but there’s still room to grow. Risk is lower than in the early phase, and potential rewards are still high. For many investors, this is the best time to take a position.
Excess Phase
The market enters a phase of excessive optimism. Prices have been rising for a long time, attracting more and more participants. However, during this stage, institutional investors and professional traders who entered earlier begin to gradually take profits.
Although prices remain high, momentum weakens, and the rate of increase slows down. Looking at the volume profile, prices may reach new highs but often without volume support. Technical indicators frequently show bearish divergences. These conditions generate early technical signals that the primary trend may be coming to an end.
🔸🔸🔸 Averages must Confirm Each Other 🔸🔸🔸
According to Dow Theory, a market trend is considered valid only when different indexes move in the same direction. The term “average” here refers to an index or the general direction of a price series. This principle is used to assess whether a price movement is supported by broad market participation.
A single index reaching a new high or low is not enough. For a real and sustainable trend to be confirmed, related indexes are expected to show similar movement and generate signals in the same direction. If this confirmation is missing, the current move may be considered weak or temporary.
How to Analyze It:
Identify related indexes
Choose multiple indexes that represent the same market, sector, or economic domain.
Compare trend direction
Review the price structures of the selected indexes. Are they all showing similar patterns? Did the new highs or lows form around the same time?
Look for confirmation
If multiple indexes form new structures in the same direction (e.g., all make new highs in an uptrend), this increases the validity of the trend.If only one index is moving while others are not participating, confirmation is lacking.
Be cautious without confirmation
When confirmation is missing, trading strategies should be more conservative, or additional signals should be awaited before taking action.
🔸🔸🔸 Volume Confirms the Trend 🔸🔸🔸
According to Dow Theory, the validity of a market trend depends not only on price movement but also on trading volume. For a trend to be considered strong and sustainable, price action should be supported by volume.
Why Is Volume Important?
In a rising market, increasing volume is expected. This indicates growing investor interest and broader participation in the trend.
In a falling market, if the decline happens with high volume, it suggests serious selling pressure and strengthens the trend.
Declining volume may signal a loss of momentum and suggest that the current trend is weakening or nearing its end.
How to Analyze It:
Observe the relationship between price and volume:
Price rising + volume increasing → Strong trend
Price rising + volume decreasing → Lack of confirmation; caution is advised
Check volume during breakouts:
If resistance or highs are broken with strong volume → Reliable signal
If breakouts happen on low volume → May indicate a false move (fakeout)
🔸🔸🔸 A Trend Persists Until a Clear Reversal Occurs 🔸🔸🔸
This core principle of Dow Theory is at the heart of all trend-following strategies.
It states that once a price begins moving in a certain direction, the trend is assumed to continue — until there is clear and technically confirmed evidence that it has ended.
Why Is This Principle Important?
Follow, don’t predict
Instead of guessing what the market will do next, traders stay with the current direction.
Reduces emotional decisions
Trades are based on technical signals, not assumptions like “the price is too high, it must fall.”
A weak trend is not the same as a reversal
Not every pullback means the trend is over. You need clear confirmation before assuming a reversal — such as a breakdown, volume shift, momentum loss, or structural change.
How to Apply It
First, identify the trend direction clearly, and trade in that direction.
Pullbacks are seen as normal movements within the trend — not as reversals.
Even when signs of a reversal appear, wait for confirmation before acting.
Confirmation signals may include:
Failure to form new highs or lows
A break of previous support or resistance
Sudden drop in volume or volume rising in the opposite direction
Weakness or divergence in momentum indicators
Strategic Benefit
This principle is especially useful in trend-following strategies. It helps avoid premature exits and allows traders to stay in profitable trends longer. By focusing on technical confirmation instead of speculation or panic, it encourages disciplined and systematic decision-making.
BITCOIN PREDICTION: HUGE BREAKOUT SOON!! (watch this level) Yello Paradisers! I'm sharing with you multi-timeframe analysis on Bitcoin, levels to watch out for, confirmations we are waiting for, and everything needed for successful professional trading that is being profitable in the long run.
I'm sharing with you zig-zag from the Elliot Wave pattern formation. I'm also sharing a possible impulse we are going through, a head and shoulders pattern and its target, and the next major resistance and support levels.
I'm sharing with you a contracting triangle setup and how to trade it, along with an ending diagonal setup and how to trade it. Watch out for confirmations and how the price is developing based on what I have been talking about in this video, then trade it as a professional trader should.
Make sure that you have a great risk management, trading strategy, and tactic for entering the trades. I have explained some tactics that I'm watching for in this video, but make sure that all these tactics are well within your larger trading strategy and that you're approaching the market professionally. Don't try to get rich quick.
Make sure that you are focusing on long-term profitability and survival. This is the only way you can make it in crypto trading!


Teach me to fish, don’t hand me the catch.
---
🎯 **“Teach me to fish, don’t hand me the catch.”**
That’s the mantra behind what we do.
We’re not here to hand you quick wins—we’re here to equip you with the tools, mindset, and precision to master the art of **technical analysis**.
📚 **Follow Us** as we unlock proven strategies, crafted through years of experience and sharpened by real market conditions.
💼 **What You'll Get:**
- High-performance analysis techniques
- Visual case studies from our **actual trades**
- Clear examples from the insurance sector and beyond
- A blueprint to recognize and seize winning setups with confidence
💥 Whether you're new or seasoned, this isn't textbook theory.
This is **applied strategy**, built for clarity and verified by results.
---
