4RRI Think the likelihood that we may have finished moving down on bitcoin is over, however, even if that is not the case, This may be a nice trade!
USDTBTC trade ideas

BTC, ETH & Market Structure Outlook – Is the Pullback Over or Ju
💎🚀 BTC, ETH & Market Structure Outlook – Is the Pullback Over or Just Beginning? 🔥♦️
🧠 Dow Theory | Multi-Cycle Technical Breakdown | Index Watch
👉 Don't forget to LIKE, FOLLOW, and COMMENT to support the content!
♦️ BTC/USDT Analysis
🔻 The key support at 115,725 was broken – but has the macro trend turned bearish? Not yet.
📉 From the HWC (1D) perspective, BTC has dropped only ~4.5%, which still looks like a pullback.
🟥 However, if price stabilizes below 109,000, we will begin shifting to a bearish macro bias.
🧠 Weakness in trend is present but not confirmed.
🔄 MWC (4H) – Sideways, Then Breakdown
📊 After a strong rally, BTC ranged for about 17 days, then broke below the range support.
🔽 The 4H trend leans bearish, but it's not a strong or confirmed downtrend.
⏱️ LWC (1H) – Clearly Bearish
📉 Lower highs and lower lows are forming. The trend is decisively downward in 1H.
🚀 Bullish Scenario:
If BTC bounces from 112,000, we need:
• A strong new high
• A healthy pullback
• A breakout of the new high → then long entries are valid
❗ Bearish Scenario:
If 109,000 breaks with volume → strong bearish continuation likely.
♦️ ETH/USDT Analysis
🔸 The 3538 level is key.
✅ If ETH shows clear reaction, followed by a breakout, a long position becomes valid.
⚠️ But only after a confirmed trend shift on the 4H timeframe.
♦️ Top Altcoins
⭕ Most alts are in an uncertain phase.
🕒 It's best to wait until new highs/lows and a valid structure are formed.
♦️ BTC Dominance (BTC.D)
💥 BTC.D broke through the critical 62.22 level.
🟡 Now we wait: Will it hold above or fake out and reverse?
🔻 If BTC is dropping while BTC.D is rising →
👉 Result: BTC drops moderately, but alts drop much harder.
♦️ USDT Dominance (USDT.D)
📉 This chart reflects market fear & greed.
Currently showing reduced greed (risk-off behavior).
🔸 Next resistance levels: 4.63 and 4.72
❗ If these break → bearish bias becomes dominant.
⭕ However, a fakeout here could create a fast early entry opportunity.
♦️ TOTAL Market Cap
📍 Market is sitting on a major support level – but BTC remains the key driver.
❗ No confirmed long setups until BTC structure shifts bullish.
♦️ Strategic Outlook
1️⃣ Not a good time to open fresh positions – wait for clear 4H structure formation
2️⃣ Bias remains bullish overall, but waiting for confirmation
3️⃣ Until BTC trend clearly reverses, we are not focused on BTC.D reversals – they remain secondary
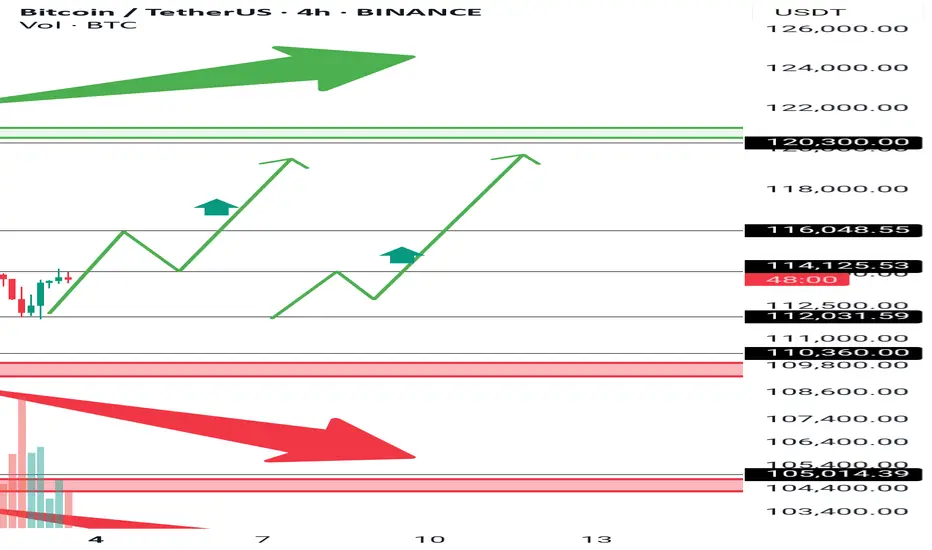
4️⃣ On the Bitcoin chart, you can see another red zone — breaking the first one will invalidate the bullish outlook, and breaking the second one will trigger a search for short positions.
5️⃣ To return to a strong uptrend, breaking the green zone around 120,000.00 is essential.
6️⃣ I’ve drawn two green upward paths on the chart. I’ll be looking for such a path for an early long entry.
💎 Stay cautious, manage risk, and follow structure!
🚀 Smash that ROCKET, leave a LIKE, and hit FOLLOW for daily crypto insights!
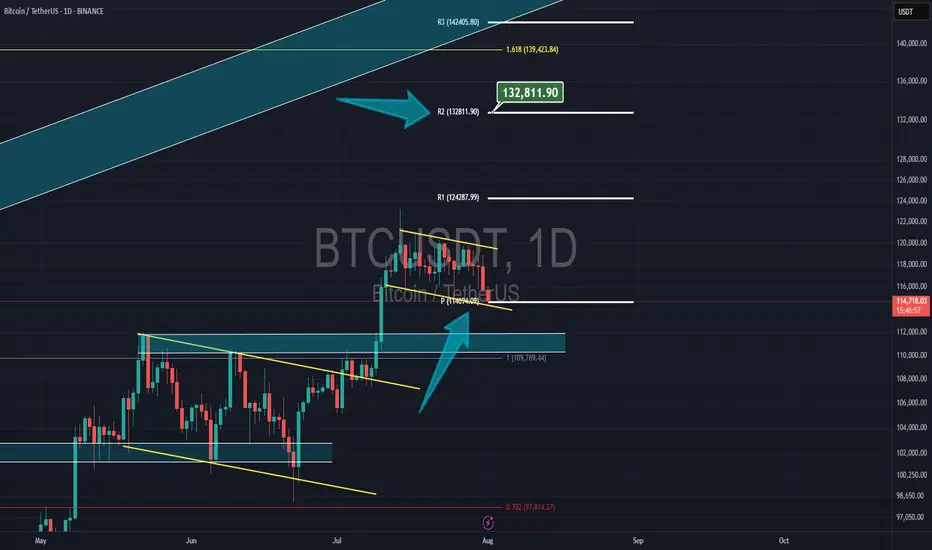
Bitcoin & NEW monthly PivotBitcoin had a correction yesterday but now its still above the new monthly pivot at $14,700 and my target is the 2nd resistance of the pivot at $132,800
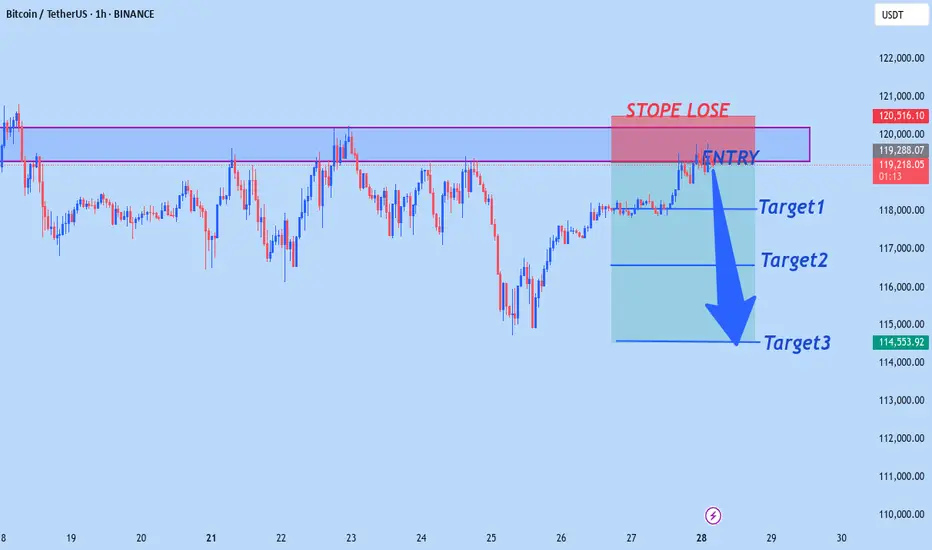
BTCUSD WILL FALLING SOONBtcusd sell from 119,200
Target1 118,000
Target2 116,500
Tagret3 114,500
StopeLose 120,500
Trade at your own risk
BTCUSDT #056 ( Is it clear Road map ? )Hello dear traders.
Good days . First of all thanks for your comment and support.
-----------------------------------------------------------------------------------------------
On long term Gann Square, BTCUSDT stuck below 0.382 Gann Box price level.
With refer to all Daily bullish Gann Square ( Blue Square) of bitcoin, it is expected to fill up at least 0.75 Daily Gann Square up to 97 percent which will be 135-150 k for this bullish cycle .
Safe trades and good luck.

Update: Bull or Bear?I optimized and updated my trend lines. We have a fake breakout on there
What's your Idea? Bull or Bear?

Calling the Unthinkable: Why a Bitcoin Drop May Be ComingCOINBASE:BTCUSD BITSTAMP:BTCUSD OKX:BTCUSD BINANCE:BTCUSDT.P
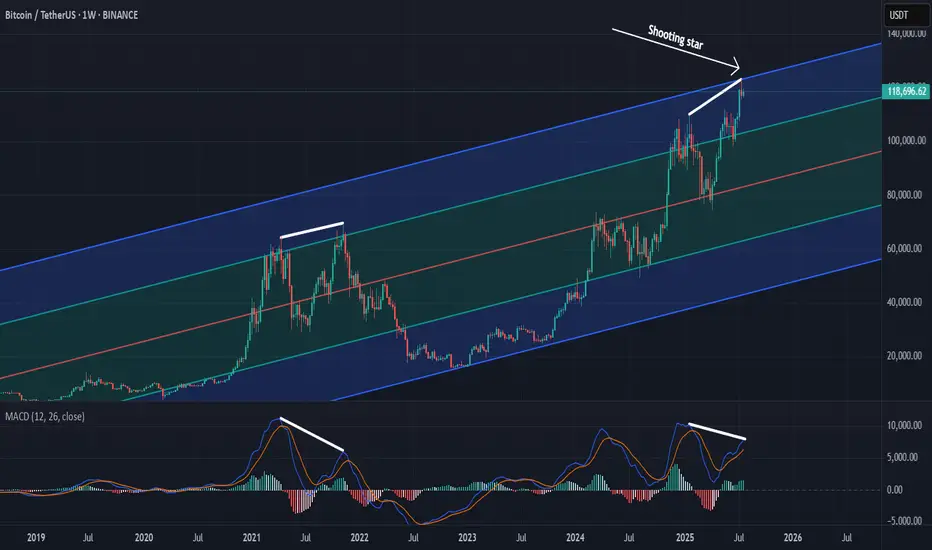
Predicting a drop in Bitcoin's price during a strong uptrend is extremely difficult and calling it takes real courage. It puts my credibility at risk, but based on everything I see, I believe BTC has reached dangerously high levels.
From a psychological perspective , investor behavior is sending warning signs. There’s a rush of people buying in out of FOMO, amplified by heavy promotion on social media and mainstream claiming BTC is the safest investment out there. Many who missed earlier buying opportunities now regret betting on altcoins instead, and they see this as a last chance to profit. Even if BTC drops below their entry points, most of these “late buyers” won’t sell. They’ll convince themselves it’s just another minor correction like what happened in the previous 2 years, and that they’re in it for the long term.
From a technical analysis point, the signs are just as concerning. A “ shooting star ” candle has formed on the weekly chart. This candle is often seen at market tops. The MACD histogram on the same timeframe is showing a potential divergence, suggesting weakening momentum. The Fear and Greed Index is approaching 70, indicating strong market greed. On top of that, traders are opening high-leverage long positions in anticipation of another big bullish candle.
These technical and psychological signals combined paint a risky picture. If this kind of setup is confirmed , it will lead to sharp corrections.
BTCUSDT 4H Chart UpdateBitcoin has successfully broken out of the descending wedge, retested the support zone near $117K, and is now showing signs of a bullish continuation.
If momentum holds, price could aim for the $122K–$124K range next.
Structure remains bullish as long as it stays above the retest zone.

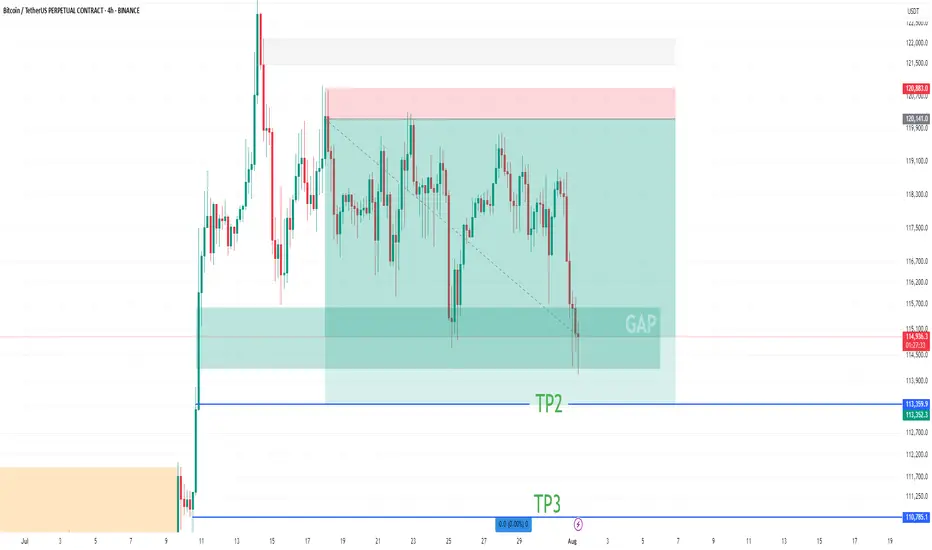
BTC ShortAiming for some downside liquidity currently .
First take profit - 0.62 fib
Second take profit - 1 fib

BTC Short Update Hello ❤️
Bitcoin
Let's have an update on Bitcoin analysis
💁♂️ First Target 🔥
Near Second Target
According to the analysis I posted on the page, Bitcoin touched the first target and is now near the second target
It is a good place to save profits. The price gap is filled
Please don't forget to like, share, and boost so that I can analyze it for you with more enthusiasm. Thank you. 💖😍
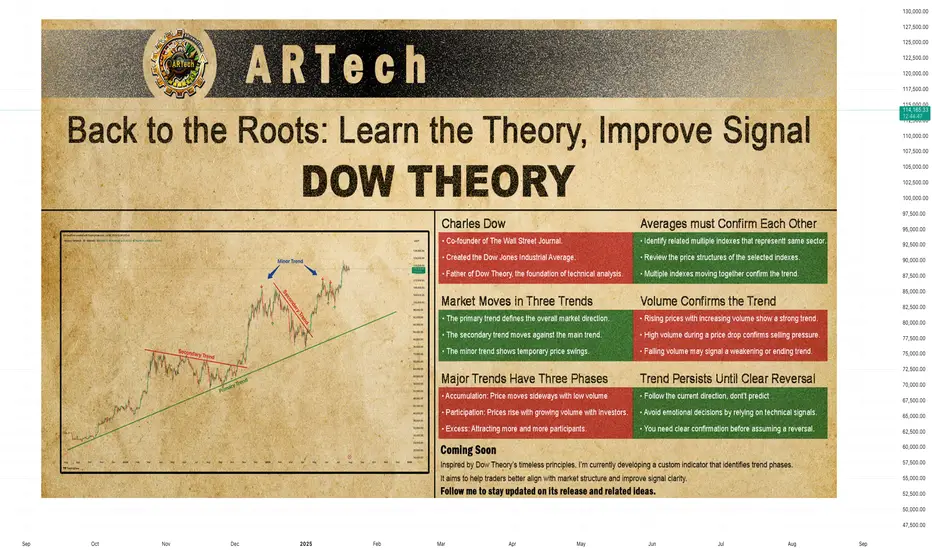
DOW THEORYBack to the Roots: Learn the Theory, Improve Signal
Charles Dow
Before we explore Dow Theory, let’s take a moment to understand who Charles Dow was — and why his ideas still matter today.
Charles Dow wasn’t a financial expert. He was a journalist with a sharp eye for market behavior. In the late 1800s, he began to write about how prices move, how trends form, and what they might mean. His goal was simple: to bring structure and logic to the chaotic world of stock prices.
More importantly, he believed that markets move in trends , and that these trends reflect the collective psychology of all investors. This basic idea became the starting point of technical analysis .
Dow created one of the first stock indexes, which helped investors see the bigger picture instead of focusing only on individual stocks. He also promoted transparency in financial data — long before it was required by law.
In 1889, Dow co-founded The Wall Street Journal, a newspaper that became the voice of financial markets. Through its pages, he published his observations on price behavior, setting the foundation for what would later be known as Dow Theory .
Dow Theory
At the heart of Dow Theory lies a simple but powerful idea:
The market discounts everything.
This means that all known information — earnings reports, interest rates, economic events, political changes, and even future expectations — is already reflected in the price. Price is not random. It is the result of collective investor behavior based on all available knowledge.
Charles Dow didn’t write this exact sentence, but his work clearly reflected this belief. He trusted that by analyzing price movements alone, one could understand the overall direction of the market — because price already includes all the important signals.
Dow and later analysts outlined a set of guiding principles. These are now known as the Six Core Principles of Dow Theory , and they continue to serve as a foundation for modern technical analysis.
The market discounts everything
The market moves in three trends
Major trends have three phases
Averages must confirm each other
Volume confirms the trend
A trend stays in place until it clearly reverses
🔸🔸🔸 The Market Moves in Three Trends 🔸🔸🔸
According to Dow Theory, market movements are not random. Prices move in three different dimensions and time frames: the primary trend , the secondary trend , and the minor (short-term) trend. These three types of movement often occur at the same time. It is very important for an investor to distinguish between them.
The primary trend shows the general direction of the market and can last for months or even years. It’s the major upward or downward movement.
The secondary trend refers to corrections or pullbacks that move in the opposite direction of the primary trend.
The minor trend typically consists of daily or weekly fluctuations and is often considered market “noise.” These short-term movements can occur in the same or opposite direction of the primary trend and may last from a few hours to two or three weeks.
Dow Theory emphasizes that understanding this three-layered structure can protect investors from many mistakes. The theory not only classifies trends but also offers valuable lessons about investor behavior.
It especially highlights the importance of three key principles:
Don’t go against the main trend
Short-term moves can easily confuse traders. Trading against the primary trend often leads to losses. That is why it is crucial to identify the main trend and follow it.
Diversify your exposure
In Dow’s time, technology wasn’t as advanced as it is today, but he still followed multiple indexes (like industrials and transport) to reduce risk. The same principle applies today: investors shouldn’t rely on a single asset — diversification remains a critical part of managing risk.
Define your holding period before entering a trade
Each type of trend comes with a different time expectation. The holding period you choose will play a key role in shaping your trading strategy and aligning it with your financial goals. Instead of debating how long each type of trend should last, it’s more important to define your intended holding period before entering a position.
Your answer to the question “Which holding period suits me?” reflects not only your trading style and lifestyle, but also determines which chart timeframes and indicator timeframes you should use.
🔸🔸🔸 Major Trends Have Three Phases 🔸🔸🔸
According to Dow Theory, major (primary) trends consist of three phases. This structure reflects how investor psychology changes over time and how those emotions are reflected in price action. Regardless of whether the trend is bullish or bearish, each major trend includes these three stages:
Accumulation Phase
The first stage of a bull market often looks like a small bounce during a bear trend. Most people still feel negative about the market. They are afraid to buy again after losing money. Trading volume is low, and prices move in a narrow range. The market stops making new lows, but investors are still unsure. Many have left the market or are very careful now. The price action becomes slow and sideways. It feels boring. But during this quiet time, smart investors slowly start buying. This is how a new trend begins — silently and with doubt.
However, there is no clear signal that a bull market has started. Buying now carries two big risks. First, the market may still go lower. Second, even if a bull trend is coming, no one knows when it will start. How long can you wait while the market does nothing? Holding positions in a flat market has costs — financial, emotional, and missed opportunities elsewhere. That’s why this phase is difficult for most traders to handle.
Public Participation Phase
The market begins to recover, and the broader investor base starts to notice positive changes. News improves, technical indicators give bullish signals. Prices rise, and trading volume increases. This is usually the strongest part of the trend. At this stage, more disciplined and research-driven investors — who follow the market closely — start buying in. They see confirmation in both price action and economic data. Their confidence supports the trend, and momentum grows. The market attracts more attention. Confidence replaces fear. Many investors who stayed out during the earlier phase now feel safer to enter.
Joining the market during this phase is important. The trend is already underway, but there’s still room to grow. Risk is lower than in the early phase, and potential rewards are still high. For many investors, this is the best time to take a position.
Excess Phase
The market enters a phase of excessive optimism. Prices have been rising for a long time, attracting more and more participants. However, during this stage, institutional investors and professional traders who entered earlier begin to gradually take profits.
Although prices remain high, momentum weakens, and the rate of increase slows down. Looking at the volume profile, prices may reach new highs but often without volume support. Technical indicators frequently show bearish divergences. These conditions generate early technical signals that the primary trend may be coming to an end.
🔸🔸🔸 Averages must Confirm Each Other 🔸🔸🔸
According to Dow Theory, a market trend is considered valid only when different indexes move in the same direction. The term “average” here refers to an index or the general direction of a price series. This principle is used to assess whether a price movement is supported by broad market participation.
A single index reaching a new high or low is not enough. For a real and sustainable trend to be confirmed, related indexes are expected to show similar movement and generate signals in the same direction. If this confirmation is missing, the current move may be considered weak or temporary.
How to Analyze It:
Identify related indexes
Choose multiple indexes that represent the same market, sector, or economic domain.
Compare trend direction
Review the price structures of the selected indexes. Are they all showing similar patterns? Did the new highs or lows form around the same time?
Look for confirmation
If multiple indexes form new structures in the same direction (e.g., all make new highs in an uptrend), this increases the validity of the trend.If only one index is moving while others are not participating, confirmation is lacking.
Be cautious without confirmation
When confirmation is missing, trading strategies should be more conservative, or additional signals should be awaited before taking action.
🔸🔸🔸 Volume Confirms the Trend 🔸🔸🔸
According to Dow Theory, the validity of a market trend depends not only on price movement but also on trading volume. For a trend to be considered strong and sustainable, price action should be supported by volume.
Why Is Volume Important?
In a rising market, increasing volume is expected. This indicates growing investor interest and broader participation in the trend.
In a falling market, if the decline happens with high volume, it suggests serious selling pressure and strengthens the trend.
Declining volume may signal a loss of momentum and suggest that the current trend is weakening or nearing its end.
How to Analyze It:
Observe the relationship between price and volume:
Price rising + volume increasing → Strong trend
Price rising + volume decreasing → Lack of confirmation; caution is advised
Check volume during breakouts:
If resistance or highs are broken with strong volume → Reliable signal
If breakouts happen on low volume → May indicate a false move (fakeout)
🔸🔸🔸 A Trend Persists Until a Clear Reversal Occurs 🔸🔸🔸
This core principle of Dow Theory is at the heart of all trend-following strategies.
It states that once a price begins moving in a certain direction, the trend is assumed to continue — until there is clear and technically confirmed evidence that it has ended.
Why Is This Principle Important?
Follow, don’t predict
Instead of guessing what the market will do next, traders stay with the current direction.
Reduces emotional decisions
Trades are based on technical signals, not assumptions like “the price is too high, it must fall.”
A weak trend is not the same as a reversal
Not every pullback means the trend is over. You need clear confirmation before assuming a reversal — such as a breakdown, volume shift, momentum loss, or structural change.
How to Apply It
First, identify the trend direction clearly, and trade in that direction.
Pullbacks are seen as normal movements within the trend — not as reversals.
Even when signs of a reversal appear, wait for confirmation before acting.
Confirmation signals may include:
Failure to form new highs or lows
A break of previous support or resistance
Sudden drop in volume or volume rising in the opposite direction
Weakness or divergence in momentum indicators
Strategic Benefit
This principle is especially useful in trend-following strategies. It helps avoid premature exits and allows traders to stay in profitable trends longer. By focusing on technical confirmation instead of speculation or panic, it encourages disciplined and systematic decision-making.
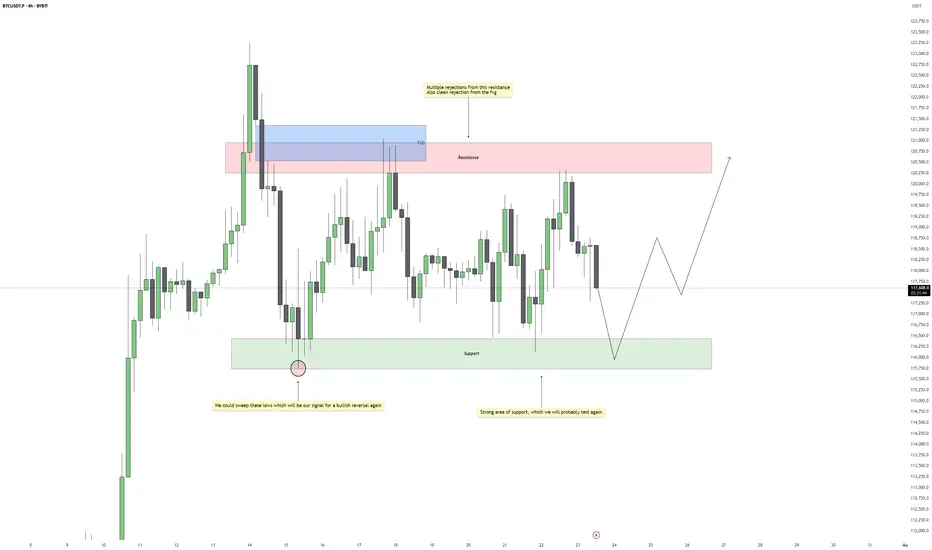
Bitcoin - Bullish Reversal PotentialBitcoin is currently consolidating within a well-defined range, with repeated rejections from the upper resistance zone and strong reactions from the support below. Price continues to respect both ends of the structure, suggesting that liquidity is being built up on both sides. Until a clear breakout occurs, we should expect more range-bound movement with sharp rejections near the boundaries.
Support Zone and Liquidity Engineering
The support zone beneath current price action has already held several times, showing clear buying interest. However, the lows around this area remain relatively clean. A sweep of those lows would not only engineer sell-side liquidity but also set the stage for a reversal if buyers step back in. This would align well with typical accumulation behavior seen during consolidation phases.
Rejections from Resistance and FVG Influence
Price has shown multiple rejections from the resistance zone, particularly inside the fair value gap that sits just above it. This confirms that the area is actively defended and will likely be the next upside target if price manages to bounce from support. The FVG itself acts as a magnet once price begins to trend again, especially if a strong displacement follows a sweep.
Expected Flow and Trade Opportunity
The anticipated scenario involves price dipping back into support, possibly sweeping the lows for inducement, and then bouncing with a shift in short-term structure. If that happens, we can expect a move back toward resistance, completing another rotation within the range. The sweep would offer an added layer of confirmation, giving a stronger reason to look for long setups.
Invalidation and Risk Perspective
If support fails to hold and price breaks beneath the range without immediate recovery, that would invalidate the bullish view and point to a potential shift in directional bias. As long as price stays inside the current consolidation, however, this remains a waiting game for either a clean reaction from support or a sweep followed by structure shift.
Conclusion
Bitcoin remains locked in a clear range, and until the breakout happens, the edges of that range offer the best trading opportunities. A sweep of the lows would act as a high-probability signal for a reversal back to the highs. Patience is key, wait for the sweep and confirmation before committing to the upside.
___________________________________
Thanks for your support!
If you found this idea helpful or learned something new, drop a like 👍 and leave a comment, I’d love to hear your thoughts! 🚀
Teach me to fish, don’t hand me the catch.
---
🎯 **“Teach me to fish, don’t hand me the catch.”**
That’s the mantra behind what we do.
We’re not here to hand you quick wins—we’re here to equip you with the tools, mindset, and precision to master the art of **technical analysis**.
📚 **Follow Us** as we unlock proven strategies, crafted through years of experience and sharpened by real market conditions.
💼 **What You'll Get:**
- High-performance analysis techniques
- Visual case studies from our **actual trades**
- Clear examples from the insurance sector and beyond
- A blueprint to recognize and seize winning setups with confidence
💥 Whether you're new or seasoned, this isn't textbook theory.
This is **applied strategy**, built for clarity and verified by results.
---

TC Analysis – Watching That Trendline Closely!Hello guys!
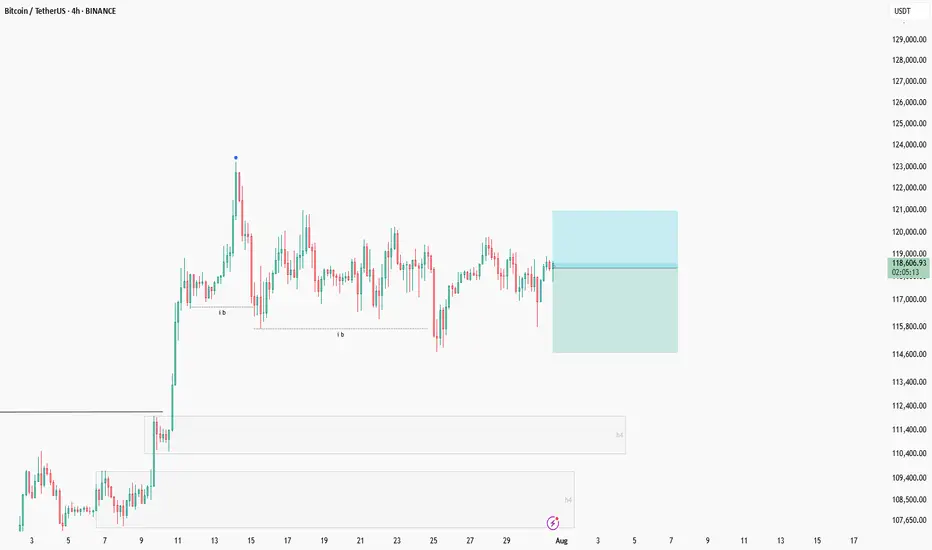
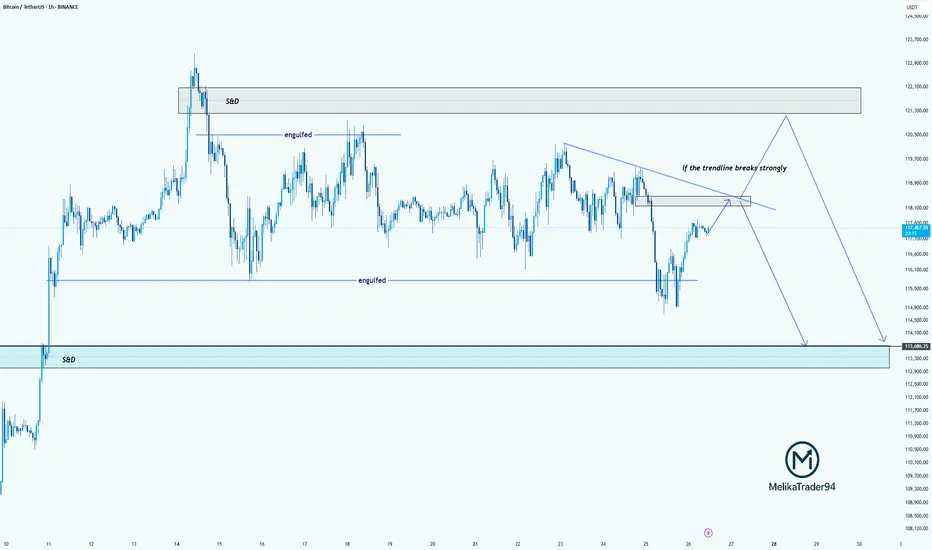
Bitcoin is currently approaching a key decision point. As highlighted on the chart, we’ve got a descending trendline acting as strong resistance. If this trendline breaks with strength, we may see price push up into the supply & demand zone around 121,000–122,000 before potentially reversing.
However, if the trendline holds, this current move could be a retest, setting up for another drop. The engulfed level at 114,000 has already been tested once, and if we break below that again, the price could slide down into the S&D demand zone around 113,000–112,000.
summry:
Trendline resistance is critical right now
Watch for a strong breakout or a fakeout & rejection
Possible bearish continuation if we fail to reclaim above 118,500
Let’s see how BTC reacts around this zone.
[SeoVereign] BITCOIN BULLISH Outlook – August 1, 2025We are the SeoVereign Trading Team.
With sharp insight and precise analysis, we regularly share trading ideas on Bitcoin and other major assets—always guided by structure, sentiment, and momentum.
🔔 Follow us to never miss a market update.
🚀 Boosts provide strong motivation and drive to the SeoVereign team.
--------------------------------------------------------------------------------------------------------
Hello.
This is SeoVereign.
My fundamental view on Bitcoin, as mentioned in the previous idea, is that I am anticipating an overall downward trend. In the mid- to long-term, I believe the downward pressure will gradually increase, and this is partially confirmed by various indicators and the overall market sentiment.
However, before we fully enter this downward phase, I have been judging that one more upward wave is likely to remain. I have focused my strategy on capturing this upward segment, and I have recently reached a point where I can specifically predict the development of that particular wave.
If this upward move unfolds successfully, I plan to set my take-profit range conservatively. The reason is simple: I still believe there is a high possibility that the market will shift back into a downtrend afterward. The core of this strategy is to minimize risk while realizing profits as efficiently as possible toward the tail end of the wave.
The relevant pattern and structure have been marked in detail on the chart, so please refer to it for a clearer understanding.
In summary, I view this rise as a limited rebound that could represent the last opportunity before a downturn, and I believe this idea marks the beginning of that move.
I will continue to monitor the movement and update this idea with additional evidence. Thank you.

BTC Moon Phase, Dominance % and BBWP resolutionBTC, D. Moon Phase. I see bearish scenario for the next days, until 4-5th of August. After reviewing Moon Phase chart for last year+, I see same scenario is happening most of the times. During the First Quarter ( Aug. 1) of the phase, price is dropping and start to recover about 4-5 days prior Full Moon. This is exactly when energy of the Full Moon starting to amplify. Current BBWP is contracted for 8 days, making the next move very rapid, I would not set any long/short trades, untill the volume start to expand. Its the mid summer - always slow and August is the month it start to accelerate towards the Fall, with all financial/political tricks happening in September and later in Q4. We already had one bear trap fakeout, but price didnt anticipate to go higher and got rejected by falling wedge upper like ( or bull flag, in this case).I would expect that high volume green candle will be either fully recovered to $110-111K , or 75% recovery, where the CME gap is $113500 - 1-2% lower, making it $113,000. The cascade liquidation will happen very fast, I expect the whole move down and up will take around 24 hours, with the bottom time 5-15 minutes. Need to be ready, that all alts will crash as well, Im expecting BTC %dominance to bounce here , after 8.4% drop to weekly 50EMA. I would like to see BTC, D% at 70% by Christmas and new ATH, what ever it is 160K or 200K what ever it is, for bitcoin to make ATH, it must grab dominance.

Unmasking the 5-0 Harmonic Pattern
---
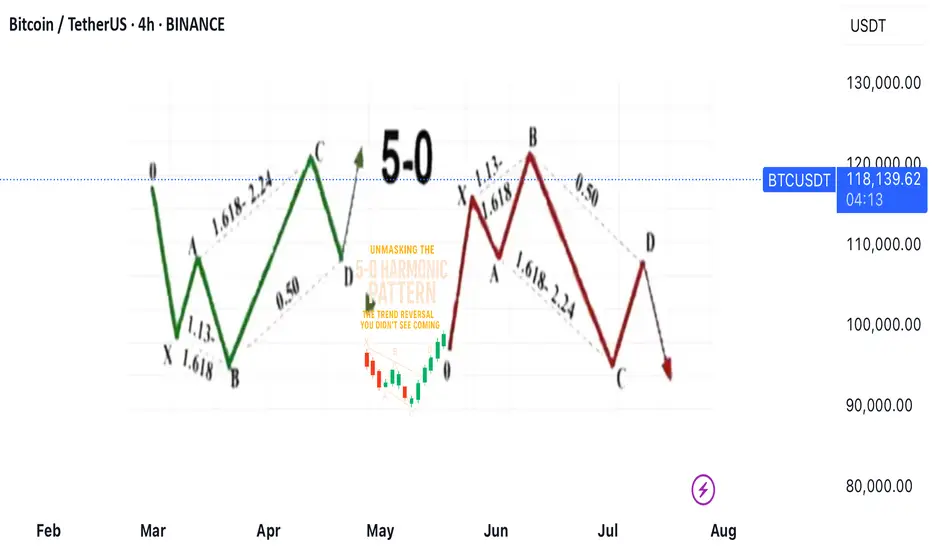
🎯 **Unmasking the 5-0 Harmonic Pattern: The Trend Reversal You Didn't See Coming**
Discovered by the visionary Scott Carney and unveiled in _Harmonic Trading, Volume Two_, the **5-0 pattern** isn't just another blip on a trader’s radar—it’s a siren of market reversal.
📈 **Why It Stands Out**
- Unlike the familiar Bat or Gartley structures, the 5-0 pattern is fueled by **precise Fibonacci ratios**, making its reversal zone deadly accurate.
- Centered around the pivotal **Point B**, this model doesn’t just hint at change—it defines it.
🌀 **The Anatomy of a Flip**
- Often marking the **first true pullback in a major trend reversal**, the 5-0 isn’t a lagging indicator—it’s your early warning system.
- The **AB leg?** That’s no ordinary wave—it’s usually the final gasp of a fading trend, setting the stage for powerful new momentum.
💥 **Bottom Line**
This isn’t just technical analysis—it’s strategic foresight. The 5-0 pattern reveals where the market **hesitates... and where you strike**.
---
_"To truly learn, we must see it in action.
So let’s pull back the curtain and share a powerful example from our **past insurance market trades**—a deal that blended precision, timing, and strategy.
In comments
BTC in a Sideways MovementBTC in a Sideways Movement: When the Market Froze, Psychology Starts to Fail
Honestly, this is one of the most difficult stages in the market - uncertainty without a clear direction. Bitcoin gets stuck between levels, giving false breakouts and immediately rolling back. It seems that something serious is about to happen, but in reality, nothing happens.
This kind of price movement often leads to emotional burnout of traders. Some start entering trades blindly, just to stay in the market. Others suffer a series of small losses, trying to guess the breakout. And some just close the charts, unable to cope with the silence.
The reality is that markets get tired too, especially after big moves. What we are seeing now with BTC is probably just a rebalancing phase. And that's okay. If there is no clear pattern, then this is not your trade.
For now, I am just watching, marking the boundaries of the range and waiting. For myself, I highlight the order block for 1D as zones of interest, I wait for a reaction from it and will look for a model to enter a position.
Any breakthrough, confirmed by volume and subsequent movement - that's when the next real movement will begin.
The main thing is not to waste energy in vain. Sideways movement is not eternal. After silence, movement always comes.

BTC OUTLOOK Bitcoin returns to $119,000 after a CME gap fill as new Galaxy Digital exchange transactions fail to sway the market mood.
Nerves over “OG” BTC sales seem to have passed after last week’s 80,000 BTC transaction.
Trading circles still see the potential for another BTC price dip.

BTC Elliot Wave Double Combo CorrectionToday, I observed that Bitcoin may be unfolding within a complex double corrective wave structure—specifically a WXY pattern—potentially culminating in a contracting triangle.
Such corrective formations represent a temporal pullback, wherein the market undergoes a period of consolidation following an impulsive advance, also referred to as a pullback in time. This phase often serves as a mechanism for establishing structural support within a defined range prior to a continuation move.
A key point of uncertainty lies in whether the integrity of the triangle has been compromised by the recent, pronounced liquidity sweep. From the perspective of both the daily and 4-hour charts, this move resembles a classic deviation or "fake-out" rather than a legitimate breakout.
Nonetheless, the market may remain in a state of indecision for a few more sessions, characterized by erratic or range-bound price action, before committing to a more definitive trend.
A sustained break and successful retest above the 120K level would serve as a strong technical confirmation that Bitcoin intends to pursue higher valuations.
BTC - 1H Elliott Wave AnalysisWelcome back to another Elliott Wave Analysis for Bitcoin! :)
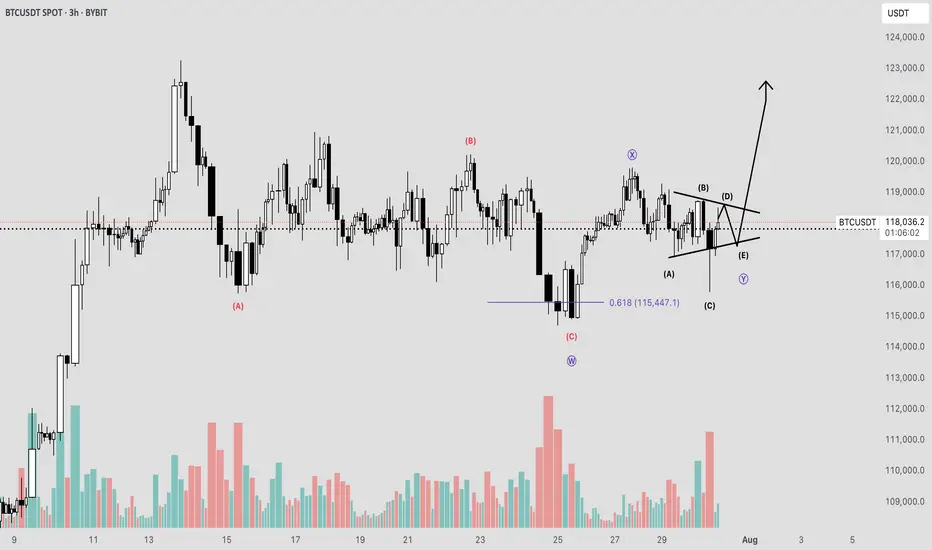
In this analysis we want to focus on the short term. We have been in a correction displayed as pink ABC and it seems that this correction is coming or has come to an end in the pink Wave C.
It is hard to say if the pink Wave C has finished yet. The last low at 111'850 USD is the 1 to 1 ratio of the pink Wave A to the pink Wave C which is a common target for Wave C.
Looking at the sub-count in white we think another low in white Wave 5 would look cleaner but it is not given to happen.
For now we added the white Wave 4 resistance of which we touched the 0.5 FIB retracement at 115'830 USD which is a rather deep but valid Wave 4. We also added the 0.618 FIB at 116'213 USD which would be the invalidation for the white Wave 4. If we hit it the probabilities shift to the case that the low at 111'850 USD is already the end of pink Wave C.
If we get white Wave 5 the first target would be at the 1 to 1 FIB at 111'319 USD which is right below the last ATH of which we bounced recently but that seems a bit shallow.
The next target would be at around 109'700 USD where we got some confluence between the 1.38 FIB target for white Wave 5 measured with the white Wave 1 as well as the 1.618 FIB target if we measure of the white Wave 4. It is also close to the 0.5 FIB of a bigger support area.
Be aware that the bigger support area below goes down to 103'000 USD which is the 0.786 FIB of the support area.
Due it looking likely that pink Wave C is finished we also added the support area for the potential Wave 2 in the bullish scenario.
It is between the 0.5 FIB at 113'640 USD and the 0.786 FIB at 112'616 USD. From this area we would like to see a bounce if the low is already in.
Thanks for reading.
We would appreciate a follow and boost if you like the analysis! :)
NO FINANCIAL ADVICE.

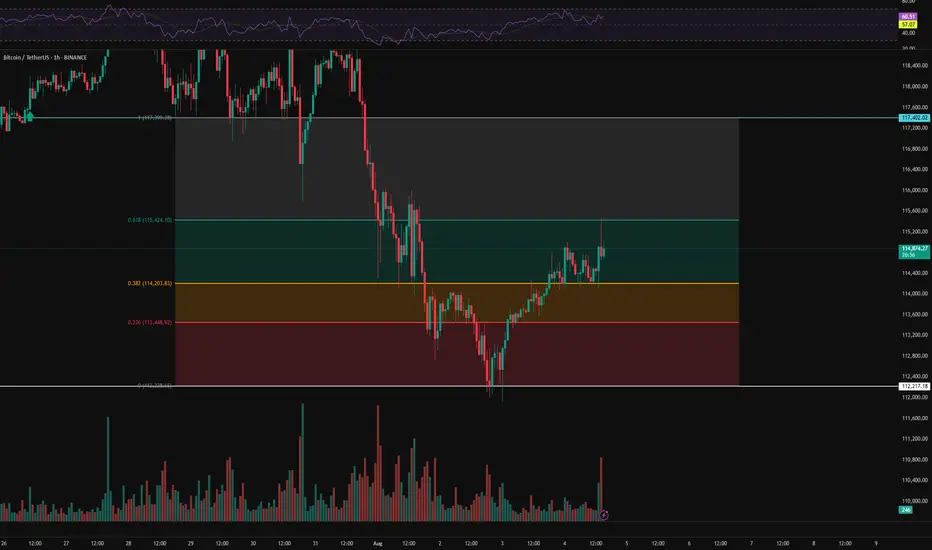
BTC Hourly Analysis – Day 1 | Trend Structure & Key Reactions⏱️ We’re analyzing Bitcoin on the 1-hour timeframe.
👀 After breaking below its support zone at 107,402, Bitcoin experienced a correction along with increasing sell pressure. The price then moved toward the 112,200 support area, where it formed a V-pattern — which has now been broken to the upside.
🎮 We’re using Fibonacci levels to identify key resistance zones and long-entry triggers. A higher low has formed above the 112,217 support and above the 0.382 Fib level, which could serve as a strong confirmation of the breakout .
⚙️ The RSI oscillator on the 1H chart is currently above 50. If buying volume increases, RSI may enter the Overbought zone. The critical level here is 70 — breaking above it can act as a confirmation for a long position .
☄️ A specific Fibonacci-based zone, linked to market maker sellers and supply pressure, was touched, triggering a reaction — around 177 BTC were sold following that touch .
🖥 Summary : As long as Bitcoin stays above its previous high, there’s no immediate concern for long positions. Based on the confirmations above, you may consider entering a long position upon a resistance breakout and taker-seller zone clearance .
📉 No short positions are planned until the 110,000 support level is clearly broken .