Bearish sign on BTC targeting 97kmy idea on btc as per the chart watch 110 level if broken then 102k then 97k
USDTBTC trade ideas

Could this be the end of Bitcoin’s trend?The Current State of Bitcoin’s Trend: Has the Uptrend Come to an End...?
Based on recent analyses, Bitcoin has exited its 4-hour channel over the past few days, and there is still a possibility for further correction. However, this does not mean that the uptrend for Bitcoin is over.
My targets for Bitcoin remain the same as before: 123,700 and 129,710. It’s even possible that we might see a wick above these prices.
For those with more capital who are looking to buy Bitcoin, there are two good entry levels:
110,880
109,770
Everything else is clearly shown on the chart. Please be cautious, as there will likely be high volatility once the market opens.
Be sure to open the analysis link and boost the analysis with your likes.

BTC/USDT Buy Setup – VSA & Demand Zone Reaction✅ Entry: Current price action near 117,297
🎯 Target: 119,078 (+1.22%)
🛑 Stop Loss (SL): 116,944 (below demand zone)
📊 Technical Insight (Volume Spread Analysis):
Stopping Volume at Lows:
The recent down move halted with a wide spread down-bar on high volume, followed by an immediate rejection. This indicates potential professional buying absorbing supply.
No Supply Confirmation:
After the stopping volume, several narrow spread candles on low volume formed, suggesting weak selling pressure and a lack of commitment from bears.
Bullish Reaction:
Price rebounded from the demand zone with increasing volume on up-bars, showing early signs of demand dominance.
The current consolidation just above the support is typical of absorption before a markup phase.
Risk-Reward Structure:
The setup offers a favorable 2.2:1 R:R ratio, with the stop placed just below the zone to avoid false breakouts while allowing the trade room to breathe.
📌 Trade Plan:
Bias remains bullish as long as price holds above 116,944.
A breakout above the minor resistance (117,828) with volume expansion would confirm the next leg up toward the 119,078 target.
If volume fails to support the move, reassess before committing additional capital.

BTCUSDT.PThe best area to buy MARKETSCOM:BITCOIN is $119,000 and wait for the pullback to be complete.
But for selling and shorting, be sure to wait for $115,000 to break down.
⚠️Please control risk managements.

Will BTC ever reach 130k?Yes in your dreams, I am joking, it can but not now, blue shows what fall can trigger when massive selloff happens, and here it looks the smaller momentum to happen soon!

BTCUSDT: A Bullish Foundation Meets Fibonacci FirepowerBTCUSDT: A Bullish Foundation Meets Fibonacci Firepower
BTCUSDT is currently at a critical juncture, navigating a significant upward trendline and a key Fibonacci retracement level. The chart highlights the ongoing battle between buyers and sellers following a strong multi-month rally. Price action is testing a major confluence zone, which will likely determine the immediate future direction of the market.
1. The Bullish Foundation (Late March - July):
• Long-Term Uptrend Line (White): A prominent upward-sloping trendline originating from the late March lows has defined the bullish narrative. Price has consistently found support on this line, demonstrating a strong underlying buying interest and a disciplined ascent. This trendline has been a reliable gauge of the market's health and a key area for bulls to defend.
• Fibonacci Retracement Levels: When we apply the Fibonacci retracement tool from the recent swing low to the all-time high, several potential support areas are identified. These levels are critical for understanding potential pullbacks and market structure.
2. The Current Inflection Point (Late July - August):
• Confluence Zone: The market is currently engaging with a high-stakes confluence zone. This area is defined by two key technical indicators:
o The Long-Term Uptrend Line: Price is testing this foundational support line for the first time since the July peak. A bounce from this level would reinforce the long-term bullish bias.
o The 0.236 Fibonacci Level (~$111,804): This is the first level of support in the Fibonacci sequence. The market is finding temporary footing here, and a decisive break below this level would be a bearish signal, suggesting a deeper retracement is likely.
3. Potential Scenarios:
• Bullish Continuation : The most optimistic scenario involves a successful defense of the current confluence zone. A strong bounce from the white uptrend line and the 0.236 Fibonacci level, backed by increased buying volume, would signal that the bulls are still in control. In this case, a re-test of the recent all-time highs would be the next logical target.
• Bearish Retracement : If the confluence zone fails to hold, and BTCUSDT breaks decisively below the trendline and the 0.236 Fibonacci level, it would suggest a deeper correction is underway. The next major support zone to monitor would be:
o The 0.382 Fibonacci Level (~$104,666) : This level has historically acted as both support and resistance, making it a critical psychological and technical area. A drop to this zone would likely be met with renewed buying interest.
o The 0.5 Fibonacci Level (~$98,897) : A move to this level would signal a more significant correction, potentially testing the psychological $100,000 mark.
Conclusion:
BTCUSDT is at a pivotal moment. The market's reaction to the current confluence of the long-term uptrend line and the 0.236 Fibonacci retracement level will dictate the short-to-medium-term direction. A bounce from here would confirm the strength of the uptrend, while a break lower would open the door for a deeper retracement toward the next key Fibonacci levels. Traders should closely monitor price action and volume at these critical levels for confirmation of the next directional move.
Disclaimer:
The information provided in this chart is for educational and informational purposes only and should not be considered as investment advice. Trading and investing involve substantial risk and are not suitable for every investor. You should carefully consider your financial situation and consult with a financial advisor before making any investment decisions. The creator of this chart does not guarantee any specific outcome or profit and is not responsible for any losses incurred as a result of using this information. Past performance is not indicative of future results. Use this information at your own risk. This chart has been created for my own improvement in Trading and Investment Analysis. Please do your own analysis before any investments.

BTC NEW LOOKBtcusd sell from 115,000
Target1 114,000
Target2 112,000
Target3 110,000
Stope Lose 116,500
TRADE AT YOUR OWN RISK

BTC190000 soonthis is way to btc going to 190000 soon or late after that i say btc should have very massive sell
but befor that we nead to btc go to up 190000

BTC | Swing Plan UpdatePrice failed to break out above 1D supply and sharply rejected, losing key 4H demand at $117,300.
HTF demand at $109,000 (1D FVG + BOS + S/R) is the next major area of interest—this is where I’ll look for fresh swing setups if the market flushes further.
No need to rush new positions until a clean setup prints or levels are reclaimed.
Plan:
Wait for price to test $109,000 zone before considering a swing long.
Only consider LTF scalp longs if we reclaim the 4H BOS at $118,300.
Stay flat until high-probability entry, let the market show its hand.

BTC bullish div.Bullish divergence on the 15m and 1H chart 📈
Liquidity grabbed 📈
Expecting a small move up = 1.6%
Long scalp trade if youre interested

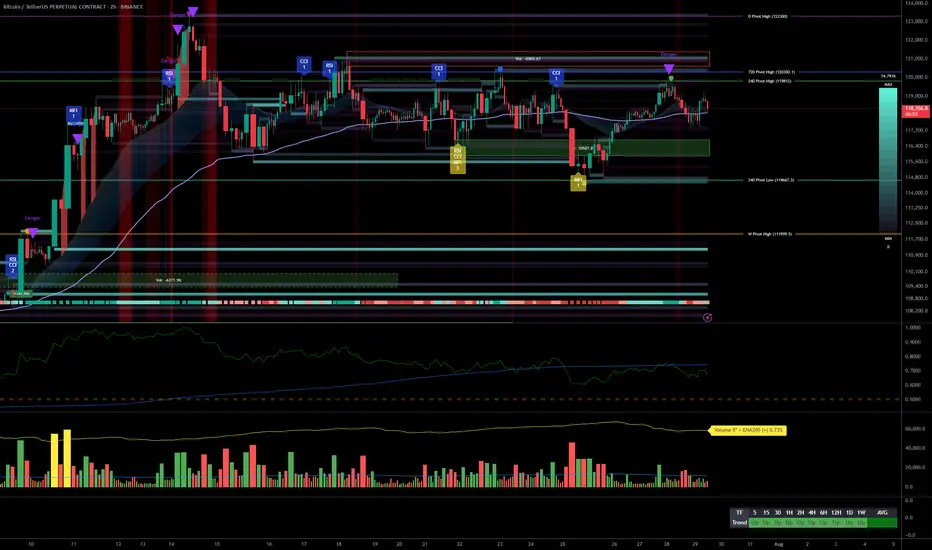
Multi-timeframe analysis, strong momentum, FOMC risk/reward plan__________________________________________________________________________________
Technical Overview – Summary Points
__________________________________________________________________________________
Strong momentum and bullish consensus confirmed across all timeframes.
Key support/resistance : 114k–116k (critical support), 123k (major pivot).
Healthy organic volume , no extreme peaks except isolated moments (30min/15min).
Risk On / Risk Off Indicator : Dominant bullish signal, neutral only on 15min.
Multi-timeframe structure : Perfect alignment daily/4H/2H/1H, caution on 15/30min (slight inflection but no abnormal divergence).
__________________________________________________________________________________
Strategic Summary
__________________________________________________________________________________
Global bias : Structural bull market, intact dynamic.
Opportunities : Tactical buys on pullbacks (114–116k), swing on breakout 123k.
Risk areas : Below 114k = risk of invalidation, targets 111k–105k.
Macro catalysts : FOMC imminent (high volatility expected), watch geopolitical tensions.
Action plan : Favor swing/cautious trading ahead of FOMC, dynamic stops, act on first post-Powell trigger.
__________________________________________________________________________________
Multi-Timeframe Analysis
__________________________________________________________________________________
1D : Active range 114k–123k; strong supports, momentum maintained; Risk On / Risk Off Indicator strongly bullish.
12H/6H/4H : Clean bullish structure, no excesses or divergence; price sits within major horizontal clusters.
2H/1H : Healthy impulse/correction phases; key intermediate supports 114.6k, 117.5k to watch.
30min/15min : Slightly weaker momentum but constructive microstructure, no immediate sell threat; localized volume spikes on support reactions.
ISPD DIV : No behavioral stress observed throughout.
Cross-timeframe summary : Bullish confluence dominant; caution on short-term reversals tied to FOMC and on-chain volatility spikes.
__________________________________________________________________________________
Multi-timeframe Cross Analysis & Decisional Rationale
__________________________________________________________________________________
As long as BTC > 114k = bullish bias, buying pullbacks, swing target 123k.
Active management post-FOMC strongly advised (enter/reduce after first H4 close).
Increased volatility risk in case of Fed/geopolitical shock; mandatory stops.
Sector momentum (Risk On / Risk Off Indicator) and volume underpin the bullish case unless exogenous alert.
Invalidation below 114k = prudent, neutral, or tactical shorts towards 111k–105k.
__________________________________________________________________________________
Macro, On-chain & Economic Calendar
__________________________________________________________________________________
FOMC July 29th : pivotal event, any surprise = strong intraday move (BTC sensitive to Powell speech).
US Macro: strong fundamentals but caution on trade war, inflation "contained."
On-chain : realized cap BTC >$1T, high open interest in derivatives = leveraged risk, beware speculative altcoin excess.
Global risk : market remains buyer until bearish Fed/geopolitical shock; swing trading favored, tight stops recommended.
__________________________________________________________________________________
Action plan
__________________________________________________________________________________
Favor buying/reloading on pullbacks to 114.6k–116k (stop <114k).
Break above 123k = bull confirmation, further extension likely to 126–128k depending on FOMC outcome.
Prioritize strict risk management; monitor liquidity/supports on macro/on-chain volatility peaks.
__________________________________________________________________________________
BUY BTC 4.8.2025Confluence order: BUY at H1~M15
Type of order: Limit order
Reason:
- The current top is not touching anything, expected to rise to the H1 above.
- M15~FIBO 0,5-0,618 (same position)
Note:
- Management of money carefully at the last bottom (114,119)
Set up entry:
- Entry buy at 113,707
- SL at 113,311
- TP1: 114,119 (~1R)
- TP2: 114,906 (~3R)
- TP3: 115,963 (~5R)
Trading Method: Price action (No indicator, only trend and candles)
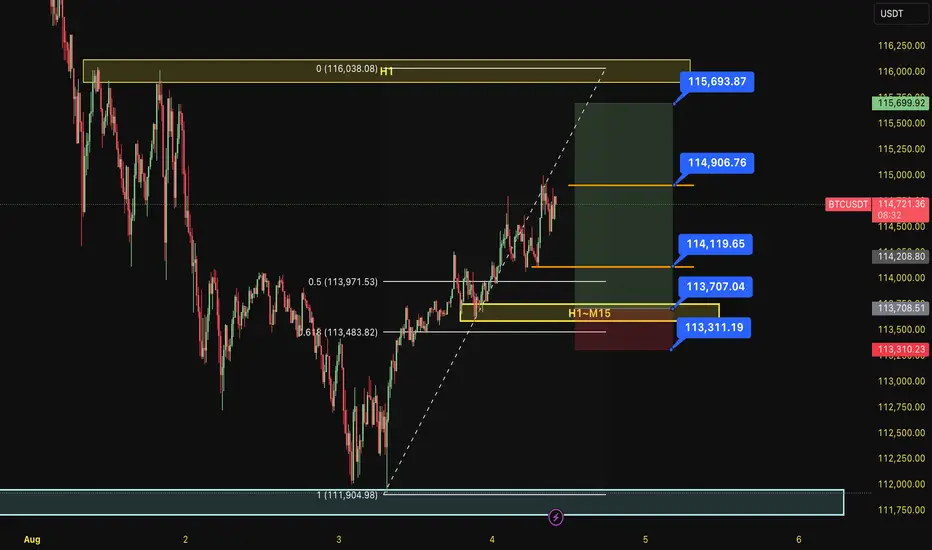
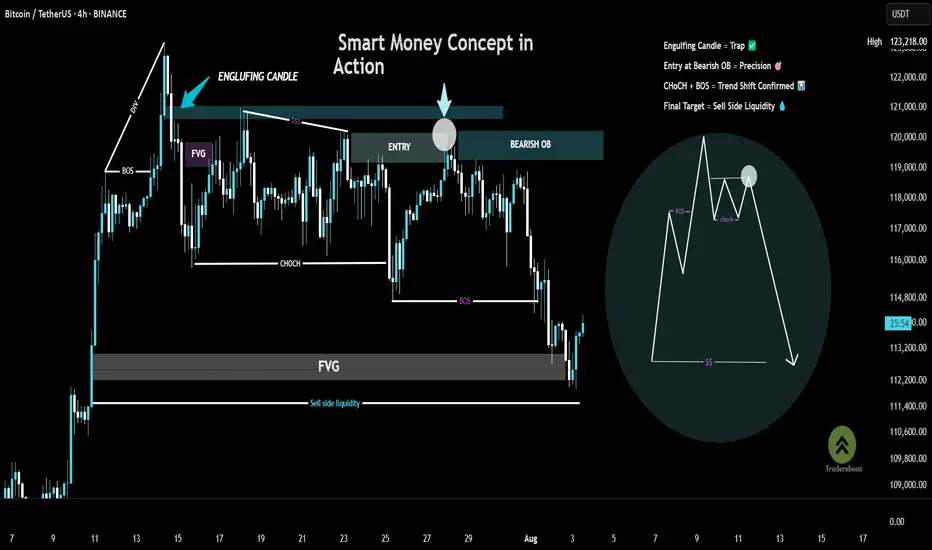
Chart Breakdown – Smart Money Concept in ActionThis chart showcases a textbook example of a bearish setup based on Smart Money Concepts (SMC):
BOS (Break of Structure) at the left confirms a shift in momentum.
A strong engulfing candle pierces into a supply zone, setting the stage for a potential reversal.
Price forms an FVG (Fair Value Gap) and returns to fill the imbalance, offering a high-probability entry within the Bearish Order Block (OB).
A clear CHoCH (Change of Character) signals a bearish trend shift, validated by the second BOS.
The trade targets Sell Side Liquidity, resting below the recent lows—just where smart money aims.
🎯 This setup combines precision, patience, and the power of understanding institutional moves.
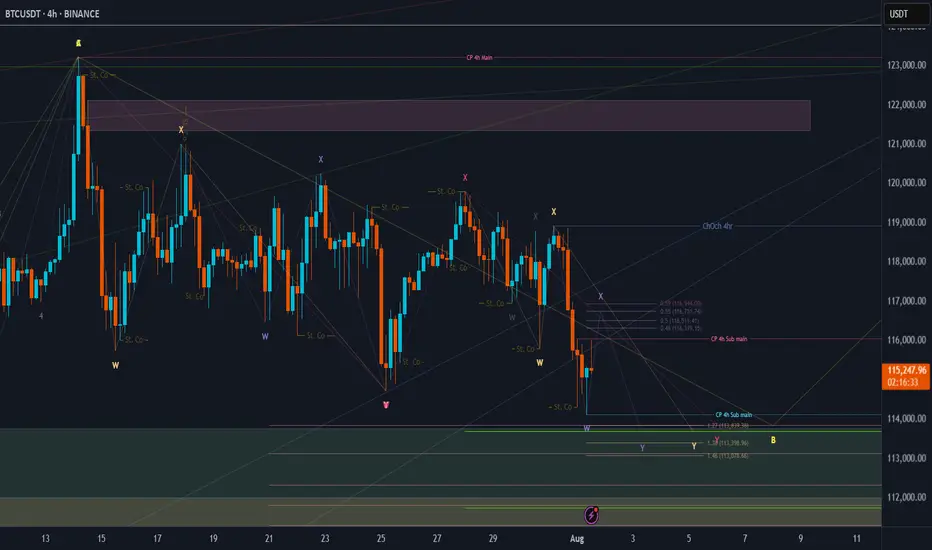
BTC Price Prediction and Elliott Wave AnalysisHello friends,
>> Thank you for joining me in my analysis. We have finished the pink X wave directly, then we have gone to the final pink Y wave, which consists of wxy in orange counting. Now we are moving into the final Orange Y wave.
>> our confirmations:
* 4Hr TF: Breaking 118990 for the next hours, we will end the whole Yellow B "correction" wave successfully. .
Keep liking and supporting me to continue. See you soon!
Thanks, Bros

Bitcoin long from 114kWaiting for that npoc level to hit.
After that there is a 4h low , manipulate it , and we will try to catch a reversal.

BTC: Calm before the storm on market, or where we go?Sometimes the market is straightforward: there’s momentum, a trend, a clear direction. But other times—like now—there’s complete uncertainty. Over the past few days, Bitcoin has been trading in a tight range, lacking any pronounced momentum. The price moves back and forth, bouncing off local levels but not breaking out in any meaningful way.
📉 This is especially clear on the 4-hour chart: neither bulls nor bears can take control. Every move upward is quickly met with selling pressure, and attempts to drop are countered by buying. It’s like a “ping-pong” match in a sideways market.
📊 Indicators show low volatility and declining volumes, confirming that market participants are simply waiting. Likely, they’re anticipating an external trigger: news, macroeconomic events, interest rate decisions, ETF developments, or something else.
What could this mean?
Such conditions often precede a strong move. The question is—where to? Honestly, there’s no clear signal yet. Personally, I try not to rush in moments like these: if the market isn’t giving a clear direction, it’s better to take a pause.
That’s the essence of a professional approach: don’t trade just for the sake of trading, but wait until the market speaks more confidently.
What can you do now?
– Watch the range boundaries and wait for a breakout or trade bounces.
– Avoid entering positions based on emotions—pullbacks can be sharp and unexpected.
– Reduce trade sizes if you do enter, and set tight stops.
– Keep an eye on the news—sometimes even neutral news can spark a move.
Sometimes the best decision is to do nothing. This might be one of those times. In a sideways market, you’re more likely to lose than gain. But clarity almost always follows a consolidation.

BTCUSD NEW OUTLOOKBtcusd buy from 117,500
Target1 118,500
Target2 119,500
Target3 120,500
Stope Lose 116,500
TRADE AT YOUR OWN RISK

BTC/USD.tBtc is in a tight range at the moment. We are good as long as we don't close a daily below $116k. We will have a longer consolidation if we do close below. Lets see...

Shark harmonic pattern
---
### 🦈 What Is the Shark Harmonic Pattern?
- **Discovered by**: Scott Carney in 2011
- **Foundation**: Combines **Fibonacci ratios** with **Elliott Wave Theory**
- **Purpose**: Identifies potential **trend reversals** using precise geometric price structures
- **Structure**: Five points labeled **O, X, A, B, C** (not the usual XABCD)
- **Key Feature**: Relies heavily on the **88.6% Fibonacci retracement** and **113% extension**
---
### 📐 Pattern Geometry & Ratios
| Leg | Description | Fibonacci Ratio Range |
|------------|--------------------------------------------------|-------------------------------|
| XA | Initial impulse leg | No specific ratio |
| AB | Extension beyond X | 113% to 161.8% of XA |
| BC | Completion leg | 88.6% to 113% of OX |
| | | 161.8% to 224% of AB |
- **Point B** must **exceed point X**, forming an **Extreme Harmonic Impulse Wave**
- **Point C** is the **Potential Reversal Zone (PRZ)**
---
### 🛒 Buy Setup (Bullish Shark)
1. **No fixed retracement for A**
2. **B extends 113%–161.8% of XA**
3. **C completes at**:
- 88.6%–113% of OX
- 161.8%–224% of AB
📍 **Entry**: Near point C
📍 **Stop Loss**: Below point C
📍 **Target**: Retracement levels of BC (e.g., 50%, 61.8%), or back to point A/B
---
### 📉 Sell Setup (Bearish Shark)
1. **No fixed retracement for A**
2. **B extends 113%–161.8% of XA**
3. **C completes at**:
- 88.6%–113% of OX
- 161.8%–224% of AB
📍 **Entry**: Near point C
📍 **Stop Loss**: Above point C
📍 **Target**: Retracement levels of BC, or back to point A/B
---
### 📊 Real Trade Example & Educational Resources
In the comment

Shark harmonic pattern Absolutely, Amedeo! Here's a detailed and visually engaging breakdown of the **Shark Harmonic Pattern**, including its structure, trading styles, and how it connects Fibonacci ratios with Elliott Wave Theory:
---
### 🦈 What Is the Shark Harmonic Pattern?
- **Discovered by**: Scott Carney in 2011
- **Foundation**: Combines **Fibonacci ratios** with **Elliott Wave Theory**
- **Purpose**: Identifies potential **trend reversals** using precise geometric price structures
- **Structure**: Five points labeled **O, X, A, B, C** (not the usual XABCD)
- **Key Feature**: Relies heavily on the **88.6% Fibonacci retracement** and **113% extension**
---
### 📐 Pattern Geometry & Ratios
| Leg | Description | Fibonacci Ratio Range |
|------------|--------------------------------------------------|-------------------------------|
| XA | Initial impulse leg | No specific ratio |
| AB | Extension beyond X | 113% to 161.8% of XA |
| BC | Completion leg | 88.6% to 113% of OX |
| | | 161.8% to 224% of AB |
- **Point B** must **exceed point X**, forming an **Extreme Harmonic Impulse Wave**
- **Point C** is the **Potential Reversal Zone (PRZ)**
---
### 🛒 Buy Setup (Bullish Shark)
1. **No fixed retracement for A**
2. **B extends 113%–161.8% of XA**
3. **C completes at**:
- 88.6%–113% of OX
- 161.8%–224% of AB
📍 **Entry**: Near point C
📍 **Stop Loss**: Below point C
📍 **Target**: Retracement levels of BC (e.g., 50%, 61.8%), or back to point A/B
---
### 📉 Sell Setup (Bearish Shark)
1. **No fixed retracement for A**
2. **B extends 113%–161.8% of XA**
3. **C completes at**:
- 88.6%–113% of OX
- 161.8%–224% of AB
📍 **Entry**: Near point C
📍 **Stop Loss**: Above point C
📍 **Target**: Retracement levels of BC, or back to point A/B
---
### 📊 Real Trade Example & Educational Resources are in the comment

BTC-Stay Sharp. Self RegulateBTC Update
👀All Eyes on These Levels 👇
We’re back in A zone.
The level? 115,727.
This isn’t just any line on the chart — this is the same trendline that flipped from major resistance to support back to resistance on the same date of the infamous #bUCKmOON pump.
📈 If BTC breaks this level with strength and volume — I’m in long.🟢
No volume? No conviction. No entry.
But let’s not get carried away — resistance lurks right above at 117,000 — the former Exhaustion Zone Support now turned resistance.
A classic case of "what once held you up now wants to drag you down."
And if the bulls somehow clear that hurdle?
They'll run headfirst into the Exhaustion Zone Resistance — the real boss fight.
These are stacked walls — one after the other. No easy wins here.
🧠 As a chartist, I’m not here to write about what happens if we break through every ceiling like it’s some fanboy fantasy. That’s not analysis — that’s hopium.
🥂 Yeah yeah but— it’s fun to daydream about all the champagne showers, yacht parties, laser eyes, and the sudden urge to start a DAO that changes the world.
We all picture it.
We all love it.
And sure, when BTC rips through all resistance like butter, we’ll act like we "knew all along."
But anyways — snap back to reality...
There’s another level we can’t ignore:
112,388
👀 Even a 4-hour close below this level?
Just check the chart.
That’s when the bears come storming out of hibernation — angry, hungry, and ready to feast.
🎯Bottom line:
Stay sharp. Self Regulate.
The chart is the map. Discipline is the treasure.

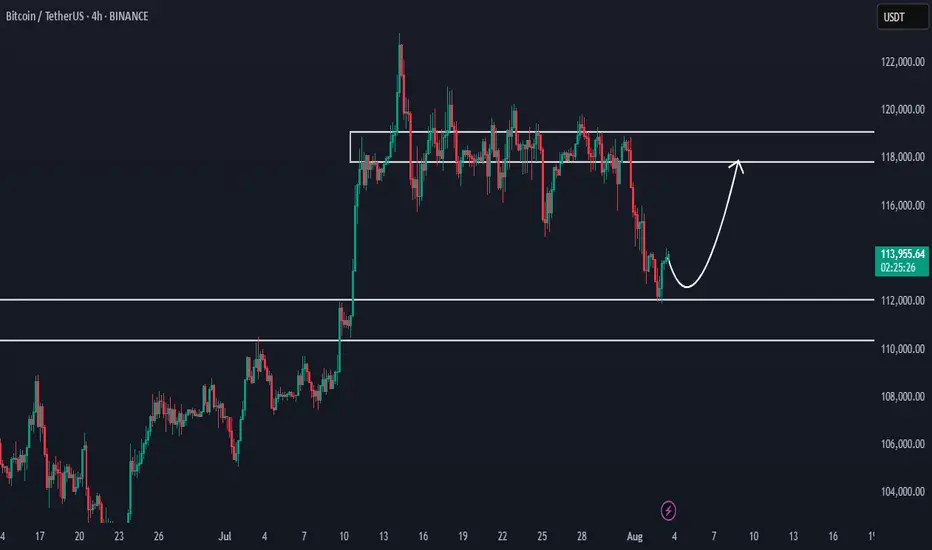
Bitcoin at Key Support - Watching for Bullish ShiftHello everybody!
Bitcoin has reached a very important demand/support zone between 110,000–112,000.
If this area holds, we could see bullish momentum building on the chart.
Currently, we are waiting for confirmations.
We're watching closely for any change in market structure or a trend shift.
If it happens, we can expect the price to move up to around 118,000.
Manage your risk and trade safe!