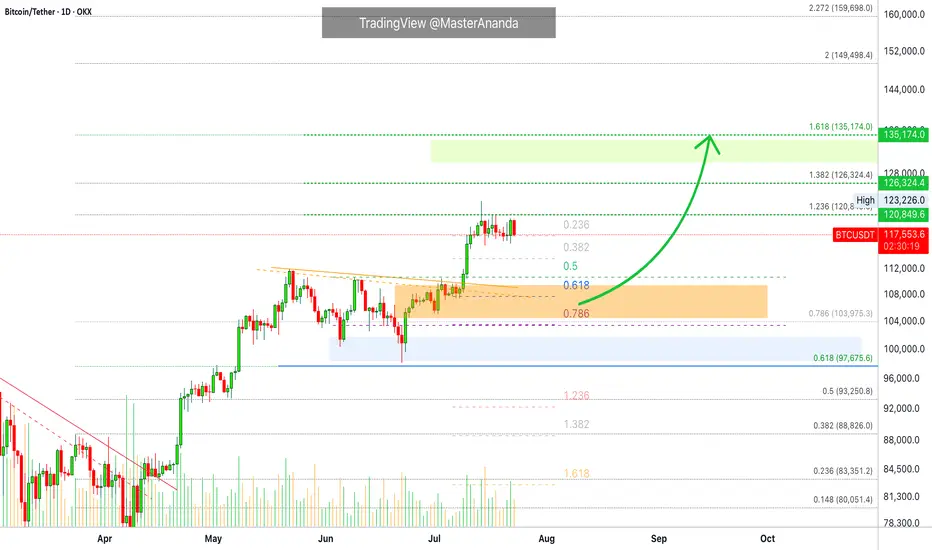
2 Scenarios for BTCNow that the cup and handle formation has been reached and the correction finished, I think we have 1 more leg up.
It's also possible that we fall from here, but I think another fakeout upwards is likely as bearish divergence forms on the month, but isn't quite there yet (RSI needs 1 more higher high to confirm bearish divergence)
Either way, my short targets are the 0.618 fibs. I am expecting the typical -70-75% crash by 2027 before the next cycle begins
USDTBTC trade ideas


Bitcoin Go 135000Bitcoin has not yet reached the channel ceiling and should bounce back after the resistance.

BTC, ETH & Indexes daily analyze 🚀🔥 BTC, ETH & Indexes daily🔥🚀
💎 Daily Market Routine, Structure-Based Crypto Analysis & Watchlist Insights
💥 Like – Follow – Comment to keep this momentum alive!
👋 Hey everyone! Welcome to our daily crypto trading routine:
📅 Daily:
🔹 BTC & ETH analysis
🔹 Full market structure review (TOTAL, BTC.D, USDT.D…)
📅 Weekly (Every Sunday):
🔸 Top 10 Altcoins Analysis (excluding BTC & ETH)
🔸 🆕 Coming soon: Weekly Watchlist Picks!
💛 Your likes, follows, and comments give me the motivation to continue this journey and share deeper insights!
🟡 Methodology
💠 Long-Term Cycle (HWC): 1D timeframe
💠 Mid-Term Cycle (MWC): 4H timeframe
💠 Short-Term Cycle (LWC): 1H timeframe
💠 Market structure review:
TOTAL / TOTAL2 / TOTAL3 / BTC.D / USDT.D
💠 Technical approach: Dow Theory
💠 Fundamental events + news tracking
🔥 Today Could Be the Most Important Day of the Week!
📢 The Fed’s interest rate decision is expected today. Market consensus leans toward no change, but Powell’s press conference could trigger major volatility.
📈 If BTC starts a bullish trend in the coming days, ETH, BNB, and AVAX are likely to outperform – and this probability is high.
♦️ BTC/USDT – Market Still Ranging
💎 Bulls have failed to break above 120,000, but bears also haven't broken below the critical 115,000 zone.
📊 This two-week range is not surprising – it's likely a time correction, consolidation, or even distribution phase.
🚀 If 120K breaks with strong momentum and volume, price may rally to 123K → 135K → 150K.
❗ If 115K breaks, expect a drop to 110K → 100K.
⭕ Breakouts need strong candles and volume – otherwise expect fakeouts.
🟡 My strategy doesn't allow shorts at this phase. I only seek bullish confirmation – though bearish signs like buying exhaustion and profit-taking near 118K exist.
📌 I’ll re-enter long on breakout above 120K, using buy stops and proper risk control. Even if it hits my stop-loss later, I’m okay with that.
🔥 BTC must break 120K to unlock full altcoin rally potential.
♦️ BTC.D – Decision Time Nears
📉 Recent downtrend shows weakness, but not a bullish reversal yet.
🔸 Watch levels:
• 🟢 Break below 60.42 → Confirmed altcoin rally
• 🔴 Break above 62.17 → Likely altcoin crash
♦️ USDT.D – Position Before the Break!
🟡 We must take altcoin & BTC positions before USDT.D breaks 4.13.
⏳ A break there likely triggers a sharp upward move in alts.
• 🔹 Pullback to 4.64 = still bullish for alts
• 🔹 Current key zones:
• 4.44: Not tested yet
• 4.13: Likely to be retested
♦️ TOTAL Market Cap
💎 Break above 3.91T → Bullish confirmation – be in the market!
♦️ TOTAL2 (Altcoin Market Cap)
🟡 Major resistance ahead: 1.54T
♦️ TOTAL3 (Altcoin Market w/o BTC & ETH)
🟡 Important level: 1.08T
♦️ ETH/USDT – Institutions Are Accumulating!
💼 Institutional buying continues – a strong bullish signal.
💎 Buyers are trying to flip 3750 into support. Heavy order blocks detected.
📌 Key Level: 3900
• 🔹 Break & hold above = Easy ride toward 4000+
• 🔻 Bearish view: Break below 3750 = Drop to 3500–3600
🟡 Recent demand spike and fresh capital inflow = bullish sentiment
♦️ Strategic Outlook
1️⃣ Still focused on long setups
2️⃣ If BTC breaks 120K and ETH breaks 4K then ranges → and BTC.D drops = 🎉 Altcoin Party!
3️⃣ If BTC fails to break 120.3K, we won’t get a strong rally
4️⃣ If BTC keeps ranging and BTC.D keeps dropping → alts will gain, but not full bull run yet
💬 Drop your thoughts in the comments below!
🚀 Smash that ROCKET, hit LIKE, and don’t forget to FOLLOW for daily setups!

Btc is fallingHello, considering the breakdown of the upward trend line and the pullback to the downward trend line that I drew, the price will most likely fall to the specified support level and we will enter a resistance phase.

Bitcoin & Altcoins: Technical Analysis and Market OutlookBitcoin (BTC) Analysis
Bitcoin is currently forming a short-term bullish pennant within a larger long-term pattern, projecting a potential target around $135K.
Key Levels: BTC is consolidating between the lower zone at $117.3K and the upper zone at $119.7K.
Breakout Potential: A break above this pattern could propel BTC toward a new all-time high (ATH), surpassing the current ATH at $123K.
Macro Events This Week:
Wednesday: The Federal Reserve will announce its interest rate decision, with no changes expected.
Wednesday: ADP Employment Report, providing insights into potential future rate cuts.
Friday: Non-Farm Payrolls (NFP) data release, which could further influence market sentiment.
Ethereum (ETH) Breakout
Ethereum has decisively broken through its 4-year historical resistance around $3,725, closing the week above this level. This breakout signals a strong bullish outlook for ETH, with potential for further upside.
Altcoin Highlights
BNB: Has shattered its previous all-time highs, showcasing significant bullish momentum.
XRP: Reached approximately $3.64, reflecting strong gains and market interest.
Market Context
The crypto market is showing robust activity, with altcoins following Bitcoin and Ethereum's lead. Key macroeconomic events this week could introduce volatility, so traders should stay vigilant.
Disclaimer: This is not financial advice. Every trader is responsible for their own strategy and risk management.
Happy trading and good profits! 🚀

Pessimistic scenario for BITCOINAfter Bitcoin touched the price of 123,218, it entered a corrective phase. According to previous analysis, we expected the price to touch the range of $115,000-113,000. With the formation of more waves, it seems that the recent correction that started on July 14, 2025 is a diametric (bowtie) where waves f and g of this diametric are not yet complete and this pattern is part of a higher degree diametric and after this pattern is completed I expect a move towards the range of 140,000-150,000
Pessimistic scenario:
The pessimistic scenario is that this wave becomes a double pattern and enters the price range of wave-b (marked with a red dashed line) of the higher degree diametric. The probability of this scenario occurring is low and I consider the first scenario more likely, but we must be prepared for all market movements.
Good luck
NEoWave Chart

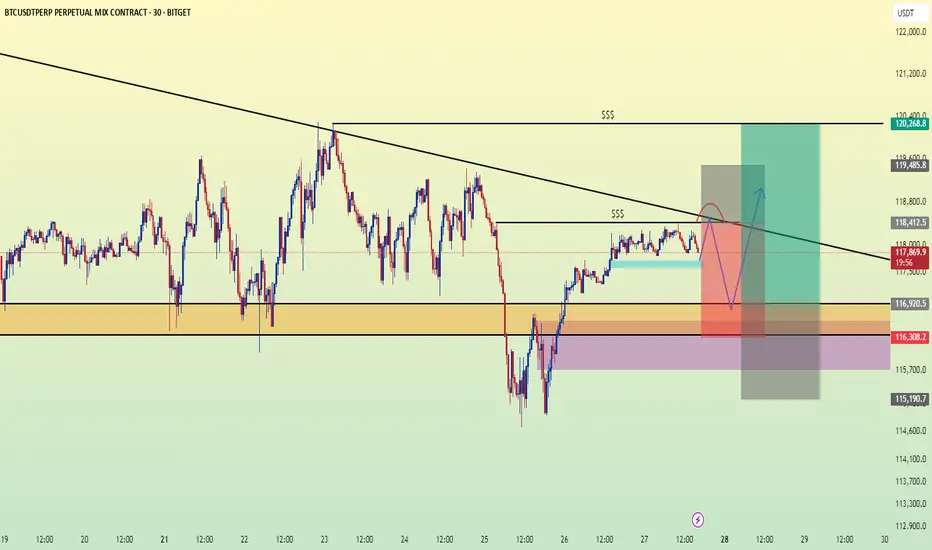
BTCUSDT Range-Bound Market: Short-Term Bearish MoveBTCUSDT
has failed to break through the descending resistance near 120,000 and is now forming a lower high within the broader resistance zone. The price action follows an impulsive leg up and is currently tracing a potential reversal pattern under key structural resistance. As long as the market remains capped below 120,000, continuation toward 117,500 is likely. The downward bias is supported by weakening momentum after the bull trap and resistance rejection.
📉 Key Levels
Sell trigger: Breakdown below 119,000
Sell zone: 119,400 – 120,000
Target: 117,500
Invalidation: Break and close above 120,500

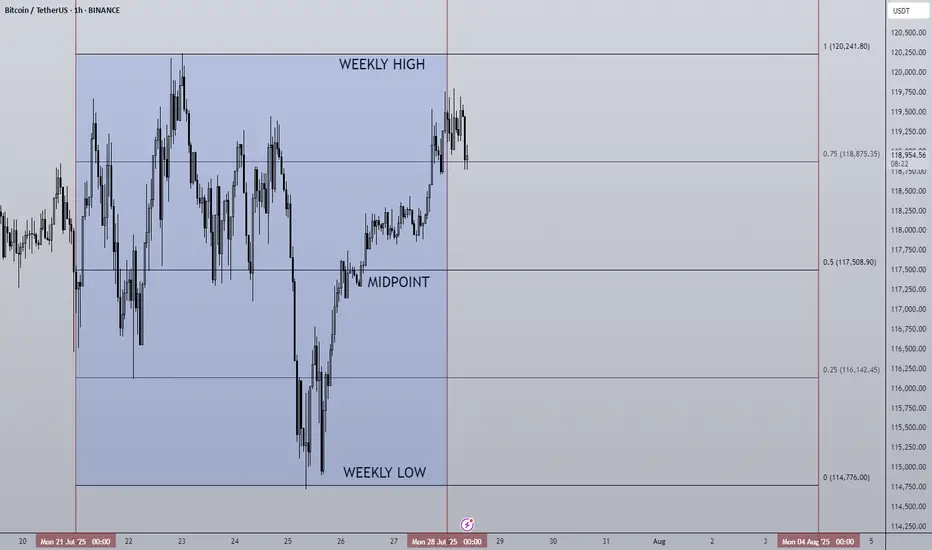
28/07/25 Weekly OutlookLast weeks high: $120,241.80
Last weeks low: $114,776.00
Midpoint: $117,508.90
As we approach the end of the month BTC continues to trade sideways during a cooling off period as altcoins finally take the stage. Last week Bitcoin saw a relatively flat net inflow via ETFs of $72m, ETH on the other hand posted the second largest net inflow week ever at $1.85B! The concentration has certainly shifted...
This IMO is still a very bullish structure for BTC, very shallow pullbacks being bought up/absorbed by still happy to purchase at these levels. As long as this continues altcoins have a strong base to continue growing on, if BTC breaks structure and price accepts below ~$110,000 then the altcoin rally will be over for now I believe.
This week some major altcoins are set to reach HTF resistance areas, ETH has already tagged $4,000 which looks to be a battleground level of major importance.
TOTAL2 which is the combined market cap of all altcoins is currently ~8% from the highs, keeping this in mind for where altcoins may run out of steam...
Good luck this week everybody!
Daily Market Analysis – BTC, ETH, and Key Indexes
💎🔥 Daily Market Analysis – BTC, ETH, and Key Indexes 🔥💎
🚀 Don’t forget to FOLLOW & smash the ROCKET 🚀 button if this helped you!
💬 Drop your thoughts in the comments
♦️ Hello everyone!
On this page, we follow a daily and weekly crypto routine:
🟡 Daily:
• Structural and technical analysis of BTC, ETH, and overall market indexes.
🟡 Every Sunday:
• Analysis of the Top 10 Altcoins (excluding BTC & ETH)
• 🆕 Weekly Watchlist to be introduced soon!
💛Your likes and follows are my fuel to keep posting daily insights 💛
⭕️ We’re currently in a super critical zone across all markets:
• BTC, ETH, major Altcoins
• Key indexes like BTC Dominance (BTC.D), USDT Dominance (USDT.D), TOTAL, TOTAL2, and TOTAL3
All are at major turning points.
❗️Also, this week brings critical macro news:
• U.S. Interest Rate decision – expected to remain unchanged,
but political pressure may push Powell to surprise the markets.
• Reports on U.S. GDP, Japanese Yen interest rate, and Canadian Dollar are also coming.
⚠️ This is a HIGH-IMPACT WEEK – stay alert. We might even be at the edge of a bull run.
♦️ BTC
As mentioned yesterday, to confirm long positions on altcoins and restart their rally,
we need a breakout above 120,300 on BTC and a drop in BTC.D.
✅ Break of 120,300 would inject strong bullish sentiment and possibly trigger high momentum.
🚫 Until then, my focus is strictly on bullish setups only.
📌 If BTC ranges before the U.S. session opens, the entry triggers shared in yesterday's watchlist will be ideal to activate.
♦️ BTC Dominance (BTC.D)
While BTC price rises, BTC.D is dropping – a great signal for altcoin entries.
BTC.D is testing two key levels:
1️⃣ 60.83
2️⃣ 60.42
📉 A full breakdown of 60.83 would be the first signal of an altcoin reversal.
❗️If 60.42 breaks too – do NOT stay out of altcoins!
♦️ TOTAL (Market Cap)
Currently struggling with the 3.91T level.
A clean break here could bring in serious volume and momentum.
💡 Missed some entries from the watchlist? Look for major breakout levels on other coins.
♦️ TOTAL2 (Altcoin Cap excl. BTC)
Also testing its key level of 1.48T. Breakout = confirmation of altcoin strength.
♦️ TOTAL3 (Altcoin Cap excl. BTC & ETH)
Yesterday, gave us its first bullish signal breaking above 1.03T.
Because ETH has moved already, TOTAL2 reacted faster.
⏳ That means: we still have time for altcoin setups (excluding BTC & ETH).
♦️ USDT Dominance (USDT.D)
Broke 4.23% – which was the first early sign of a bullish shift.
Before it breaks 4.13%, we should already be in long positions on BTC and alts.
⚠️ Once 4.13% breaks, sharp altcoin rallies may happen quickly – entry opportunities may disappear.
♦️ ETH/USDT
Although ETH has bullish candles, volume and trend strength are weak.
My preferred entry was around $3,750 – that would give us room toward the $4,000 resistance.
Right now, no valid entry trigger in ETH.
If it reacts to $4,000 and forms a lower low, then we might scout for bullish setups.
⛔️ $4,000 is likely to cause some chop – which is why $3,750 was a better buy zone.
♦️ Outlook & Strategy ♦️
1️⃣ Consider the chance that all coins may bounce exactly from current levels – that's what I’m personally positioning for, accepting the risk.
2️⃣ If BTC and ETH break 120K and 4K then consolidate, and BTC.D continues to drop —
➡️ Get ready for an Altcoin Party.
3️⃣ Monitor the daily watchlist triggers closely.
4️⃣ If BTC fails to break 120.3K, we won’t get the explosive rally.
5️⃣ If BTC ranges while BTC.D continues dropping, alts will still perform —
⚠️ But not as strong as a full bull run.
🚀 Hit the ROCKET if this helped you stay ahead of the market!
🟡 Follow me for daily BTC, ETH & index updates.
💬 Let me know your market view in the comments!

BTC AI Prediction Dashboard - 6h Price Path (28.07.25)
Prediction made using Crypticorn AI Prediction Dashboard
Link in bio
BTCUSDT Forecast:
Crypticorn AI Prediction Dashboard Projects 6h Price Path (Forward-Only)
Forecast timestamp: ~07:30 UTC
Timeframe: 15m
Prediction horizon: 6 hours
Model output:
Central estimate (blue line): -119,580
Represents the AI’s best estimate of BTC’s near-term price direction.
80% confidence band (light blue): 119,215 – 119,825
The light blue zone marks the 80% confidence range — the most likely area for price to close
40% confidence band (dark blue): 118,653 – 120,531
The dark blue zone shows the narrower 40% confidence range, where price is expected to stay with higher concentration
Volume on signal bar: 255.22
This chart shows a short-term Bitcoin price forecast using AI-generated confidence zones.
Candlesticks reflect actual BTC/USDT price action in 15-minute intervals.
This helps visualize expected volatility and potential price zones in the short term.

Double Bullish Flag on Bitcoin — Next Rally to $135K?📊 BTCUSDT (12H) In-Depth Analysis: Major Momentum Brewing
Bitcoin (BTC) is currently exhibiting a very promising technical structure — a Double Bullish Flag, a rare yet powerful continuation formation that often precedes strong upside momentum.
This dual-pattern structure reflects market strength and smart accumulation, with bulls maintaining control while allowing for healthy pauses before potential expansion to higher levels.
---
🔍 Technical Breakdown: Double Bullish Flag Structure
🔸 1. Primary Bullish Flag:
Formed after a sharp rally from around $95,000 to $113,000 (flagpole).
Price then consolidated within a clear descending channel, forming a classic Bullish Flag pattern.
Breakout from this pattern occurred in early July, confirming bullish continuation.
🔸 2. Secondary Bullish Flag (Mini Flag):
After the breakout from the main flag, BTC formed a second smaller flag pattern — a narrow descending channel from ~$123K to ~$119K.
This is known as bullish flag stacking — a pattern of "flag on top of flag", signaling trend strength and smart consolidation.
This mini-flag now acts as a launchpad for the next potential breakout.
---
🚀 Bullish Scenario: Preparing for a Breakout
If BTC breaks above the upper resistance of the mini flag (~$123,200), it will signal a fresh bullish continuation.
🎯 Potential Upside Targets:
Conservative target: $126,000 – $128,000
Full measured move target (from flagpole): $132,000 – $135,000
✅ Confirmation criteria:
Strong candle close above $123.2K
Accompanied by rising volume and upward RSI momentum (but not overbought)
---
🧨 Bearish Scenario: Breakdown and Retest
If BTC fails to break above the flag and instead drops below the flag support (~$119,400), we may see a short-term correction.
🔻 Key Support Levels:
$117,000 – minor horizontal support
$113,000 – $115,000 – strong demand zone and previous breakout area
⚠️ As long as price holds above $113K, the broader bullish trend remains intact. A pullback to this zone could offer a prime retest-buying opportunity.
---
📌 Key Price Levels to Watch:
Level Role
$123,200 Mini-flag resistance (breakout trigger)
$121,600 Mid-range resistance
$119,400 Flag support
$117,000 Horizontal retest zone
$113,000 Major support (trend invalidation if lost)
$132K – $135K Projected breakout target
---
💡 Conclusion: BTC in Critical Zone Before Potential Expansion
This Double Bullish Flag formation is one of the most technically constructive setups BTC has shown in weeks. It reflects a strong, patient market — with bulls preparing for another leg higher.
If the breakout from the second flag confirms, Bitcoin could rally toward $135,000, backed by momentum, volume, and clean structure. However, a breakdown would only signal a short-term cooldown unless support at $113K is lost.
🧭 Stay focused on breakout confirmation, volume spikes, and market sentiment. This could be the calm before a bullish storm.
#BTCUSDT #BitcoinBreakout #BullishFlag #TechnicalAnalysis #DoubleBullFlag #BTCMomentum #BitcoinRally #CryptoOutlook #BitcoinTo135K

"Bitcoin’s Big Heist – Are You In or Out?"🚨 BTC/USDT HEIST MISSION – SWIPE THE BULL RUN BEFORE THE BEARS WAKE UP 💰💣
🌟Hi! Hola! Ola! Bonjour! Hallo! Marhaba!🌟
Money Makers & Robbers, assemble! 🤑💰✈️💸
Here’s your decoded BTC/USDT “Bitcoin vs Tether” Crypto Market Heist Plan, fully loaded with Thief Trading Style 🔥 TA + FA combo. We’re prepping for a bullish breakout loot – eyes on the vault, ignore the noise.
🎯 PLAN OF ATTACK:
🎯 ENTRY (BUY ZONE):
💥 “The vault’s open—time to sweep!”
DCA/Layer your buy limit orders near the 15–30 min swing lows/highs for sniper pullback entries.
Use multi-entry method to stack positions (layering / DCA) as per your ammo (capital 💵).
🛑 STOP LOSS:
Set SL at the nearest swing low wick (4H TF) — around 115000.00, adjust based on your risk/load.
SL = insurance. Not optional.
🏁 TARGET:
Lock sights on 125000.00
🎉 Or… vanish with profits before the bear cops arrive.
🔎 MARKET BACKDROP & ANALYSIS:
📈 BTC/USDT currently signals bullish vibes on the swing/day horizon — fueled by:
Macro Fuel & Fundamentals
Sentiment Radar
COT Reports
On-Chain Pulse
Intermarket Clues
🚀 Connect the dots. The smart money's already prepping a breakout move.
🧲 Scalpers Note:
Stick to the long side only. No shorting the beast — unless you’re made of diamonds.
Secure your bag with trailing SLs.
⚠️ NEWS TRIGGER ZONE – TRADE WITH TACT:
📢 Upcoming high-volatility news events can spike charts.
Avoid new entries during releases and guard open trades with trailing SLs.
Protect the loot. Always.
💖 SUPPORT THE HEIST GANG: BOOST IT!
Smash that ❤️ to boost our thief squad’s momentum!
Every click powers this underground mission – making money with style, one pip at a time. 🎯💣💵
🚀 See you in the next heist drop.
Until then – Stay stealthy. Stay profitable. Stay legendary. 🐱👤💸🏆

BTC short and long setupBoth may happen. i want Bitcoin grab liquidity first and then fall tell next liquidity.

Bitcoin ready to correct to 92,000A treasure channel that, after a little suffering and fear, cascades down.
Tp:92000

TradeCityPro | Bitcoin Daily Analysis #136👋 Welcome to TradeCity Pro!
Let’s get into the analysis of Bitcoin and major crypto indices. As usual in this analysis, I’m going to review the futures triggers for the New York session.
⏳ 1-Hour Timeframe
On the 1-hour timeframe, price is still ranging inside the box, and none of its triggers were activated yesterday.
✔️ The support floor is at 117,342, and another key support zone is around 116,000.
✨ If these zones break, Bitcoin may begin a deep correction. In that case, we can open short positions or close long-term long positions that we’re already holding.
⭐ For long positions, we still have the 119,395 and 120,594 triggers. A breakout of either zone could provide a very good entry point for the next bullish leg of Bitcoin.
👑 BTC.D Analysis
Let’s move on to Bitcoin Dominance. Yesterday, dominance stabilized above the 61.20 zone, and as I mentioned before, breaking this zone led to a bullish leg, which continued up to 62.41, and currently, it has more bullish momentum.
💥 If 62.41 breaks, the bullish momentum will intensify. However, I still believe the overall trend is bearish, and if 60.46 breaks to the downside, the decline could continue.
📅 Total2 Analysis
Let’s go over Total2. This index has continued to correct and has now dropped to the 1.41 zone, which corresponds to the 0.5 Fibonacci level. It has now created a trigger around 1.47.
⚡️ If 1.47 breaks, we can open a long position. Our next trigger will be 1.53.
A breakout of 1.53 would signal the start of the next bullish wave.
📅 USDT.D Analysis
Now to Tether Dominance. This index has finally exited its range box and has broken the 4.25 level.
The current resistance stopping price is 4.36.
🔔 If dominance drops back below 4.25, strong bearish momentum could hit, increasing the likelihood of a breakdown of 4.13.
❌ Disclaimer ❌
Trading futures is highly risky and dangerous. If you're not an expert, these triggers may not be suitable for you. You should first learn risk and capital management. You can also use the educational content from this channel.
Finally, these triggers reflect my personal opinions on price action, and the market may move completely against this analysis. So, do your own research before opening any position.

BTC - Prediction for the Final TOP AND the next BOTTOMAfter several analyses that I published on Trading View, I want to share my opinion on the Final Top and the next Bottom for Bitcoin!
The final Top will be between 160,000 and 174,000.
The next Bottom will be between 31,000 and 40,000. (Simply under 40,000).
This is not guaranteed, and it's just an analysis; it can happen or not, so be careful.
5 Lessons from My First 100 TradesAfter executing and reviewing over 100 real trades in crypto, forex, and gold — I found patterns. Bad patterns. Repeating mistakes. And lessons I wish someone had told me earlier.
So I broke them down into 5 key insights that changed how I trade — and might just save you thousands.
📘 Here’s what’s inside:
1️⃣ Smart Profit-Taking:
How I turned 10 R/R into 32 R/R using a dynamic exit plan.
📘Further resource:
Cycle Mastery (HWC/MWC/LWC)
---
Multi-Timeframe Mastery
2️⃣ The Sleep Edge:
70% of my losing trades happened after bad sleep. Here’s why that matters more than emotions.
3️⃣ No More Blind Stop Orders:
Why I stopped using buy/sell stops without real candle confirmation — and what I do instead.
📘 Further reading:
Breakout Trading Mastery
---
Indecision Candle Strategy
4️⃣ Multi-Layered Setups Win:
How structure, S/R, patterns, and timing stack into high-probability entries.
5️⃣ News Trading? Just Don’t.
The data behind why most of my SLs were hit near news time — and how I avoid the trap.
💡 These aren’t theories. These are real lessons from real trades.
If this video helped you or sparked an “aha” moment, give it a boost, commenting your takeaway, and sharing it with a fellow trader.
lets grow together :)

$BTC Important levels to watch1- Important levels to watch for TOP are:
128,000
139,000
161,000
173,000
2- The most important levels are 161K & 173K
3- But apart from these levels, be ready for any level to be the TOP.
(and again, Bull market is not over, watch my previous analysis BTC/XAG on the last post)

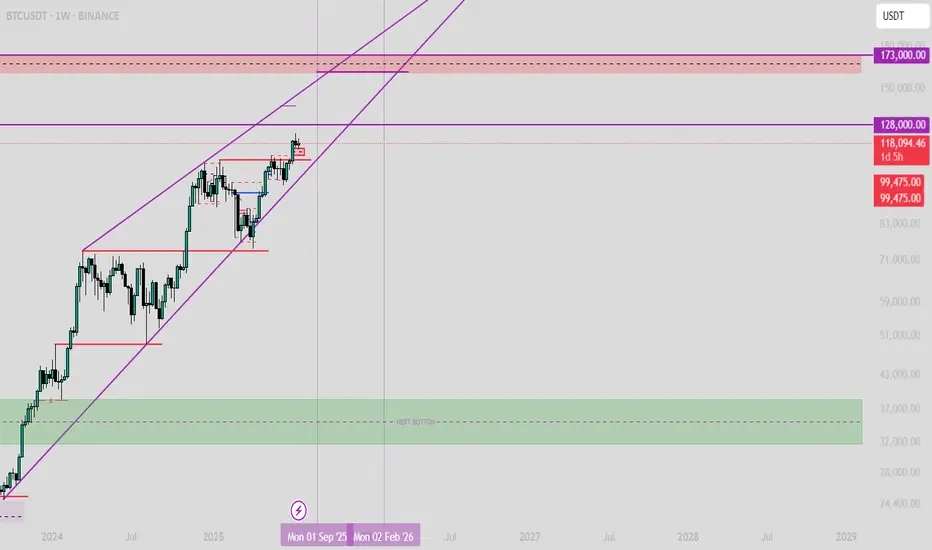
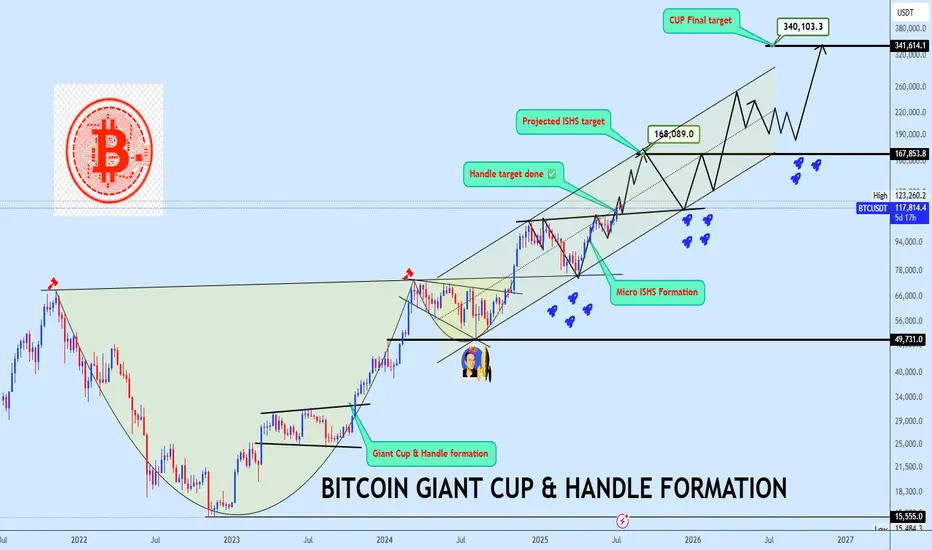
Bitcoin Bottom Three in progress targeting $340kBitcoin continues to defy the doubters, extending its dominance and triggering milestones that once seemed unreachable. A few years ago, we projected a massive rounding bottom with a target near $123K to complete the bottom two of the third halving cycle a bold forecast that has now played out in full:
📌
With bottom two now in the rearview, our focus shifts to bottom three of the fourth halving cycle, projected to mature around October 2025, barring time shifts:
📌
As shown on the chart, price has now split into a giant Cup & Handle formation and successfully broken out from the neckline. BTC is currently coiling inside a rising channel structure with trajectory toward the final projected target at $340K. A micro inverse head and shoulders (ISHS) formation has also emerged, offering a key accumulation zone near the neckline, this will be a crucial region to watch for entries.
Let price action do the talking. Share your view and let’s dissect this historic setup together.
Volatility Period: July 24-26
Hello, traders.
If you "Follow", you can always get the latest information quickly.
Have a nice day today.
-------------------------------------
(BTCUSDT 1D chart)
BTC is in a step up trend.
Looking at the bigger picture, it can be seen that it is in the second step up trend.
The important volatility period in this step-up is expected to be around August 2-5 (up to August 1-6).
Therefore, we need to look at what kind of movement it makes as it passes through the previous volatility period of around July 25 (July 24-26) and around July 31 (July 30-August 1).
In other words, we need to check which section is supported and which section is resisted, and see if it breaks through that section.
What we can see now is that it is checking whether there is support in the 115854.56-119086.64 section, that is, the HA-High ~ DOM (60) section.
Since the M-Signal indicator on the 1D chart has risen to the 115854.56 point, the key is whether it can receive support at the 115854.56 point and rise.
If it falls below the M-Signal indicator of the 1D chart and shows resistance, it is likely to meet the M-Signal indicator of the 1W chart.
This flow is an interpretation of the separation learned when studying the price moving average.
Therefore, we can see that the maximum decline point is when it meets the M-Signal indicator of the 1M chart.
-
Industries (coins, tokens) that are renewing the ATH are actually outside the predictable range.
Therefore, we should think of it as a situation where it is not strange whether it falls or rises at any time and think of a response plan.
Since it is currently within the predictable range, we can create a response strategy by checking whether there is support in the 115854.56-119086.64 section.
However, as I mentioned earlier, the volatility period is about to begin, so caution is required when making new transactions.
That is, you need to check whether it breaks out of the 115854.56-119086.64 range during the volatility period that continues until July 26.
And if it breaks out, you need to check whether it is supported or resisted in that area and respond accordingly.
-
The OBV indicator of the Low Line ~ High Line channel is showing a pattern of rising above the High Line.
Accordingly, if the OBV indicator is maintained above the High Line, it is expected to show an additional rise.
In accordance with this, you need to check whether the K of the StochRSI indicator shows a movement to rise in the oversold range and a transition to a state where K > D.
You also need to check whether the TC (Trend Check) indicator continues its upward trend and can rise above the 0 point.
If these conditions are met, it is expected that BTC will rise above 119086.64 or show a pattern of rising.
-
This decline created a low trend line, creating a perfect rising channel.
Therefore, we need to see how far we can go up along the rising channel created this time.
In that sense, we should pay close attention to the movement during the volatility period around July 25th (July 24-26).
-
Thank you for reading to the end.
I hope you have a successful trade.
--------------------------------------------------
- This is an explanation of the big picture.
(3-year bull market, 1-year bear market pattern)
I will explain more details when the bear market starts.
------------------------------------------------------

What's The Lowest Bitcoin Can Go? (Top Altcoins Choice —Comment)Bitcoin just hit a new all-time high recently and is consolidating just below resistance. I have a question: How far down can Bitcoin go on a sudden retrace?
That's a great question. Assuming that Bitcoin will continue growing mid-term and long-term, we can expect some more consolidation before higher prices. A retrace is not mandatory but is possible. A correction is almost impossible; low probability; not likely.
The worst case scenario Bitcoin does go down and the action should stop right at the previous high. Resistance turned support. That is, $112,000 to $110,000 would the first and main support range. Harder for Bitcoin to move much lower but these levels are not active yet.
If Bitcoin were to produce an extreme shakeout before additional growth, I would say the worst possible would be a touch of $104,000, but this is still a low probability setup. The chances are that Bitcoin will continue sideways while the altcoins grow. The fact that the altcoins are bullish means that Bitcoin will resume growing in due time. The next major move is another advance exceeding $130,000. It can happen within weeks or next month.
Patience is key on Bitcoin, the altcoins need to catch up.
Sometimes, Bitcoin can go sideways for months wile the altcoins grow. Prepare to wait or switch yourself to some mid-sized and small-cap altcoins. The big pairs tend to move like Bitcoin. Each chart needs to be considered individually.
Thanks a lot for your support.
Feel free to leave a comment with your favorite altcoin for an update. I will do an analysis for you in the comments section below.
Namaste.