BTC CAN HIT 125K AFTER SHORT CORRECTIONHello friends, Bitcoin has made an incredible climb, carefully looking at the chart and also based on Elliott wave theory, it is clear that Bitcoin is completing submicro wave 4 of micro wave 5, wave 4 is usually an extended wave that covers a large time period with up and down fluctuations, I think the end of submicro wave 4 will be in the 110k-112k range in the four-hour timeframe. I think Bitcoin will break the 25k range in the coming days.
USDTBTC trade ideas

BITCOIN PREDICTION: HUGE BREAKOUT SOON!! (watch this level) Yello Paradisers! I'm sharing with you multi-timeframe analysis on Bitcoin, levels to watch out for, confirmations we are waiting for, and everything needed for successful professional trading that is being profitable in the long run.
I'm sharing with you zig-zag from the Elliot Wave pattern formation. I'm also sharing a possible impulse we are going through, a head and shoulders pattern and its target, and the next major resistance and support levels.
I'm sharing with you a contracting triangle setup and how to trade it, along with an ending diagonal setup and how to trade it. Watch out for confirmations and how the price is developing based on what I have been talking about in this video, then trade it as a professional trader should.
Make sure that you have a great risk management, trading strategy, and tactic for entering the trades. I have explained some tactics that I'm watching for in this video, but make sure that all these tactics are well within your larger trading strategy and that you're approaching the market professionally. Don't try to get rich quick.
Make sure that you are focusing on long-term profitability and survival. This is the only way you can make it in crypto trading!

BTC Consolidates Below Key Resistance – Is a Breakout Imminent?Bitcoin is currently consolidating beneath the major psychological resistance near $120,000. The medium-term trend remains bullish, supported by a series of higher highs and higher lows. However, recent candlesticks with long upper wicks reflect hesitation among buyers at elevated levels, pointing to potential exhaustion in short-term momentum.
Despite this, there are no clear signs of bearish divergence or strong reversal patterns. The sideways range between $112,000–$120,000 likely represents a healthy consolidation phase after a strong rally. If the price maintains support around $113,000 and breaks above $120,000 with convincing volume, the next leg higher could follow swiftly.
For now, buyers remain in control, provided BTC holds key structural supports. A breakout confirmation is crucial for bullish continuation.

Bitcoin · $137,000 Next Target Followed by $155,000There won't be a correction for Bitcoin. Not now, not yet. The reasons why I already explained in several earlier publications that predicted the current scenario. The bullish breakout that is from the long-term consolidation range. That's the reason, that's the reason why Bitcoin will not go lower without first going higher.
Since Bitcoin consolidated for 7 months below $110,000, it will continue climbing until it reaches higher.
The next target is $137,000. At this point a correction can develop and if it does, we don't expect this correction to last long. The correction can be strong, deep, surprising, but it cannot be long in duration. That is because Bitcoin is headed toward $155,000 and that's the main level for this bullish wave. Until this target is achieved, nothing can stop the future of finance, Bitcoin is moving ahead.
The proof is in the altcoins market. "The altcoins follow Bitcoin." In the current situation, Bitcoin is consolidating while the altcoins grow. If Bitcoin were to crash, the altcoins wouldn't move one dollar higher. In fact, they would be crashing even stronger and faster.
Bitcoin would need to just falter for one day for the altcoins to crash to new lows. What is happening now? Bitcoin can shake; Bitcoin drops; Bitcoin consolidates, and the altcoins continue to grow. That's the proof that the next main—major—move is an advance for Bitcoin. Never SHORT Bitcoin when the market is bullish and strong.
Bitcoin is a growing phenomenon, it is very young. Just think of the US Dollar or Gold. How old are these instruments? How old are market securities and stocks? Some corporations are hundreds of years old. Countries? Thousands of years and still living... Bitcoin can have a life span of 80 years, 140 years, 200 years, 500... who knows. It is a question market. But there is no doubt that it is young. When you are young, you cannot stop your own growth. Bitcoin is already growing and will continue to do so. I will not be surprised when I see Bitcoin trading at $1,000,000+. It might take several years, but several years back Bitcoin was trading at $5k. What's the price now?
$120,000. Trading near resistance is bullish. No corrections. No drops. No retrace.
Thank you for reading.
Namaste.

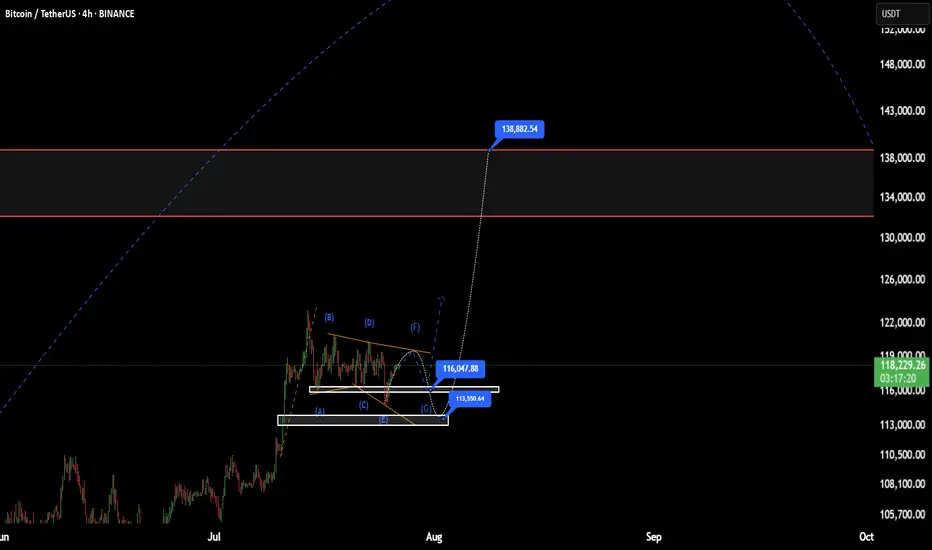
BTC(based on NEo wave)This range price is shown as a bow-tie diametrical.
I think G wave will end at one of those prices, 113 or 116
after this it will start a good bullish wave.
stop loss is 110K and the first target is 138K.
TradeCityPro | Bitcoin Daily Analysis #135👋 Welcome to TradeCity Pro!
Let’s move on to the analysis of Bitcoin and major crypto indices. In this analysis, as usual, I’m going to review the futures triggers for the New York session.
⏳ 1-Hour Timeframe
Yesterday, Bitcoin broke the 119,395 level but couldn’t hold above it and has now returned below this level, currently sitting on its previous trendline.
✔️ Today, the market will probably try to form more structure, and I think Bitcoin will range.
⭐ However, if it wants to move, we can enter a long position with the trigger at 120,594.
🔽 For a short position, we can enter if the 116,000 support area breaks.
👑 BTC.D Analysis
Let’s move on to Bitcoin Dominance. Yesterday, dominance had a bullish move, and finally, a support floor managed to prevent further drop in dominance.
🧩 A retracement to 61.20 has occurred. If this retracement continues, the upper levels are 61.53 and 62.
A break of 60.46 will start the next bearish leg.
📅 Total2 Analysis
Let’s go to Total2. This index has formed a range box between 1.48 and 1.55 and is still oscillating within it.
🎲 If 1.55 breaks, we can open a long position, and on the other hand, if 1.48 breaks, the price could correct to lower support levels.
📅 USDT.D Analysis
Let’s move on to Tether Dominance. This index also has a range box and is still moving inside it.
🔑 Breaking 4.13 is very important for the future market trend and could lead to a drop in dominance.

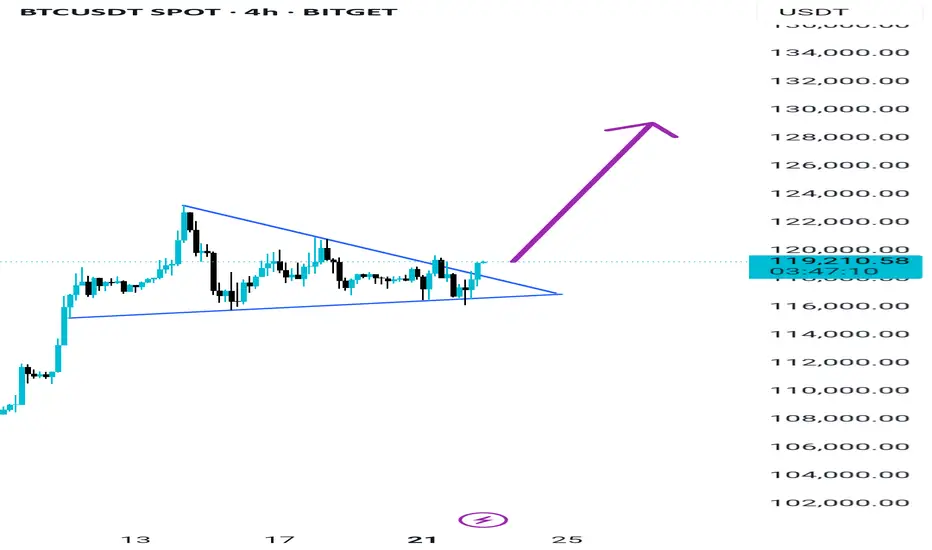
BITCOIN: THE PERFECT STORM - MULTIPLE BREAKOUT PATTERNS ALIGNED⚠️ CRITICAL SUPPORT LEVELS
🛡️ Support 1: $115,000 (-3%) - Triangle support
🛡️ Support 2: $110,000 (-7%) - Channel support
🔴 DANGER ZONE: $105,000 (-11%) - Multiple pattern failure
So...
Strategy: Quick profits on pattern completion 🎨
Entry: $115k (Triangle breakout confirmation) 📊
Stop Loss: $114k below (Tight risk management) ❌
Target: $125k (+10%) ✅
Time Horizon: 2-3 weeks 📅
Risk/Reward: 1:6 🎯
________________ NOTE _____________
⚠️ This is not financial advice. Bitcoin is highly volatile and risky. Only invest what you can afford to lose completely. Always do your own research and manage risk appropriately 🚨
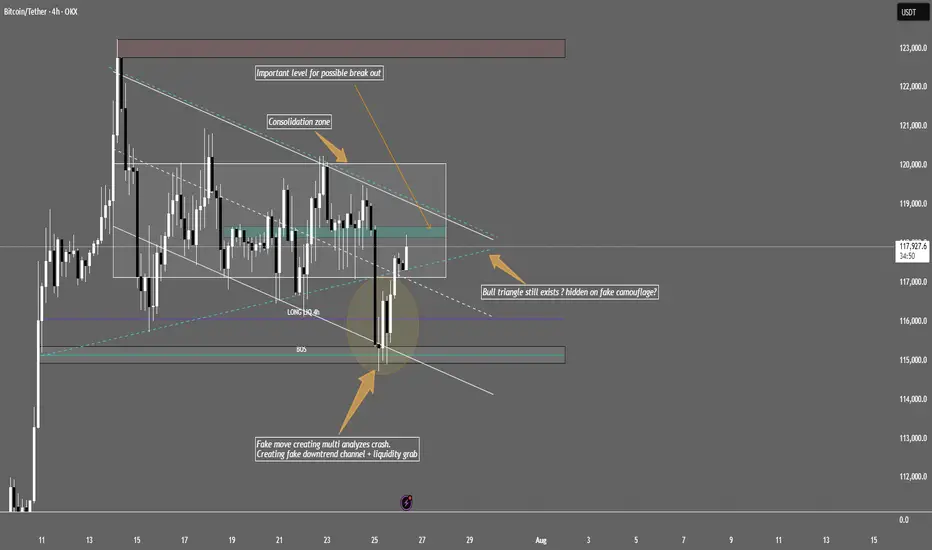
BTC/USDT Bull triangle still exists ? Hidden on fake camouflage?Bitcoin is moving sideways in a tight consolidation range between $117,000–$120,000 . Institutional players are accumulating positions here based on recent on-chain whale inflows, positive funding, and OI increase.
Key points with real chart zones:
The big drop down was likely a "fake out": Price wicked down to ~$115,000, triggering stop losses below this support, letting smart money buy cheaper.
Strong bounce back:
After the sweep, price quickly reclaimed the range, returning above ~$117,300–$118,000 , indicating strong buyer presence.
Bullish triangle is still valid:
Structure holds as long as price trades inside/bounces between $117,000 (lower zone/fake-out base) and $120,000 (upper resistance/consolidation top). Watch for volume spikes around $118,000–$120,000 as signs of institutional accumulation or breakout intent.
If price breaks above the range:
If we see a proper H1/H4 close above $120,000, expect a strong move to the next resistance: $123,000–$124,000 zone.
If price breaks down and holds below:
Sustained price action below $117,000, especially after another fake-out, could lead to a drop toward previous demand/stop zones at $115,000, and if that fails, further down to $110,000–$113,000.
Bottom line:
BTC sits in a “make-or-break” zone between $117,000–$120,000. Break out above $120k opens the path to $124k+. Loss of $117k/115k support risks further downside. Order flow and on-chain favor bulls for now, but always use stops – low volatility ranges can quickly resolve with liquidity grabs.
Tip:
Don’t chase every breakout or drop. Watch closely how price reacts near $120,000 (upside) and $117,000/$115,000 (downside). It is crucial to follow macroeconomic news, especially FED updates – trade safely and always do your own research!
This is not financial advice!
BTC TRADE PLAN 11/07/2025 - Diamond PatternDear traders,
Technical Analysis of BTCUSDT (Bitcoin/USDT) – July 11, 2025
🕐 Timeframe: 4H
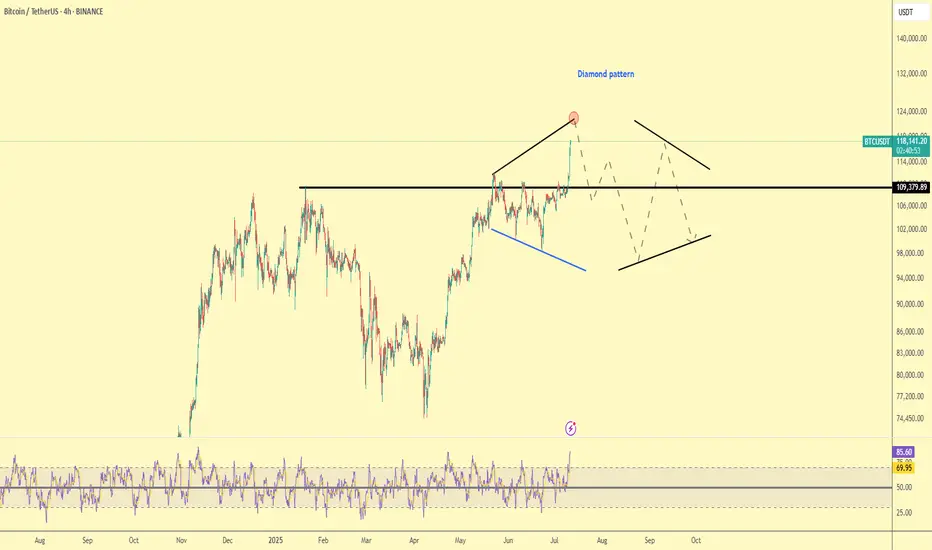
Price has broken above the major resistance at $110,000 and is now trading around $118,000, forming a Diamond Top pattern — a classic reversal formation that may signal an upcoming downtrend or correction.
🔻 Key Highlights:
Major Resistance: $118,000 – current top and potential reversal point.
Key Support: $110,000 – if broken, next targets may lie around $95,000–$100,000.
Diamond Pattern: Typically a bearish reversal signal after a strong uptrend.
RSI Indicator: Currently in overbought territory (above 85), suggesting buyer exhaustion.
📉 Possible Scenario:
Price may reverse from $118,000 -120,000 and test the $110,000 support. A break below that could lead to a deeper correction in the coming weeks.
Regards,
Alireza!
Bitcoin at Descending Channel Resistance – Rejection Imminent?🔻 Bitcoin at Descending Channel Resistance – Watch This Level Closely!
📉 BTC/USDT is currently testing the top boundary of a well-defined descending channel on the 2H chart.
🟨 This zone has acted as strong resistance in the past, and the current reaction suggests the potential for a short-term rejection.
Unless we see a clean breakout above $120K with strong volume and follow-through, the more probable scenario is a pullback towards the midline or lower boundary of the channel.
💡 Notably, this area also aligns with a local supply zone and prior liquidity sweep, making it a key decision point.
⸻
🧭 CryptoPilot’s Take:
This is where patience pays off. No breakout = no FOMO. Watch for confirmation before acting.
⸻
❓ What’s your view?
Will BTC break out and flip bullish here — or is a deeper correction on the way?
👇 Share your thoughts in the comments!
💬 Follow for daily high-probability setups using Smart Money & Wave Theory. Let's grow together!

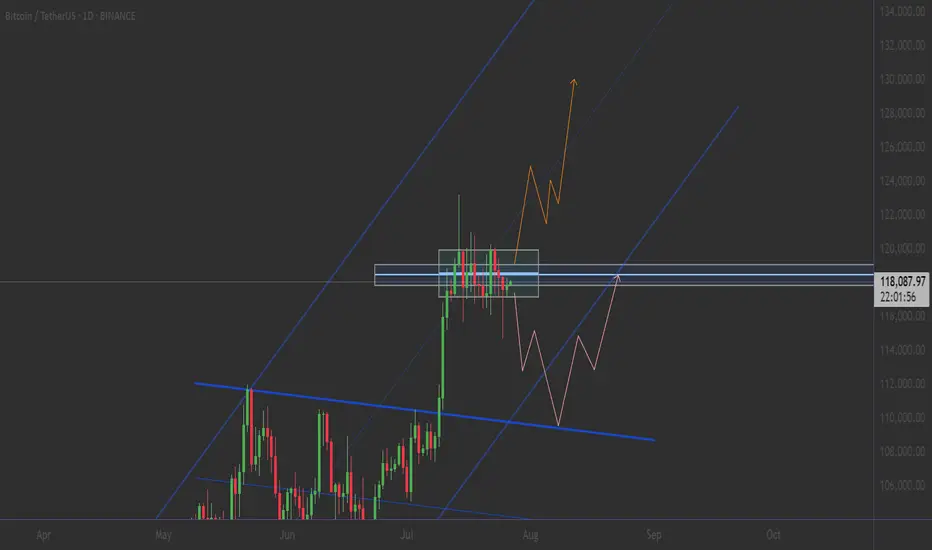
A slight pullback to around 112,000 is expected before a bullishThere is a double top on the daily timeframe. It could pull back to the previous support level that I mentioned in the chart. Moreover, there is a healthy trendline support that can help BTC price bounce.

BTC update - July 25 2025After hitting 123,000 zone, Bitcoin has started a downward correction. For the past ten days BTC was mainly showing sideways movement until it crossed below the important support zone of 115,000.
As shown on BTC's chart (on the left), we can expect BTC to continue dropping towards 113,000 zone where there's a midterm trendline and also a fib level. Whether weak or strong, an upward reaction is expected when BTC reaches down there.
BTC CME chart (on the right) also shows there is an unfilled gap located in the 114,380 - 115,635 zone which is most probably going to get filled soon. please note that at the moment BTC CME futures price is about 1,000 dollars more than that of BTC so it is probably safe to assume that 114,000 level on CME Futures chart is equivalent to 113,000 level on BTC's chart.

BitcoinBitcoin/TetherUS (BTC/USDT) Trading Analysis - Jul 15, 2025
Key Observations:
Price Movement:
Current Price: $117,692.46
24h Change: -2,148.72 (-1.79%)
Range: Low of $116,250.00 to High of $119,940.83
The price is currently near the lower end of the day's range, indicating bearish pressure.
Support and Resistance:
Support Levels:
Strong Support: $112,000.00 (marked as S/L)
Intermediate Support: $113,500.00 and $110,000.00
Resistance Levels:
Immediate Resistance: $119,900.00
Higher Resistance: $120,000.00 and $122,500.00
Profit Levels:
The "Profit" section lists potential take-profit targets, with the highest at $135,000.00.
The price has recently dipped below the $120,000.00 psychological level, suggesting weakening bullish momentum.
Trend Context:
The chart spans from June to September, but the current price action (July) shows consolidation after a potential pullback from higher levels.
The presence of multiple support levels ($112K–$116K) suggests a critical zone for buyers to defend.
Actionable Insights:
Bearish Short-Term: The price is below key levels ($119,900–$120,000) and has broken below $118,250.00. A retest of support at $112,000.00 is plausible.
Bullish Reversal Signal: If BTC holds above $112,000.00 and reclaims $120,000.00, it could target $122,500.00 or higher.
Risk Management: A break below $112,000.00 (S/L) may trigger further downside toward $110,000.00 or lower.
Conclusion:
The market is currently in a corrective phase. Traders should monitor the $112,000.00 support for potential reversals or breakdowns. A close above $120,000.00 would shift bias to bullish.

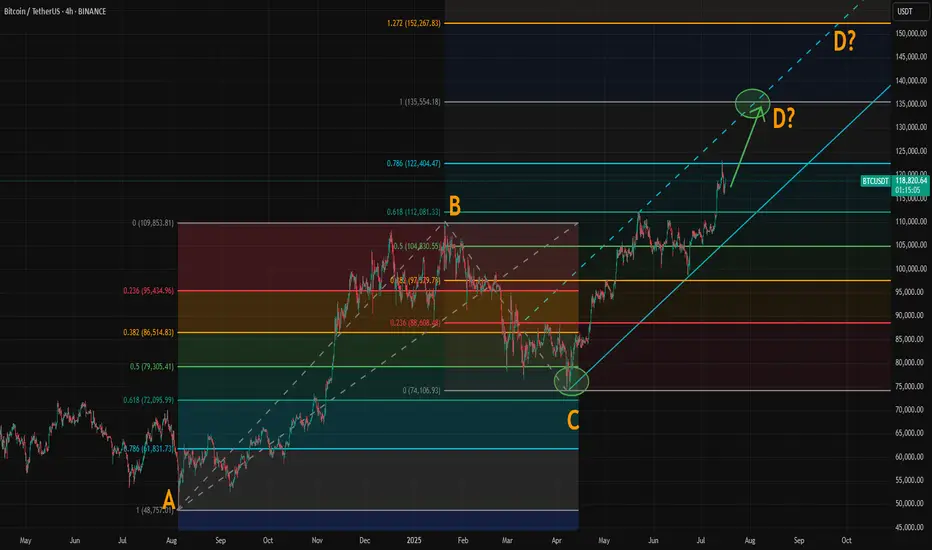
Where Could Bitcoin Make Its Cycle Top? Model and ABCD AlignedWith the breakout above resistance around 110,000, Bitcoin’s rally appears to be back on track. If you've been following our crypto analysis, either here or on our website, you’ll know our target range for this bull cycle is between 135,000 and 150,000, with the top of the range possibly extending further depending on the strength of the final wave.
Now, a possible ABCD pattern is forming, with point D potentially landing at either 135,000 or 150,000. A coincidence? Maybe, maybe not.
How Did We Arrive at the 135K–150K Target?
We based this range on historical halving cycle returns:
Halving Year - Return to Cycle Top
2012 - 9,076%
2016 - 2,122% (↓ 4.27x)
2020 - 541% (↓ 3.92x)
Two things stand out:
Each cycle has shown diminishing returns.
The rate of decline appears roughly consistent, dropping by around 4x each time—but slightly less with each cycle.
So depending on the multiplier used:
If returns fall by 4.27x again → target: 135K
If reduced by 4x → target: 140K
If reduced by 3.92x → target: 142K
If the rate of reduction itself slows (difference of 0.35 between 4.27 and 3.92) → target: 150K
While the sample size is too small, we believe the model holds reasonable logic with fundamental backing from various metrics.
The chart now shows a possible ABCD pattern:
If it becomes a classic AB = CD structure, point D could form near 135K.
If it becomes an extended ABCD (with CD = AB × 1.272), then point D could reach just above 150K.
These technical targets align closely with our halving model projections, increasing our confidence in the 135K–150K range as a likely top zone for this cycle.
Also, please check our earlier post for possible altseason start. A correlation between BTC/ETH and Gold/Silver might give some tips about possible Ether surge.
Bitcoin's Unpopular ScenarioI don't think this scenario is likely to happen. What do you think?? The analysis that I think is most likely to correct the price is the one I posted a few minutes ago.

BTCUSD LONGIt's a long time to write and explain everything, just buy the level with the limit that is at ~117.550. You can count on a short-term rebound.
The one below the touchdown is not worth taking. I'll let you know if it works or not later.

BITCOIN's Situation (12h) !!!So if you pay attention to the TON chart you can see that the price has formed a Ascending wedge which means it is expected to price move as equal as the measured price movement.( AB=CD )
NOTE: wait for break of the WEDGE .
Best regards CobraVanguard.💚

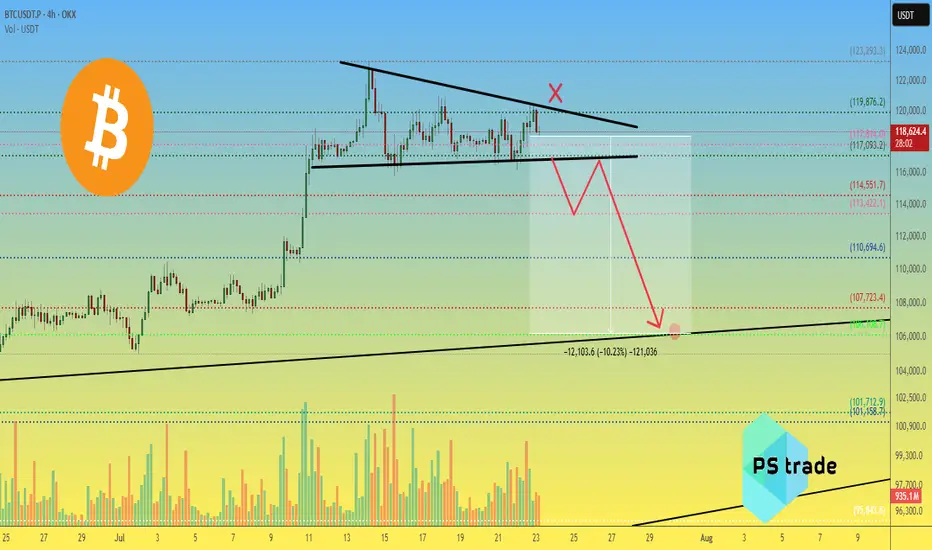
BTCusdt — Descending Triangle. Preparing for a BTC Breakdown?OKX:BTCUSDT chart (4H) shows a well-defined descending triangle.
Price is being compressed under a descending trendline, and volume is steadily declining — a typical signal of an upcoming strong move.
📉 Downside target: $106,100 – $101,700
🔺 Invalidation: breakout above $119,876
📊 Key levels:
Resistance: $117000 / $113,500
Support: $110,694 / $107,723 / $106,108 / $101,712
⚠️ Pay attention — breakout is likely soon.
_____________________
Did you like our analysis? Leave a comment, like, and follow to get more
BTC Reloading for Breakout — Watching for 1H MSS Flip
BTC has bounced from local support (green zone) and is challenging the descending trendline.
The price is now testing the red resistance zone and the upper boundary of the 1H MSS (market structure shift) box.
Scenario A (Bullish):
— If BTC cleanly breaks the trendline and flips the 1H MSS box into support (with a strong close above), this is a trigger for a scalp long.
— Target for the move is the upper green box/previous high area near $122,000.
Scenario B (Bearish/Invalidation):
— If price is rejected at the red resistance and falls back below the green support box, risk of deeper pullback toward $116,000 increases.
BTC has shown resilience by quickly reclaiming support after a sweep lower, indicating strong demand. The market looks to be reloading for another push, with liquidity building up just below resistance. The setup favors a breakout if NY Open brings momentum. The flip of the 1H MSS box would confirm bullish intent. However, caution if the breakout fails — structure remains choppy and a failed breakout can trap late buyers.

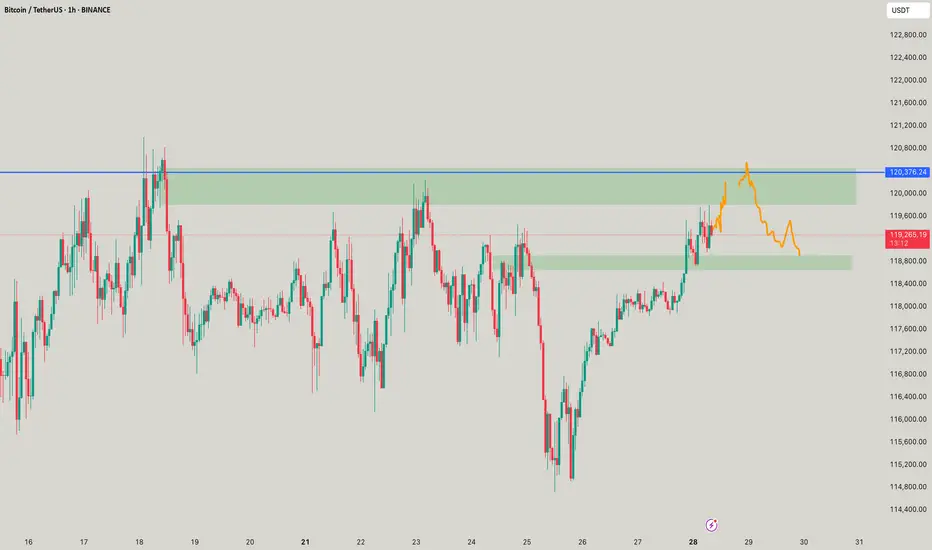
BTC - When 130k?This is BTC, As mentioned, has hit 119,540 and above, will make moves like this till 120,376 to max 120,578 and there if it breaks 120,578 in 1H and close above, then we see good move or we see a fountain which I call as waterfall.
BTC Liquidity Grab + BounceBitcoin just completed a liquidity sweep below the recent low, grabbing stop-losses before reversing sharply. This move often signals smart money accumulation, as shown by the strong bullish reaction off the demand zone. Aiming for the Buy-Side Liquidity (BSL) above $123K. Volume spike and RSI divergence further validate the bullish narrative.

TradeCityPro | Bitcoin Daily Analysis #134👋 Welcome to TradeCity Pro!
Let’s dive into the Bitcoin analysis and key crypto indices. As usual, in this analysis I will review the New York futures session triggers for you.
⏳ 1-Hour Timeframe
On the 1-hour timeframe, Bitcoin has formed a range box between 116829 and 119395. Yesterday, after getting supported at 116829, it climbed back to the top at 119395.
📊 As you can see, buying volume has increased, which indicates strong buyer momentum.
📈 If 119395 is broken, the price could move toward higher targets like 120594 and 122733.
🧩 This 119395 area is also the breakout trigger of the descending triangle. The bottom at 116829 has supported the price multiple times, and now with the descending trendline being broken, price could aim for higher resistance levels.
👑 BTC.D Analysis
Let’s move on to Bitcoin Dominance. BTC Dominance has been supported at 60.46, which is why Bitcoin is moving upward, while altcoins are dropping.
🎲 The dominance trend is still clearly bearish, and if 60.46 breaks, the next downward leg may begin.
📅 Total2 Analysis
Let’s look at Total2. This index has also formed a range between 1.48 and 1.55, and it is currently sitting at the bottom of the box.
🔔 If we get confirmation of support at 1.48, we can consider entering a long position. The main long trigger would be the break of 1.55.
📅 USDT.D Analysis
This index has also formed a range box. The previous support level was 4.08, which has now shifted to 4.13.
💥 The top of the box is 4.25. Given the bearish momentum in dominance, the probability of 4.13 breaking is higher.
🎲 So keep a close eye on altcoins in the coming days, because a lot of capital is flowing into them and they could see significant pumps.
❌ Disclaimer ❌
Trading futures is highly risky and dangerous. If you're not an expert, these triggers may not be suitable for you. You should first learn risk and capital management. You can also use the educational content from this channel.
Finally, these triggers reflect my personal opinions on price action, and the market may move completely against this analysis. So, do your own research before opening any position.

Are you Ready for Next Leg Up BTC Breakout is done on 4H wait for retest and you can take long after confirmation
TP 128K 130K For now