BTC Balanced Volume Profile BTC is now trading in a textbook D-Shape Volume Profile. In english - Buyers & Sellers are happy to transact here and will stay inside the value area & consolidating sideways until further notice.
Consolidation at POC is a signature of this profile, and one of the easiest and least stressful trade setups because now, your mission, should you chose to accept. Is to fade the Highs (VAH) and Lows (VAL) and avoid the middle unless you love donating money to the market.
I'll have buy limit orders waiting right below the VAL where we have the single prints. It doesn't get any easier than this.
Doesn't mean price cant rip through, but this is always the best entry with less risk, especially when the single prints have not been tested yet..
BINANCE:BTCUSD CME:MBT1!
USDTBTC trade ideas

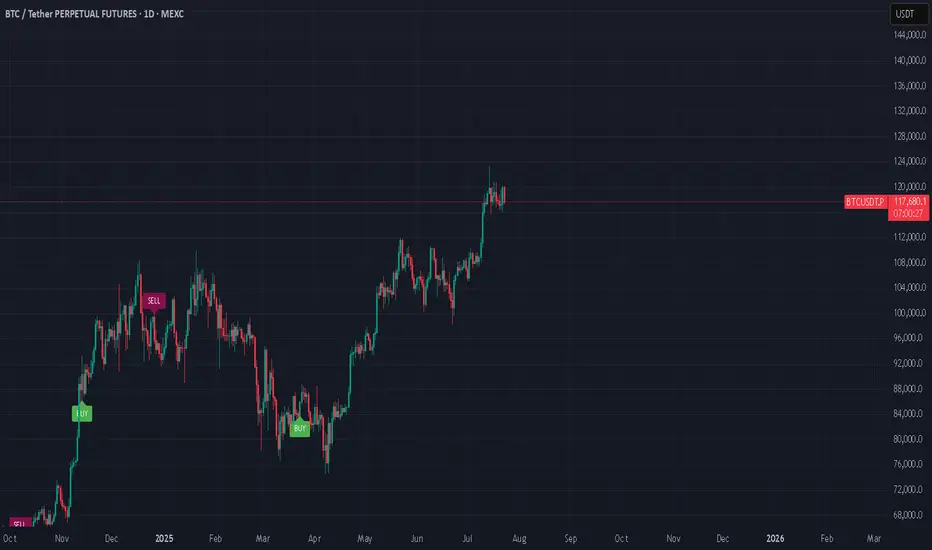
BTCUSDTAccording to previous analysis and its short-term target, Bitcoin has made a correction, and the correction areas, namely $114,000 and $112,000, were the important support areas it saw. However, considering the time, it can be said that the next Bitcoin ceiling will be reached in the period from August 18 to September 22, approximately 35 days.This is a medium-term timeframe on a weekly basis and Bitcoin is expected to reach $144,000 to $148,000 in price. Good luck and be victorious.

BTC Consolidates Below 119,300 Over the Weekend💎 BTC WEEKEND PLAN UPDATE (26/07)
NOTABLE BTC NEWS
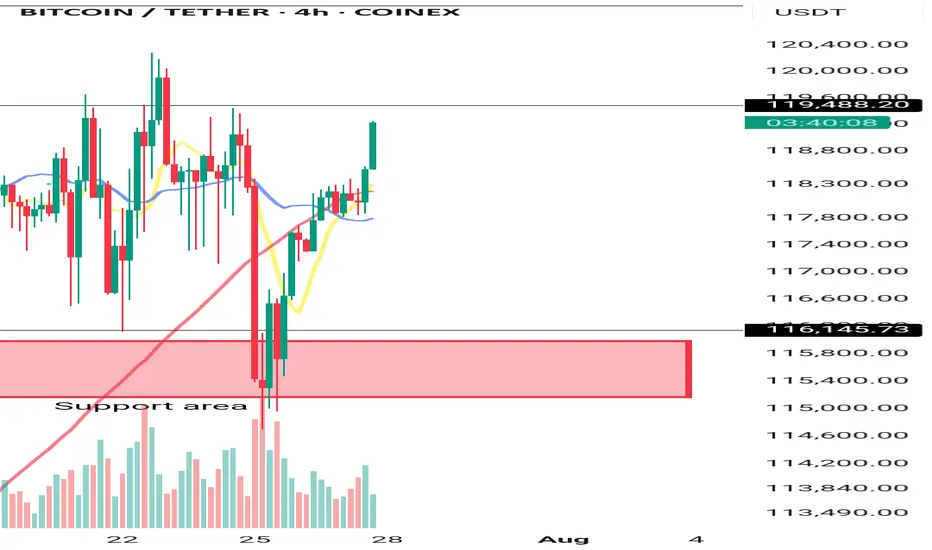
The cryptocurrency market is attempting to stabilize after a wave of sell-offs during Friday’s Asian session, when Bitcoin (BTC) dropped to an intraday low of $114,723. A recovery trend is gradually strengthening, with BTC trading at $115,868 at the time of writing, indicating that buying interest at lower levels may increase in upcoming sessions.
TECHNICAL ANALYSIS PERSPECTIVE
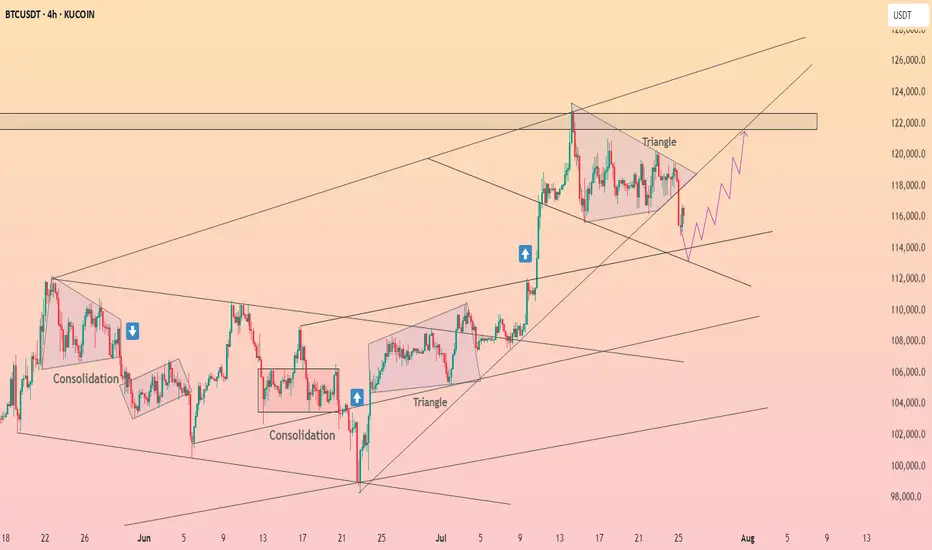
Symmetrical Triangle Pattern
BTC is currently fluctuating within a symmetrical triangle pattern, with converging upper and lower trendlines. This pattern typically signals a strong consolidation phase before a decisive breakout.
Scenario unfolded as planned:
• The price failed to break the resistance zone around $120,000 (previously forecasted as a likely failed breakout zone).
• BTC then dropped sharply to the support zone around $115,000, touching the lower trendline and the potential breakout zone.
• At this level, the price rebounded as expected, indicating strong buying pressure at support.
MA lines supporting the trend:
• The price is currently moving around the 200-day MA (red line), showing that the dynamic support is working effectively.
• The 50-day MA (yellow line) is acting as short-term resistance. If broken, it could support the recovery momentum.
Two potential upcoming scenarios:
🔼 If BTC breaks above the $119,500 – $120,000 zone with strong volume, it may continue to test higher levels around $123,000 – $125,000.
🔽 Conversely, if it faces strong rejection around $119K and turns downward, BTC may retest the support zone at $114,000 – $115,000 once again.
Stay tuned to the channel for the latest and continuous updates on XAUUSD, CURRENCIES, and BTC.

The combination of the Leo New Moon and the Gann Square support Astrologically, we have two important events, the first is the new moon in Leo, which will cause a new movement in the market and give new life to the market. The second is the opposition of the Sun and Pluto, which caused a power struggle between buyers and sellers and at some point there were several stop hunts, but now it seems that the price above 118 thousand is stabilizing and could start a new rally upwards.


BTCUSD Long Trade BITSTAMP:BTCUSD Long Trade - this trade is basically based on Key Levels, prices are very intact as exactly shown.
This is good trade, don't overload your risk like greedy, be disciplined trader.
I manage trade on daily basis.
Use proper risk management
Looks like good trade.
Lets monitor.
Use proper risk management.
Disclaimer: only idea, not advice


Bitcoin is correcting ┆ HolderStatBINANCE:BTCUSDT compresses inside a triangle between $132K and $137K. Breakout above $137K could initiate a run toward $143K. Breakdown exposes $132K. Watch for decisive move.
Consider a sales transaction.Hello friends
You can open a sell trade on the 4-hour time frame, but this is a risky trade.
You can open a trade with half a percent risk.
On the higher time frame, the trend is still up.
BTCUSD | Long | Volume Confirmation (Jul 25, 2025)BTCUSD | Long | Breakout Momentum & Volume Confirmation (Jul 25, 2025)
1️⃣ Quick Insight:
Bitcoin is showing strong bullish momentum after breaking out of its triangle pattern with volume. The move looks set to continue, and we may see higher levels if momentum holds.
2️⃣ Trade Parameters:
Bias: Long
Stop Loss: $109k (risk-adjusted "invisible" stop)
TP1: $121k (partial take profit)
TP2: $131k (final target if momentum extends)
3️⃣ Key Notes:
Short-term, price could test $96k before reaching higher targets.
Longer-term outlook points to potential upside between $112k–$120k if structure holds.
Watching reaction closely around the $109k area as it will determine if the uptrend stays intact.
I expect the pump phase to potentially wrap up around October 20, 2025.
S&P 500 is also at key levels, and its direction could influence Bitcoin’s momentum.
💬 What are your targets for Bitcoin? 140k? 180k? 240k? Drop your thoughts below!
"Please LIKE 👍, FOLLOW ✅, SHARE 🙌 and COMMENT ✍ if you enjoy this idea! Also share your ideas and charts in the comments section below! This is best way to keep it relevant, support us, keep the content here free and allow the idea to reach as many people as possible."
Disclaimer: This is not financial advice. Always do your own research. This content may include enhancements made using AI.

Bitcoin (BTC): OrderBook is Hinting To $115K Bounce | Thoughts?Bitcoin has recently broken the $116K local neckline zone and reached the $115K area, which has been at our attention due to huge orders sitting there.
What we are thinking is that this zone will be a good bounce area, which should lower the price to $120K.
Either way, this zone is important, so keep an eye on it!
Swallow Academy

Bitcoin first target and short-term pump at least to 137K$ aheadAs we can see stop and next range zone for price can be near 135K$ to 137K$ and also major support zones now are 115K$ and 105K$ that can pump price once again if they touch.
Red trendline was strong resistance and it usually stop the pump and it is daily high detector now unless it breaks this time.
DISCLAIMER: ((trade based on your own decision))
<<press like👍 if you enjoy💚
BTC USDT ANALYSIS CRYPTOCAP:BTC is currently correcting after a long bull ride and knowing your entry level as a trader is very important. Look at this chart and make informed decision

BTC SMALL CORRECTION ? we did an amzing long and gained good profit
now looking for a short and a breakout for long
posted next moves
BTC setup projection🚨 BTCUSD Trade Setup – 5M Chart
📉 Entry Zone: 118,950–119,000
🎯 Target 1: 120,280
🎯 Target 2: 120,779
🎯 Final TP: 123,221
🛡️ SL Zone: Below 118,447
✅Confidence level 7.5/10
Bias: Bullish 📈 – anticipating a reversal from the demand zone with clean upside liquidity targets.
Stay patient, wait for confirmation before entry. Let the setup come to you.
As always, manage risk. Risk what you’re okay to lose. 💼

BTC | Long | Target: + 121500This technical analysis is for informational and educational purposes only. It does not constitute financial advice. Remember to always research and consult with a professional before making investment decisions. Good luck! 📈💼🚀

BTC & ETH Structural Market Analysis🚀 Don’t forget to hit follow and smash the 🚀 button if you enjoy this analysis! 🚀
BTC & ETH Structural Market Analysis
⭕️Methodology:
• Dow Theory
• 1D: HWC
• 4H: MDC
• 1H: LWC
Market Outlook:
Yesterday's structural analysis remains valid for today, but let’s review the key levels again.
Today’s approach:
1️⃣ Wait for Total2 to react at 1.53 – if it breaks upward, we hold our positions.
2️⃣ Take profits quickly – if weakness is spotted in the trend, close positions without hesitation.
Note: There’s a chance of fake breakouts on long positions, but personally, I’m willing to take this risk. If TOTAL breaks its key resistance, we may see a strong rally.
Key Levels & Scenarios:
♦️ BTC ♦️
• Important levels: 115 and 120.
• A breakout of these levels will define bullish or bearish scenarios.
• Long trigger remains at 120.
♦️ BTC.D ♦️
• Bullish above 61.44 and 62.17 – bearish momentum in altcoins.
• Bearish below 60.83 and 60.42 – bullish rally in altcoins.
• If BTC dominance climbs, 62.74 is the limit where we stay bullish on BTC pairs. Beyond that, focus shifts fully to BTC itself.
• If BTC breaks 119,500 while dominance drops, it confirms holding or entering longs on altcoins.
♦️ TOTAL ♦️
• Still struggling with the 3.85 resistance level.
♦️ TOTAL2 ♦️
• Successfully broke 1.48, leading to the recent altcoin move.
• Next critical level: 1.55 – a breakout could trigger a strong altcoin rally.
♦️ USDT.D ♦️
• Breakdown of 4.22: keep positions open.
• Breakdown of 4.13: start of a new bullish trend in BTC & altcoins.
• Fake breakout around 4.13: expect range-bound movement between 4.13 – 4.37.
• If 4.37 breaks upward: expect corrections in BTC & altcoins.
♦️ ETH ♦️
• Weakness visible in ETH/USDT chart; candles are not giving strong signals.
• ADX oscillator suggests a sharp move is coming (direction TBD).
• If RSI climbs above 70 with current ADX conditions: expect a sharp bullish move.
🔥 If this analysis helps you, hit that follow & smash the 🚀 to support my updates! And share your comments 🔥
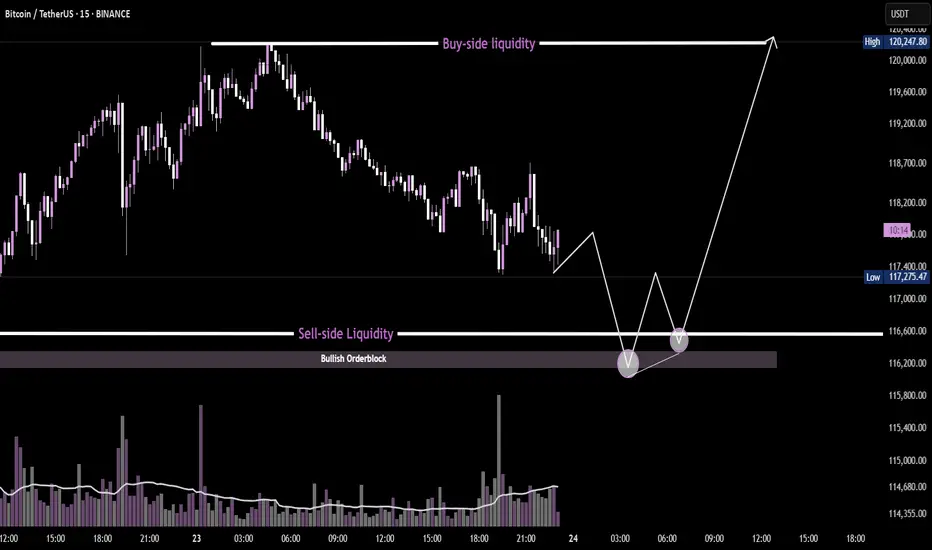
BTC/USDT 15min - Liquidity Sweep + OrderBlockPrice is approaching sell-side liquidity resting below equal lows, aligning with a key bullish order block. A potential W-pattern formation, combined with a volume spike at the sweep zone, suggests smart money accumulation. If confirmed, price may target the buy-side liquidity above, offering a high-probability reversal setup.

Tariffs incoming...July 23: Markets are booming.
August 1st: Tariffs.
I'm just saying, it might be a nice discount...
#market #finance #tariff #trump #crypto #forex #stocks #economy #trading
BTC Price Prediction and Elliott Wave AnalysisHello friends,
>> Thank you for joining me in my analysis. I think we have finished the 1st wave in B wave as Pink W, in this micro correction. In my opinion, we will watch 2nd & 3rd waves XY as in pink color, or Yellow B wave ended successfully, just I need to these confirmations:
* Day TF: Breaking 118451 for the next days and keep on above it, lead to ending B wave successfully.
* 4Hr TF: Breaking 118451 for the next hours and keep on above it, lead to ending W wave successfully ( maybe also B ?)
keep like and support me to continue, See you soon!
Thanks, Bros

Btc UpdateBTC is moving within a falling wedge and is making its fourth breakout attempt.
A successful breakout and retest of the wedge would confirm a bullish trend, while rejection could signal further movement within the wedge.

BTC short setupGiven the bearish divergence on the lower timeframe and grabbing liquidity, we may be able to open a short position with low volume.
