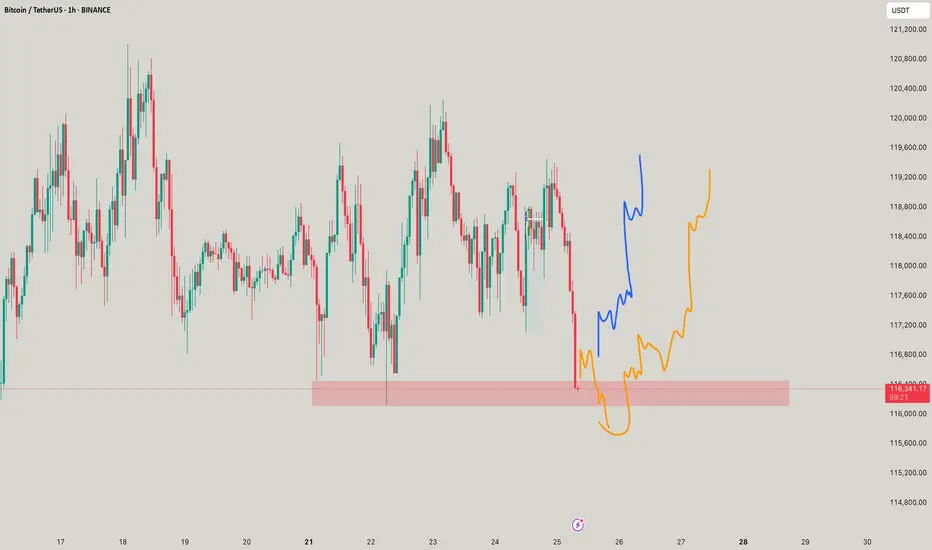
BTC - Nuke down to 104k?Hahhaa noo, but payttern shall commence in orange for a good move altogether!
USDTBTC trade ideas
Accumulate BTC over 115K💎 BTC PLAN UPDATE (July 23rd)
NOTABLE NEWS ABOUT BTC
Bitcoin (BTC) and Ripple (XRP) are approaching their all-time highs, while Ethereum (ETH) continues to grow steadily toward the important $4,000 mark. These top three cryptocurrencies by market capitalization are showing signs of a new bullish momentum, supported by strong technical structures and increasing investor interest.
TECHNICAL ANALYSIS PERSPECTIVE
1. Main Trend
The overall trend remains bullish, with a clearly rising price channel (black diagonal line).
However, BTC is currently in a short-term correction phase, consolidating sideways after the recent strong surge.
2. Key Price Levels
🔵 Strong Support Zone: 116,000 – 117,000 USDT
This zone includes the 200-day moving average (MA200), horizontal support, and a previous bottom — making it a decisive area for the short-term trend.
If this zone breaks, BTC could fall to a deeper support area around 111,000 USDT.
🔴 Resistance Zone: 122,000 – 123,000 USDT
This is a previous peak and a recently “false breakout” area — a strong psychological resistance.
If broken convincingly, BTC could surge to the 130,000 USDT zone (Fibonacci extension 1.618).
3. Possible Scenarios
✅ Bullish Scenario:
Price retests the 116,000 – 117,000 support zone and then bounces.
If it breaks through the 122K resistance, the next target is 130,000 USDT.
❌ Bearish Scenario:
If price breaks below MA200 and the 116K support zone → it could drop to the deeper zone around 111,000 USDT.
4. Technical Signals
There is a triangle accumulation pattern (with flat tops and bottoms).
The “false breakout” at the resistance zone shows that buyers are not yet strong enough and a retest of support is needed.
Follow the channel for the latest and continuous updates on XAUUSD, CURRENCIES, and BTC.

BTC/USD) Bullish trend analysis Read The captionSMC Trading point update
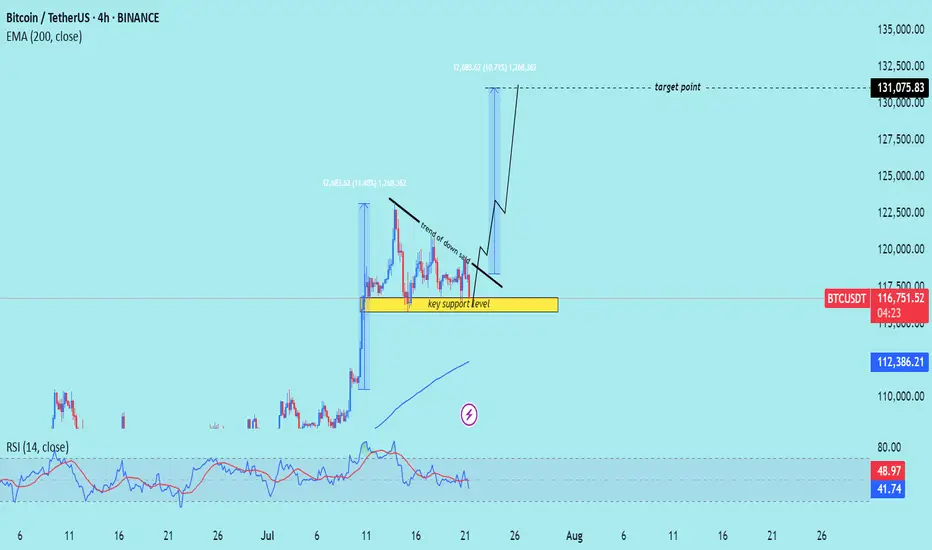
Technical analysis of Bitcoin (BTC/USDT) on the 4-hour timeframe, indicating a potential upward continuation after a period of consolidation above a key support level.
---
Analysis Summary
Pair: BTC/USDT
Timeframe: 4H
Current Price: 116,810.90
Bias: Bullish breakout continuation
---
Key Technical Insights
1. Key Support Zone:
The yellow box marks a strong support level, where price has bounced multiple times.
Acts as a launchpad for the next move higher.
2. Descending Trendline:
A trend of lower highs suggests short-term selling pressure.
Break above this trendline would signal a bullish breakout.
3. Projected Move:
If the breakout occurs, the projected target is around 131,075.83, representing a ~12% gain.
Similar move structure as the previous breakout earlier this month.
4. EMA 200 (Supportive):
Price remains above the 200 EMA at 112,386.80, affirming bullish trend bias.
5. RSI (14):
RSI hovering around 42–49, slightly oversold area, suggesting upside potential remains.
---
Target Point
Target: 131,075.83 USDT
Stop-Loss Suggestion: Below key support zone (~114,000)
---
Trade Idea
Direction Entry Stop-Loss Target
Buy Break above 118,000 Below 114,000 131,000–132,000
Mr SMC Trading point
---
Summary
Bitcoin is consolidating above a strong support zone and under a descending trendline. A confirmed breakout from this pattern could lead to a bullish rally toward 131,000+.
-
Please support boost 🚀 this analysis)
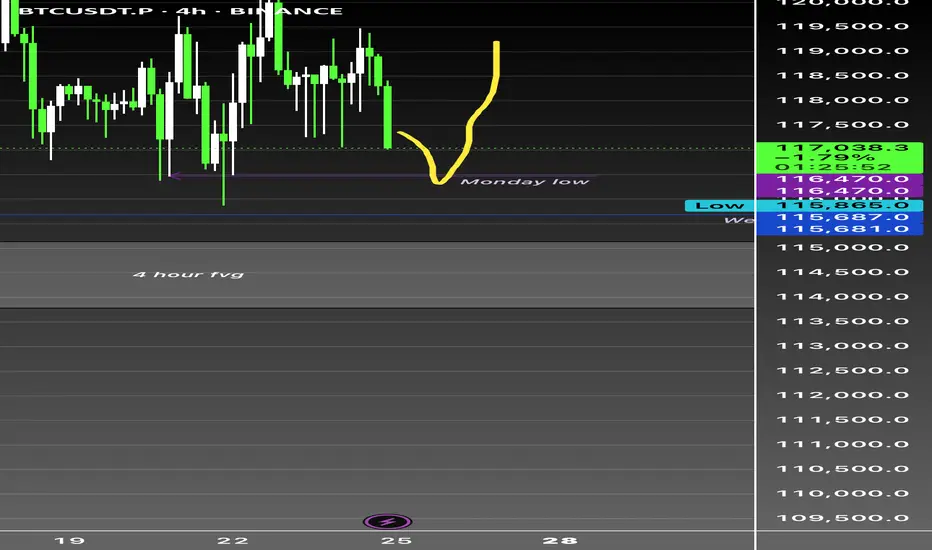
Btc bullish as long as weekly holds CRYPTOCAP:BTC 4H Analysis - Current: $117,150 (-0.97%)
Range-bound between $115,687 week low and $120K+ resistance. Monday low at $116,500 serving as immediate support - critical inflection point.
4H Fair Value Gap clearly defined - institutional liquidity zone demanding respect. Market structure showing inducement above $120K highs with potential liquidity sweep of Monday lows to trigger directional move.
Order blocks forming around $116.5K-$117K zone. Break below $116,500 targets $115,687. Reclaim of $118,500 needed for bullish continuation.
Higher timeframes remain constructive despite 4H consolidation.
#Bitcoin #BTC #SMC
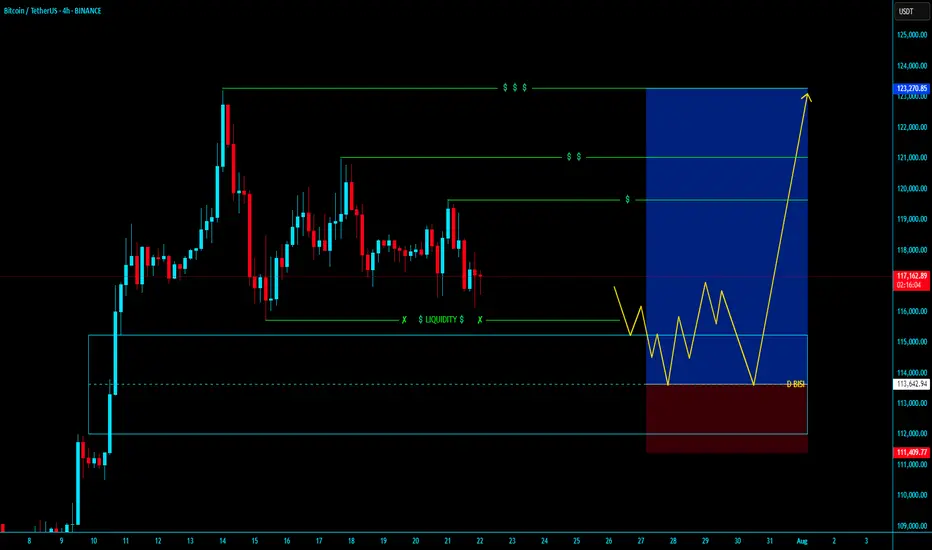
BTCUSDT BUY LONGBTCUSDT BUY LONG FROM DAILY BISI
- Market will fully Bullesh In Every TF with Bullrun with Already Starts
- In Daily TF our Long From Daily BISI
- In LTF after Valid MSS with Valid OBI and Mostly After Run On Stop
- Then our entry for Long time of Holding i think its going to over night holding and book profit Partially / Target is Nearly Liquidity pool
Hold and Enjoyyyyyyyyyyyyyy
~ KGB Priyabrta Behera ~
ICT Trader & Advance Mapping SMC Trader
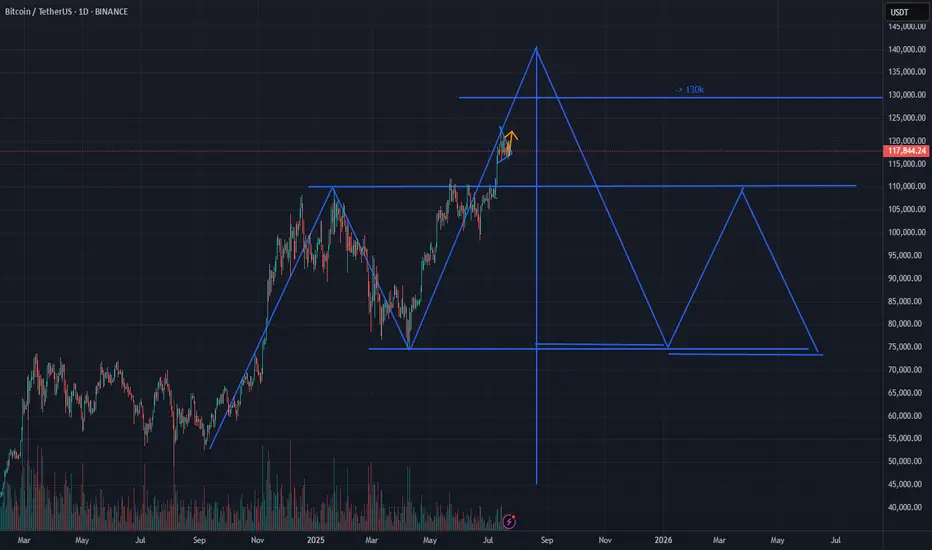
Potential head and shoulders pattern appears on Bitcoin’s globalHey everyone!
I've been on TradingView for a while, but this is my first post — so go easy on me 😄
I'll keep it short and straight to the point.
---
A head and shoulders pattern is forming on the global Bitcoin chart
The pattern is not yet fully formed, and it is difficult to draw any conclusions, but what has already formed may indicate the implementation of this pattern, which we may see in the near future, which means that an upward movement is possible, before the head is formed
Current price: $118k
With this pattern, there is a low probability of a price breakout to $103.4k
The head of the pattern may be at $124k or $129k, provided there is no strong positive news background from the US government regarding Bitcoin
This analysis is based on the technical pattern and also incorporates AI to provide more accurate results.
---
I'd be happy to hear your thoughts, feedback, or any constructive criticism in the comments!
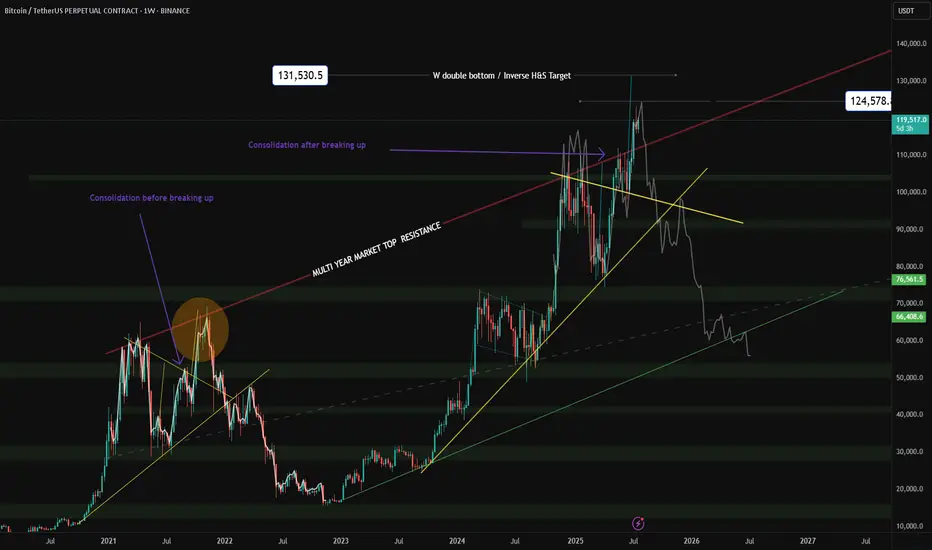
This time it's not different. Still The same macro structure. This time it's not different. we are in the last phase of the bull market cycle.
BTCUSD SHORTI've spotted a potential short-term bearish move in Bitcoin. Taking a closer look at the 4-hour chart, it seems like we're on the brink of a short-term reversal that could align perfectly with the higher time frame trend. Let's see how this plays out

BTC - RotationsStill pingponging between VAL and VAH, so there is not much to update on BTC.
I think patience is key here, most of all don't chase moves but position at the extremes for opposite side, then you are much better placed for continuation moves.
I never try to have much expectations, but there is a smol gut feeling that ETH puts in a new high locally (let's say around 3920-50) while BTC takes out the internal highs at 121k and makes a lower high.
I can be wrong and we simply keep drifting higher, but divergences between ETH and BTC are often worth watching, because the market as a whole usually struggles to maintain strength when alts attract more capital than BTC does (relative to mc).
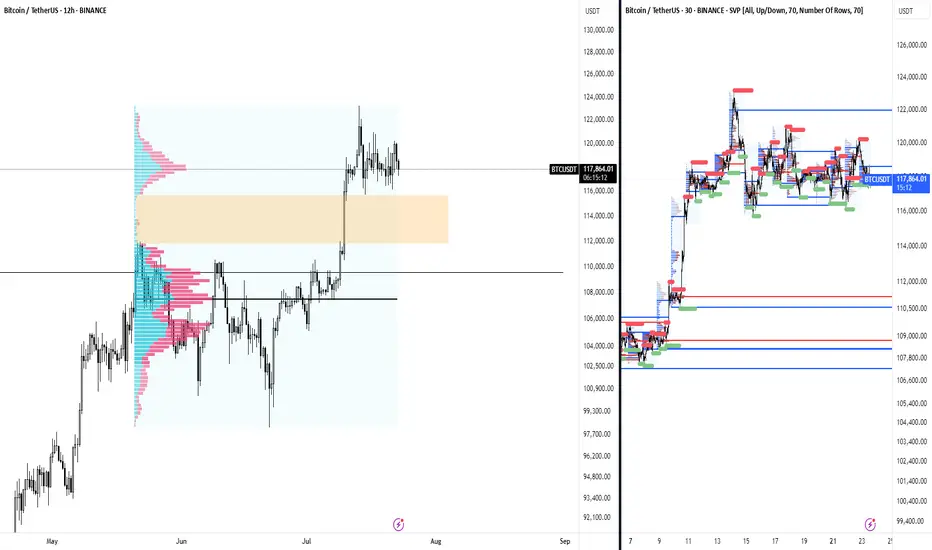
Is it time for BTC big reverse?According to oscillators and volumes, we can expect BTC to soon undergo a significant correction:
- RSI peaks are declining, forming a divergence. A divergence is also observed on the weekly timeframe.
- MACD also shows a divergence.
- Falling volumes amid rising prices.
Horizontal lines mark two levels with minimum volumes in the profile. Such volume drops usually characterize support levels, which can be used as targets for shorting.

BTCUSD NEW OUTLOOKBTCUSD market Continuously running in both sides from last couple of days now market will be touch the support zone you have to great chance to go long from
SOPPORT ZONE if you want
TRADE AT YOUR OWN RISK
REGARD ALBERT

BTC AI Prediction Dashboard - 6h Price Path (23.07.25)
Prediction made using Crypticorn AI Prediction Dashboard
Link in bio
BTCUSDT Forecast:
Crypticorn AI Prediction Dashboard Projects 6h Price Path (Forward-Only)
Forecast timestamp: ~11:00 UTC
Timeframe: 15m
Prediction horizon: 6 hours
Model output:
Central estimate (blue line): -118,258
Represents the AI’s best estimate of BTC’s near-term price direction.
80% confidence band (light blue): 118,206 – 118,719
The light blue zone marks the 80% confidence range — the most likely area for price to close
40% confidence band (dark blue): 117,712 – 119,423
The dark blue zone shows the narrower 40% confidence range, where price is expected to stay with higher concentration
Volume on signal bar: 133.21
This chart shows a short-term Bitcoin price forecast using AI-generated confidence zones.
Candlesticks reflect actual BTC/USDT price action in 15-minute intervals.
This helps visualize expected volatility and potential price zones in the short term.

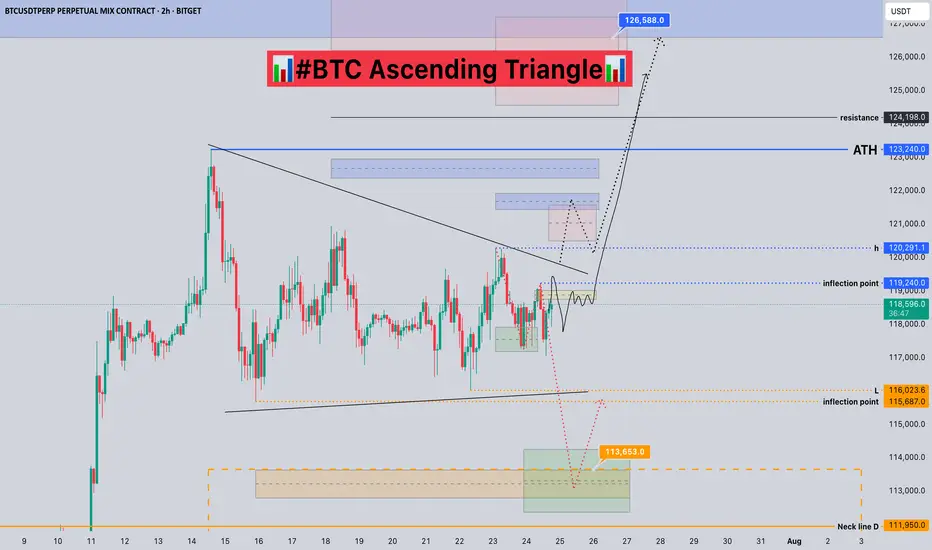
#BTC Ascending Triangle📊#BTC Ascending Triangle📊
🧠From a structural perspective, we are still in a sideways consolidation phase. We have already built a short structure. If we want to continue to rise, we need to break through the blue turning point 119240 and stabilize before we can usher in a big surge.
➡️From a morphological perspective, an ascending triangle is forming. After breaking through h, it is confirmed that the upward breakthrough will occur. The subsequent pullback is worth our participation.
⚠️If we fall below the low point near 116000, we cannot blindly go short, because the sideways consolidation time is too long. After the selling pressure is exhausted, the lows that appear are all opportunities for us to participate in long transactions.
🤜If you like my analysis, please like 💖 and share 💬 BITGET:BTCUSDT.P
BTCUSDT-LONG IDEABTCUSDT is in accumulation forming a triangle if it break this triangle then it will be heading toward top end of the pole buy using a buy stop Stop loss and take profit is mentioned in the chart

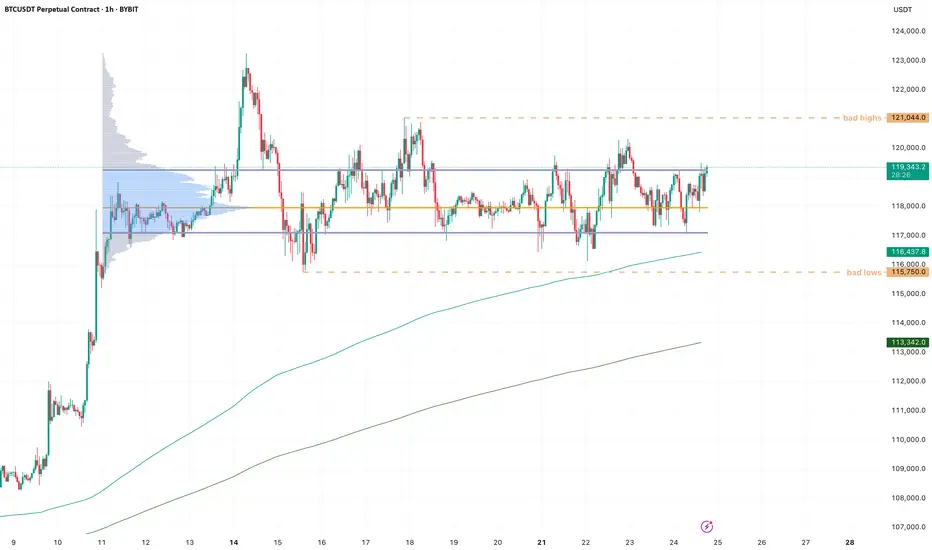
Bitcoin (BTC): Liquidity Hunting + Buyside Dominance | Bullish!What a week we have had so far; it has moved this whole week so far like one big rollercoaster, but nevertheless we are still above the $116K zone so we are bullish.
While we see slight buyside dominance,, we also see huge order limits sitting at $115K,, which means we might still see some kind of "last liquidity hunting."
That being said, we are keeping an eye on $116K and $115K zones.
Swallow Academy

Crypto Market Update & BTC & ETH Analysis
🚀 Crypto Market Update & Technical Analysis
🟢 Bullish News & Positive Signals:
• Altcoin Season Index is rising + CZ calls this the “FOMO season” → signaling emotional growth in altcoins, especially in short timeframes.
• Fear & Greed Index hits 74 → market is in a greedy phase; growth continues but a correction might be near.
• Goldman Sachs: Possible rate cuts from 2025 → expectations for a looser monetary policy, which is good for risk assets like BTC and ETH.
• Whales and institutions buying ETH (over 50K ETH in 48 hours) → suggests accumulation or preparation for the next Ethereum rally.
• $332M inflow into U.S. Ethereum ETFs → strong mid-term bullish fundamental for ETH.
• A whale withdrew 76,000 SOL from exchanges → usually a sign of HODLing and price growth expectations.
🔴 Warning News & Caution Signals:
• Bitcoin selling by long-term holders (high CDD) → selling pressure near historical highs could slow the rally, but not end it.
• Whale opened a 10x leveraged DOGE long ($19.82M) → could cause high volatility and liquidation risk for traders.
• TRON rings Nasdaq bell but TRX is negative → promotional event, but no strong demand reaction.
• BNB market cap surpasses Starbucks, but price is negative → long-term positive, but short-term market may be overheated.
• High Greed Index → short-term correction risk for BTC and alts.
✅ Analytical Summary (News + Charts):
• If technical signs of selling appear (especially on BTC or ETH), take them seriously as news supports selling pressure from some whales.
• Big institutional entries into ETH and SOL confirm the strength of the bigger trend.
• Market is emotional but still has a strong support base under BTC & ETH. Possible corrections = better buying opportunities, not exit signals.
📊 Technical Analysis
Strategy I use:
I analyze HWC (1D), MWC (4H), and LWC (1H).
Entry is based on breakouts in MWC (4H) and confirmation in LWC (1H).
♦️BTC/USDT♦️
• BTC is moving in the 116.2 – 120 range, keeping a bullish structure intact.
• I will not look for shorts as long as 110 holds.
• To keep the bullish scenario alive, we need high volume and sharp candles to break 121 – slow moves won’t work anymore.
• Stop-buy orders near 121 can be used to enter a long if the breakout is strong.
♦️BTC Dominance (BTC.D)♦️
• After a sharp drop last week, BTC.D is now correcting.
• Key level 61.31 was broken.
• The next resistance zones are 62.17 – 62.74 (currently being tested).
• If BTC.D holds above these levels, altcoins could see a bigger drop.
• If BTC.D rejects this zone, alts near breakout points will become our focus with better entry levels.
♦️USDT Dominance (USDT.D)♦️
• Showing signs of forming a bullish structure.
• Next resistance levels: 4.36 – 4.44.
• For a bullish continuation in coins, 4.14 must break down.
• Early but important level: 3.83 – if reached, we must rethink position management.
TOTAL / TOTAL2 / TOTAL3 /♦️ ♦️OTHERS.D
• Currently bearish, but BTC.D and USDT.D will show earlier signs of whether the correction is ending.
• Key levels to watch:
• TOTAL: 3.91
• TOTAL2: 1.55
• TOTAL3: 1.08
• OTHERS.D: 8.05 (a lower high may form if the uptrend resumes).
♦️ETH/BTC♦️
• Key level: 0.02975 (not reached yet).
♦️ETH/USDT♦️
• 3470 is the crucial level to keep the bullish structure.
• Many buyer orders (maker/taker) are stacked here, so the breakout may not be easy.
• Possible fake breakout in this area → could reset the bullish scenario again.
🎯 Conclusion:
The altcoin market correction is not over yet, but BTC & ETH are holding key support zones.
Focus remains on BTC.D and USDT.D.
If BTC breaks 121 with volume and dominance drops, it’s a green light for altcoins.
📣 If this analysis helped you, hit the 🚀, leave a comment 💬, and follow for more updates!

BTCUSDT Forming Bullish WaveBTCUSDT is currently forming a bullish wave pattern, signaling a potential continuation of its upward momentum. This technical setup suggests a series of higher highs and higher lows, indicative of strong buyer demand and consistent market optimism. With volume remaining robust, the foundation for a significant breakout is solid. If the pattern plays out, analysts expect a 09% to 10% gain in the mid to long term, which could be fueled by renewed institutional interest and global adoption.
Bitcoin has historically responded well to bullish wave formations, often leading to aggressive rallies once key resistance levels are breached. As the largest cryptocurrency by market cap, BTCUSDT not only reflects investor sentiment in Bitcoin itself but also often sets the tone for the broader crypto market. The current price action shows consolidation with positive volume spikes, which further supports the bullish thesis and provides a potential launchpad for another major leg upward.
With increasing attention on macroeconomic shifts, regulatory developments, and halving cycles, Bitcoin continues to position itself as a hedge against traditional market uncertainties. The bullish wave pattern now forming could signal that Bitcoin is entering a new phase of growth, especially as global interest in decentralized finance, ETFs, and blockchain innovation surges.
Traders and long-term investors alike should closely monitor this structure. A breakout with volume confirmation could offer an excellent entry point, backed by strong technicals and a solid fundamental backdrop. The combination of a bullish pattern and broader adoption trends makes BTCUSDT one of the most watched assets in the market right now.
✅ Show your support by hitting the like button and
✅ Leaving a comment below! (What is You opinion about this Coin)
Your feedback and engagement keep me inspired to share more insightful market analysis with you!

BTC NEW VOLUME TREND 122KThis is a small time frame update, where BTC can try to target 22K again in the coming time frames. Since the last 15H breakdown volume, BTC can enter new uptrend volume
From the box level, there is a good chance for a new uptrend.

A bearish 12 Month candle could be in the cardsBitcoin made an yearly high of 20% after 6 months in on the yearly candle
This does not make me feel great about the rest of the year
a clear sell signal would be an higher timeframe close under 100k after an upthrust to new ath around 110k - 120k
around 50k-54k for me is an good buy level to build an longterm position:
0.382 fib retracement for an primary 1-2 wave
0.500 fib retracement from the 25k low
0.886 fib retracement from 49k low
50% pullback from current high to projected low
where will bitcoin go ? i don't know, but i do know where i want to buy and when i want to sell

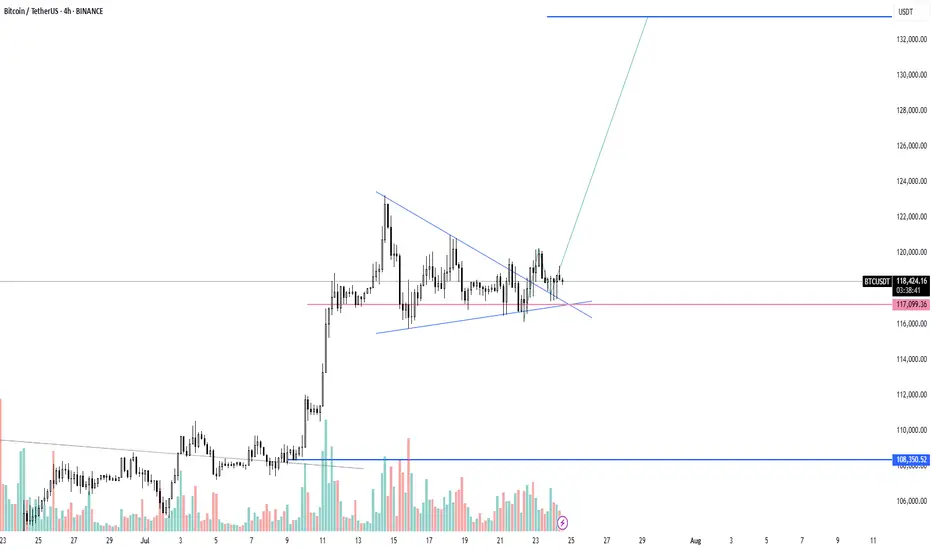
BTC Triangle Consolidation: Ready for TakeoffBTC is gearing up for its next move following a triangle consolidation
Bitcoin Wave Analysis – 22 July 2025
- Bitcoin reversed from support level 116065.00
- Likely to rise to resistance level 122775.00
Bitcoin cryptocurrency recently reversed up from the key support level 116065.00, which also stopped the earlier minor correction 2 at the start of June.
The support level 116065.00 was further strengthened by the support trendline of the daily up channel from June and the 38.2% Fibonacci correction of the upward impulse from July.
Given the strong daily uptrend, Bitcoin cryptocurrency can be expected to rise further to the next resistance level 122775.00 (which stopped the previous impulse wave 1).

BTC - Long SET-UP BINANCE:BTCUSDT
Bitcoin AMC Pattern Forming?
BTC is showing signs of an AMC-style accumulation after a range-bound consolidation. A clean breakout is possible if price respects the 113k–113.8k support zone — potential entry zone for smart money 📈
Alternatively, deeper liquidity may be tapped at the 110k–112k OB zone, offering another high-probability buy setup🔁
Watch for signs of bullish intent in these key zones — price structure suggests upside potential once liquidity is swept✅

BTC possible failed range breakout - Aggressive Move The BTC ATH rally began post cash close and had very thin volume on the break out before setting this range on the higher time frames. Normally, a range after ATHs are made I would be extremely bullish and I am.
Aside from the failed breakouts at the highs, the attempts paired with nuances such as the crypto week impulses, the day of signing GENIUS and new regulatory acts being drafted now, the attempts to break those ATHs were nudged off.
Sometimes come failed moves come fast moves, and so I have to be prepared that BTC will trade between these thin areas on the volume profile from 111k to 115k. 113k being the most noticeable node in the entire profile.
Similar to my analysis on the break to ATHs, I would expect this move to be aggressive and remind us of a 2020 cycle style flush in Altcoins. Kind of already seeing it with the performance of alts today preempting the failed move up on BTC at range highs.
I will NOT be shorting anything in crypto, these are just areas that I am heavily interested in buying. Currently flat perps and will wait for BTC to make its mind up.