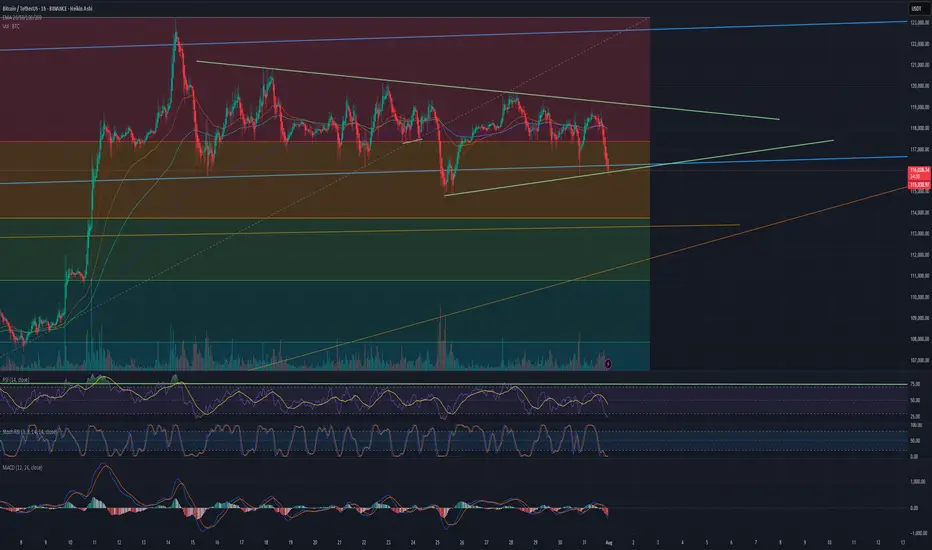
BTC, ETH & Market Structure Outlook – Is the Pullback Over or Ju
💎🚀 BTC, ETH & Market Structure Outlook – Is the Pullback Over or Just Beginning? 🔥♦️
🧠 Dow Theory | Multi-Cycle Technical Breakdown | Index Watch
👉 Don't forget to LIKE, FOLLOW, and COMMENT to support the content!
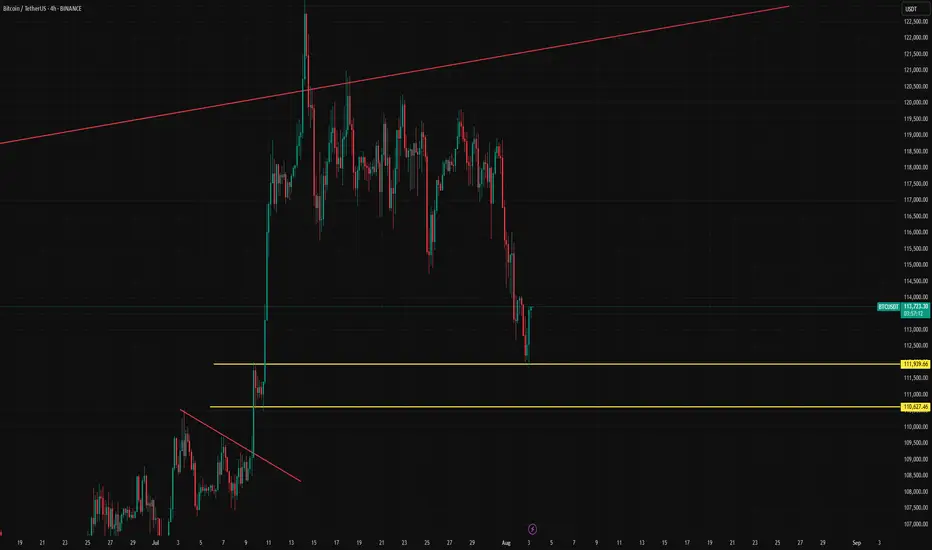
♦️ BTC/USDT Analysis
🔻 The key support at 115,725 was broken – but has the macro trend turned bearish? Not yet.
📉 From the HWC (1D) perspective, BTC has dropped only ~4.5%, which still looks like a pullback.
🟥 However, if price stabilizes below 109,000, we will begin shifting to a bearish macro bias.
🧠 Weakness in trend is present but not confirmed.
🔄 MWC (4H) – Sideways, Then Breakdown
📊 After a strong rally, BTC ranged for about 17 days, then broke below the range support.
🔽 The 4H trend leans bearish, but it's not a strong or confirmed downtrend.
⏱️ LWC (1H) – Clearly Bearish
📉 Lower highs and lower lows are forming. The trend is decisively downward in 1H.
🚀 Bullish Scenario:
If BTC bounces from 112,000, we need:
• A strong new high
• A healthy pullback
• A breakout of the new high → then long entries are valid
❗ Bearish Scenario:
If 109,000 breaks with volume → strong bearish continuation likely.
♦️ ETH/USDT Analysis
🔸 The 3538 level is key.
✅ If ETH shows clear reaction, followed by a breakout, a long position becomes valid.
⚠️ But only after a confirmed trend shift on the 4H timeframe.
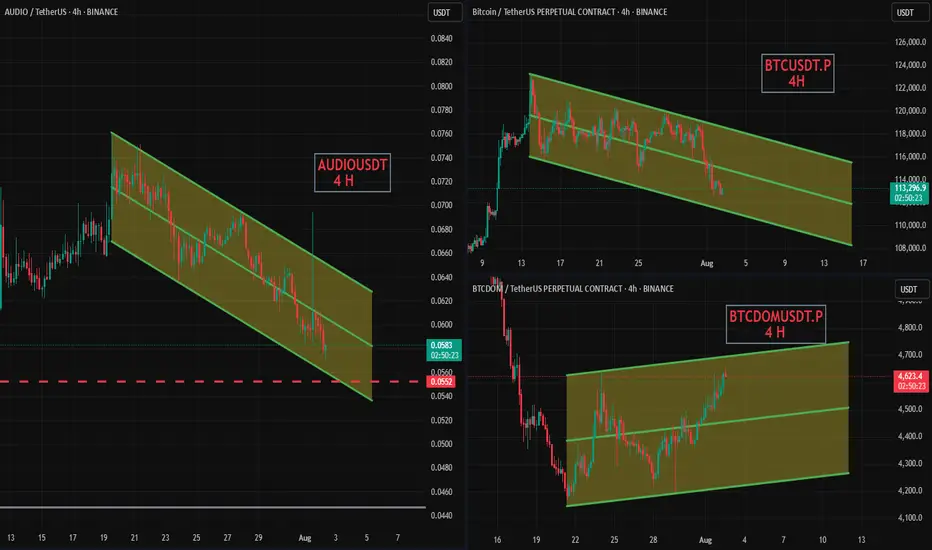
♦️ Top Altcoins
⭕ Most alts are in an uncertain phase.
🕒 It's best to wait until new highs/lows and a valid structure are formed.
♦️ BTC Dominance (BTC.D)
💥 BTC.D broke through the critical 62.22 level.
🟡 Now we wait: Will it hold above or fake out and reverse?
🔻 If BTC is dropping while BTC.D is rising →
👉 Result: BTC drops moderately, but alts drop much harder.
♦️ USDT Dominance (USDT.D)
📉 This chart reflects market fear & greed.
Currently showing reduced greed (risk-off behavior).
🔸 Next resistance levels: 4.63 and 4.72
❗ If these break → bearish bias becomes dominant.
⭕ However, a fakeout here could create a fast early entry opportunity.
♦️ TOTAL Market Cap
📍 Market is sitting on a major support level – but BTC remains the key driver.
❗ No confirmed long setups until BTC structure shifts bullish.
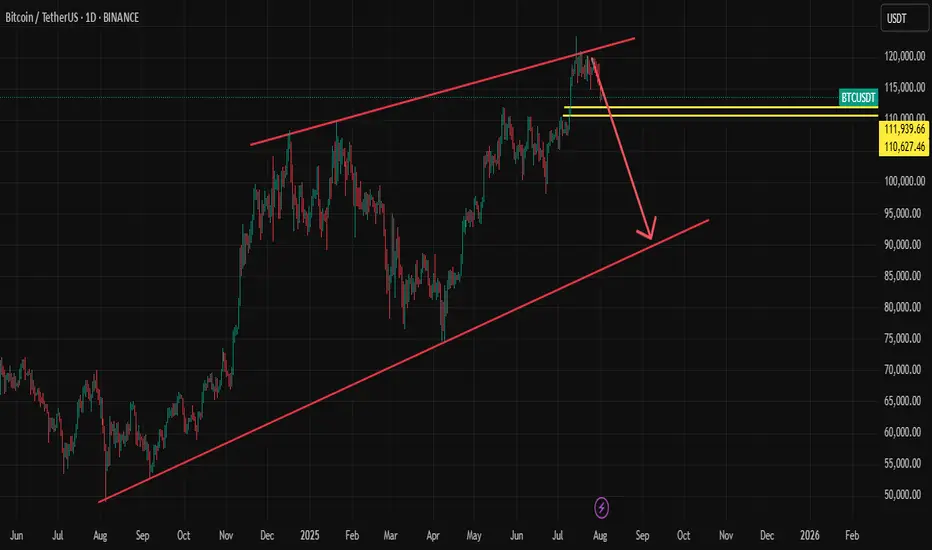
♦️ Strategic Outlook
1️⃣ Not a good time to open fresh positions – wait for clear 4H structure formation
2️⃣ Bias remains bullish overall, but waiting for confirmation
3️⃣ Until BTC trend clearly reverses, we are not focused on BTC.D reversals – they remain secondary
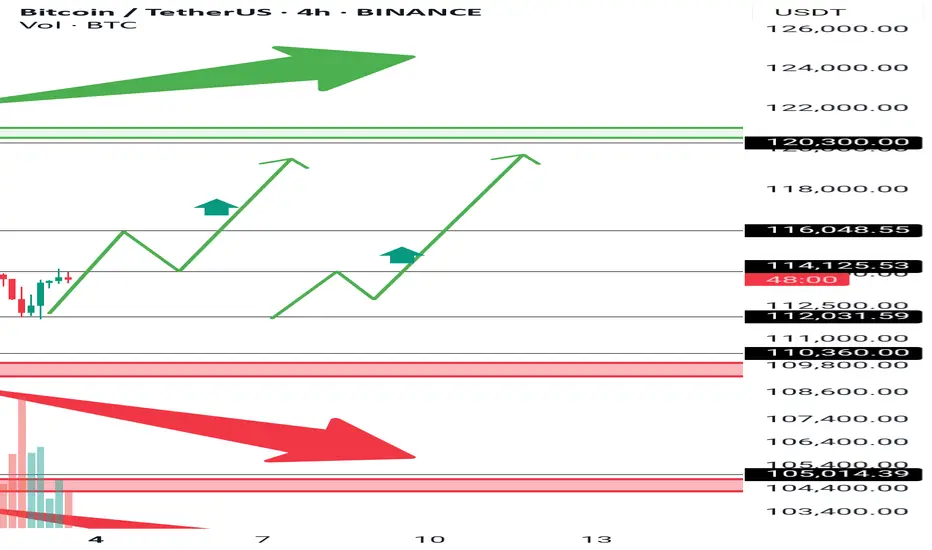
4️⃣ On the Bitcoin chart, you can see another red zone — breaking the first one will invalidate the bullish outlook, and breaking the second one will trigger a search for short positions.
5️⃣ To return to a strong uptrend, breaking the green zone around 120,000.00 is essential.
6️⃣ I’ve drawn two green upward paths on the chart. I’ll be looking for such a path for an early long entry.
💎 Stay cautious, manage risk, and follow structure!
🚀 Smash that ROCKET, leave a LIKE, and hit FOLLOW for daily crypto insights!
USDTBTC trade ideas
Bitcoin at Key Support - Watching for Bullish ShiftHello everybody!
Bitcoin has reached a very important demand/support zone between 110,000–112,000.
If this area holds, we could see bullish momentum building on the chart.
Currently, we are waiting for confirmations.
We're watching closely for any change in market structure or a trend shift.
If it happens, we can expect the price to move up to around 118,000.
Manage your risk and trade safe!
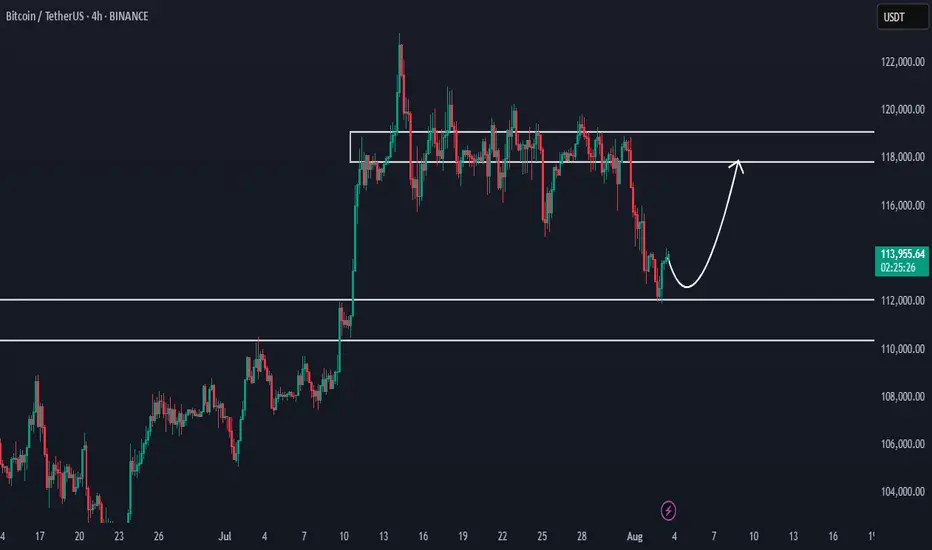
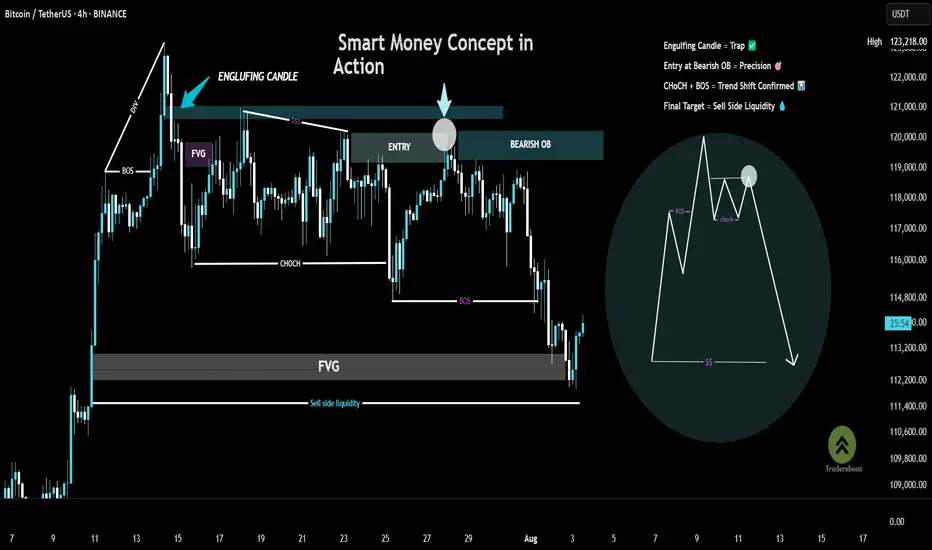
Chart Breakdown – Smart Money Concept in ActionThis chart showcases a textbook example of a bearish setup based on Smart Money Concepts (SMC):
BOS (Break of Structure) at the left confirms a shift in momentum.
A strong engulfing candle pierces into a supply zone, setting the stage for a potential reversal.
Price forms an FVG (Fair Value Gap) and returns to fill the imbalance, offering a high-probability entry within the Bearish Order Block (OB).
A clear CHoCH (Change of Character) signals a bearish trend shift, validated by the second BOS.
The trade targets Sell Side Liquidity, resting below the recent lows—just where smart money aims.
🎯 This setup combines precision, patience, and the power of understanding institutional moves.
BTC AccumulationI'm excited to see how this develops. Might be the first proper accumulation since april at the lows.

BTC/USDTWell, well, well, I see that Bitcoin has hit its main support. Those who bought and made profits can slowly exit.
BTC Retests Broken Channel as Daily Support Holds📉 On the 4H chart, CRYPTOCAP:BTC has broken below its descending channel and is now testing the underside — a classic retest zone where bulls and bears collide 👀
📆 Meanwhile, the Daily timeframe shows price still holding above the key 11800 support level 🛡️
This zone remains pivotal — a bounce could reclaim momentum, while a failure might trigger deeper downside.
The next few candles will be critical for directional clarity.
Are we about to reclaim the structure or head lower from here?
Not financial advice.

mBos 15mWe came to 4h OB, swiped some liquidity and received a reaction. Expectations for the price to return back to the wick and continue up to take the liquidity there. As there is no break on the HTF, it is a trade with higher risk.
Entry on the test of 15m wick. Stop below wick. Take on the swim of EQH

BTC LONGAfter major pullback Bitcoin takes Support. Our Algo-based Indicators also showing their first BUY-Signal with Alert.

BTC/USDT Long Setup - Dual entry position
🟢 BTC/USDT Long Setup – Dual Entry Position
I’m going to be positioned long on BTC with two entries:
Entry 1: 109K if don't holds
Entry 2: 101k
Stop-loss: 97K
Target: 148.5K
R/R: ~5.4:1
Reasoning:
Market structure remains bullish with clean higher highs and higher lows.
The recent selloff is seen as a healthy pullback into a demand zone — not a trend reversal.
Both entries are placed to catch either a shallow bounce or a deeper liquidity sweep without overexposing risk.
Setup remains valid unless we see a clean daily close below 97K.
Letting price play out — no mid-range noise, no overtrading. Focused on structure, trend, and reward.
---

AUDIO Uptrand Soon ✏️ Use less funds 5% - 10%
💥 Wait & Get The Best Entry
🦊Pair : AUDIO/USDT 🟢
🐢 SPOT
🏎️ Buy :
♻️ 0.0555
♻️ 0.0540
🎉️Sell -
💵 0.0664
💵0.0779
Bitcoin is experiencing a major collapse!Bitcoin will fall further from August 8th and crypto will officially end.

_Bitcoin Update
Bitcoin broke below on our local PBr2 support at 115.7k range keylevel panda fam this is a sign of first mini bearish breakout, But bitcoin price is now sitting at H4 PBr1 support keylevel 113.4k range.
Two case scenario possible for bitcoin:
1.) White broken lines — a bounce back with new swing high confirmation for reclaim back on structure for possible next major trend resistance breakout | BULLISH BIAS 🐂
2. ) Red broken lines — retest at PBr2 as local resistance and possible drop until white box support at 111.2k range area | BEARISH 🐻
In this case while bitcoin is ondecision panda fam we need to consider both case scenario with a short term possibilities but the best thing here is we already know where are the importance keylevel S / R to observe not just a random keylevel. 💯
ℹ️ : @pandanambawan

Reversal from Channel Bottom or a Real Breakdown? Identifying th
🎯 BTCUSDT - Analysis
🔹 Analysis Date: 1 August 2025
📉BTCUSDT:
Price is currently moving inside an ascending channel and has touched the bottom of the channel again, offering a potential buy opportunity.
However, for those seeking a low-risk entry, the zone around 118,000 could be ideal—if price returns to the channel and confirms support.
Although it seems the channel’s lower boundary might break, this could be a fake break to mislead traders before a rebound.
The support at 110,000 is a crucial short-term level; if it fails, a deeper correction toward 98,090 or even 94,000 is likely.
Our targets remain at the upper boundary of the channel.
⚠️ Risk Management Tip: Wait for confirmation near 118,000 if unsure, and always size positions based on overall volatility.

BTC ReaccumulationI'm watching here either for a local model 1 which forms a MTF accumulation model 2 or a model 1 which deviates the range one more time. There is a nice build up of liquidity to the upside but sadly no clear model 2 POI. The technical target if the model gets confirmed will be the range high but i would expect to see a new ATH. Let's see.

BTC CLS RANGEWaiting for the daily candle to close inside of the range as seen on the graph with the horizontal line.
Then I will be immediatly looking for an entry, either a FVG or a OB or an IFVG. (I will update the entry points asap)
Then I will target 50% of the range as seen on the graph market 0 .5 on the fibonacci retracement where I will take 75% of the position.
Then I will set my SL at my entry price and target the opposing range or LQ which is at 119500-120000K

BTC/USDT Analysis – Negative Sentiment Returns
Hello everyone! This is the daily analysis from the trader-analyst at CryptoRobotics.
Yesterday, Trump officially imposed tariffs on 68 countries, which are set to take effect on August 7. The legality of these tariffs is already being challenged in court. The market reacted extremely negatively to this development — despite the overall positive technical setup and volume distribution, Bitcoin dropped to $114,000, deeply testing the volume zone and local lows.
Despite all of this, the bullish scenario should not be ruled out. The price action during the decline has been weak: while selling pressure is high, it has not led to a full breakdown of the lows. At this stage, it’s better to avoid opening new positions. Consider long setups only after a test of the $117,600–$118,600 supply zone, and watch for a buyer’s reaction on the retest.
If negative momentum continues, the price could drop further to the next support zone.
Buy zones:
• $110,000–$107,000 (accumulated volumes)
Sell zones:
• $117,600–$118,600 (accumulated volumes)
This publication is not financial advice.

BTC/USDT Weekly – Bearish Rejection Brewing?Bitcoin has been riding a strong uptrend supported by a long-term ascending trendline, but recent price action is showing signs of exhaustion near the $123K–$142K supply zone.
The chart suggests a potential deviation above resistance, marked by a fakeout wick and aggressive rejection (highlighted with red blast icon). If price fails to reclaim and hold above $123K, the structure risks breaking down below trendline support — opening the door to a larger correction.
🔹 Key Resistance Zone: $123,260–$142,134
🔹 Critical Trendline Support: Recently broken — watch for retest/failure
🔹 Bearish Confirmation: Clean break & lower high formation under $109K
🔹 Next Major Demand Zone: $75K–$85K region
This setup leans bearish unless bulls can reclaim the upper blue range and re-establish control. If not, we could be looking at a significant macro retest of previous breakout levels.
#Bitcoin #BTC #BTCUSDT #CryptoChart #TrendReversal #BearishScenario

$BTCtime to run it back from here little more to go for H4 reclaim then looking for the thick white line to be reclaimed
stop below range low

Big Decision Point for BTCThis is a big decision point. If BTC can hold at or above yesterday's low at 115700, then its to the MOON from here. Otherwise... its not gonna be pretty for any and all altcoin hodlers.
HOLD THE LINE BULLS!!
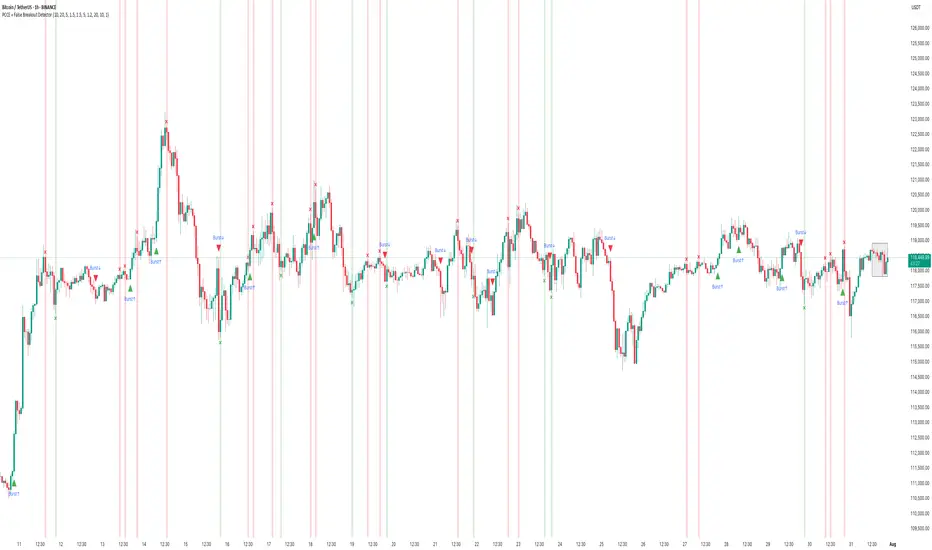
How to Use the PCCE + False Breakout DetectorHow to Use the PCCE + False Breakout Detector to Catch Trap Zones in BTC
Chart: BTC/USDT (1H)
Tool Used: PCCE + False Breakout Detector
Type: Educational – How to identify false breakouts and anticipate trend shifts.
⸻
🧠 What the Indicator Does:
The PCCE + False Breakout Detector is designed to identify breakouts from coiling ranges and filter out trap moves that often fool traders.
🔹 Burst↑ / Burst↓: Valid breakout from a price coil with volume and trend alignment
🔻 Red X: Marks a bull trap — breakout failed and price reversed lower
🟢 Green X: Marks a bear trap — breakdown failed and price reversed higher
By flagging where breakout structure fails, the indicator helps traders avoid false entries and position early for reversals.
⸻
✅ Recent Performance Highlights (BTCUSDT 1H):
📈 From July 13–31:
• Burst↑ on July 13 led to a clean uptrend (+$1,500 gain)
• Red X on July 16 called a failed breakout — price dropped hard
• Green X on July 16 caught the bear trap — price reversed immediately
• Burst↓ on July 21 triggered a sharp decline, validating breakdown
• Red X on July 30 spotted the bull trap just before price reversed down
📉 Even in sideways ranges, Red/Green Xs signaled when the move lacked conviction, allowing traders to wait instead of chasing noise.
⸻
🔍 Current Interpretation:
• BTC is trading inside a choppy structure after a recent Burst↑ and Red X combo.
• The X mark zone (gray box) warns of instability — bulls attempted a breakout but failed.
• If price continues to stay below the Red X high → likely retracement ahead.
• If we see a Green X + rally soon → potential reversal setup in progress.
⸻
📚 How-To Use the Indicator:
1. Burst Signals (Breakouts)
🔸 Use these to enter when coil compression breaks with volume
🔸 Works best when aligned with EMA trend and breakout body
2. Red / Green X (False Breakout Detector)
❌ Red X: Price spiked above resistance but lacked follow-through → trap
✅ Green X: Price dipped below support but got bought → trap
3. Confirm with Price Context
🔄 Look for reaction candles after X marks
📏 Set tighter stops — traps often reverse fast
🔔 Combine with your S/R zones or order block theory
⸻
🧠 Final Thoughts:
The PCCE + False Breakout Detector isn’t just about spotting momentum — it’s about reading intent vs. failure in price action.
BTC’s current structure shows signs of indecision. Trust the Xs to tell you whether the move has legs — or is just another trap.
🎯 Learn to trade the trap, not fall into it.
BTC not looking pretty....even with lipstickBTC just crossed every meaningful SMA technical indicators and has been lingering at the top of the house like an unwanted guest. Awaiting an UltraBear signal, but watch out on this as massive dips repeat themselves and we are in an overheated market. Also, IMHO don't short as it could back-fire. It will naturally go back to it's support levels....fun times!

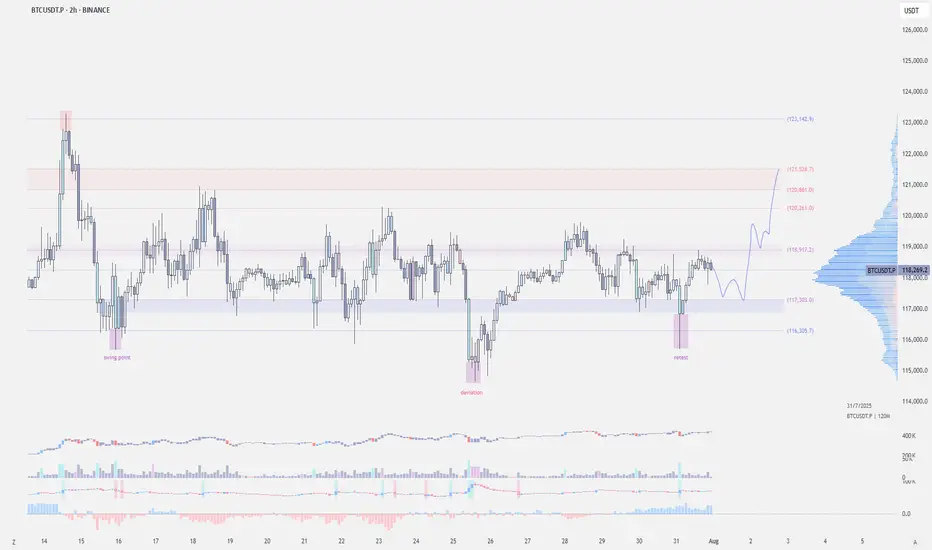
$BTC - Swing Point RetestCRYPTOCAP:BTC | 2h
We've got a swing point retest at 115.7k after the deviation at 114.6k
For bullish continuation, holding above 117.3k-116.8k is key — any break below invalidates the setup.
A clean break above the 120k resistance, I'm expecting we could finally tag 121k–122k (untested supply zone).