btcusdtbtc might form deep crab harmin pattern. so far our lower high is 120952 .until this level is breached we may go lower to 112 k area
USDTBTC trade ideas

ABC BTC LongCurrently in a Long position on btc, closed the short out in profit from previously posted short abc. Now in a great position from the start of the new ABC long as depicted on chart

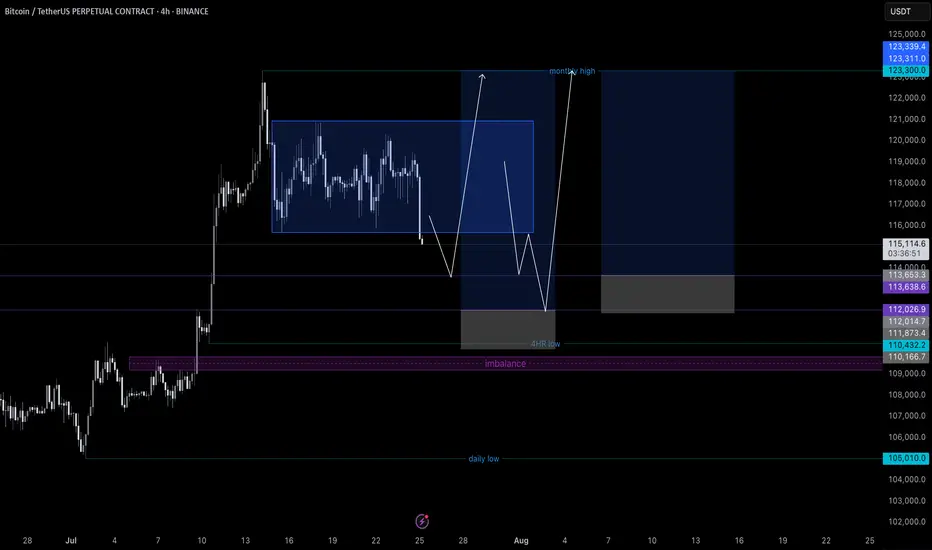
#BTC Update #10 – July 27, 2025#BTC Update #10 – July 27, 2025
Bitcoin continues to move between $116,400 and $118,900, and staying within this range is actually a positive sign, even in bearish scenarios. A decisive close below $114,000, however, could open the door for a deeper and more prolonged correction.
Although BTC hasn’t broken to new highs yet, its ability to hold here means the trend isn’t broken. A strong breakout above $118,900 could lead to a rally toward $123,300 and possibly even $128,000.
🔹 On the 4H chart, BTC seems to have completed its minor correction.
🔹 On the daily chart, the correction remains incomplete – despite dipping to $114,700, the key $112,900 zone hasn’t been tested.
In lower timeframes, BTC remains squeezed within a symmetrical triangle. While it occasionally pokes out, it quickly returns inside — showing indecision.
📌 Direction is unclear at the moment. There’s no strong signal for Long or Short. Waiting for confirmation with volume and a clear breakout is the safer play.

SellRejection Level
Daily Volume
Market Structure Shift
London US Session
Trend Line Break
Untapped Order Point
Fake Breakout at $116,522 Could Signal BTC Bull Continuation📈 Fake Breakout at $116,522 Could Signal BTC Bull Continuation — Watch Altcoin Triggers
After a fake breakdown below $116,522, Bitcoin is showing signs of resuming its uptrend.
A key bullish signal was yesterday's daily candle closing above this level — maintaining structure and giving bulls hope.
🔍 Current Strategy:
For BTC, I suggest watching $119,151 as a long trigger, only if BTC Dominance is rising.
If BTC.D isn’t rising, then it’s better to focus on altcoin long setups.
I’m still not opening any short positions — structure remains bullish, and risks of fake breakdowns remain high.
---
💬 Altseason loading? Drop your favorite alt setups in the comments!

Wyckoff ReaccumulationCurrent range looks like another reaccumulation range. Spring has just occurred and looking for a move back and then above the top of the range.
Bearish if we breakout then retrace forming an upthrust after distribution (UTAD).

BTCUSDT ready to march towards 140k zoneHere is once again a view of what I had shared when BTCUSDT was trading around 95k in may 2025.
The price action has been similar to our expectation. A push towards 106k-110k and then drop around 95k-98k before boucing towards 137k.
So the next stop for the current upward move is 137k. The push from 98k has brought us into 120k zone and currently we were holding in that range from 114k-120k for a while.
However, this is going to change now. I believe the last drop towards 114k was a false breakdown from 4h support 4HS1 since the price quickly grabbed this region again by moving towards 117k.
I believe the path to 137k-144k is clear now and we see that in coming weeks. After that we shall likely see a correction towards 120k area before move to the target around 150k.
Lets see how the price moves. We will keep monitoring it time to time and I will provide updates. But till now it has been moving according to the plan.
#BTC #BTCUSD #BTCUSDT #BITCOIN #CRYPTO CRYPTOCAP:BTC $crypto

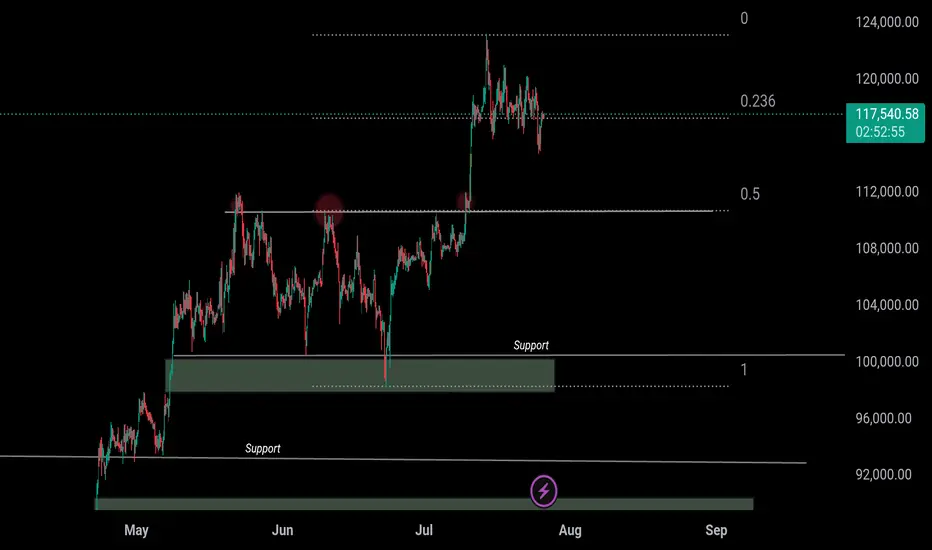
BTC 110k or 150k ??𝗪𝗶𝗹𝗹 CRYPTOCAP:BTC 𝗕𝗼𝘂𝗻𝗰𝗲 𝗮𝘁 $𝟭𝟭𝟬𝗞 𝗼𝗿 𝗖𝗿𝗮𝘀𝗵 𝗕𝗲𝗹𝗼𝘄 $𝟭𝟬𝟬𝗞? ‼️‼️
Breakout rallied from $110,500 → $123,293
Now pulling back toward 0.5 Fib retracement $110K
Retest Scenario:
– Hold above $110K = Bullish continuation toward $150K ATH
– Breakdown below $110K = Risk of deeper correction below $100K
Drop your thoughts below — bounce or breakdown?
CRYPTOCAP:BTC
BTCUSDT 6H#BTC is currently working on filling the CME Gap between $115,635 – $114,060 in the Futures chart, as previously mentioned. On the 6H spot chart, a falling wedge has formed, and there's a high probability of a retest of the wedge’s support line.
This support line lies within the support zone at $114,723 – $114,159, and the 6H SMA100 adds another layer of confluence. A dip into this zone is normal and not a cause for concern.
📌 In case of a bounce and breakout above the wedge resistance, the next upside targets are:
🎯 $119,505
🎯 $120,805
🎯 $122,461
However, if the support zone breaks, the potential downside targets will be:
🔻 $112,021
🔻 $108,977
📉 According to the liquidity map, there’s a cluster of liquidity around $114,000, and a brief wick below it is likely. Be cautious with your entries and exits.
⚠️ As always, use a tight stop-loss and apply proper risk management.

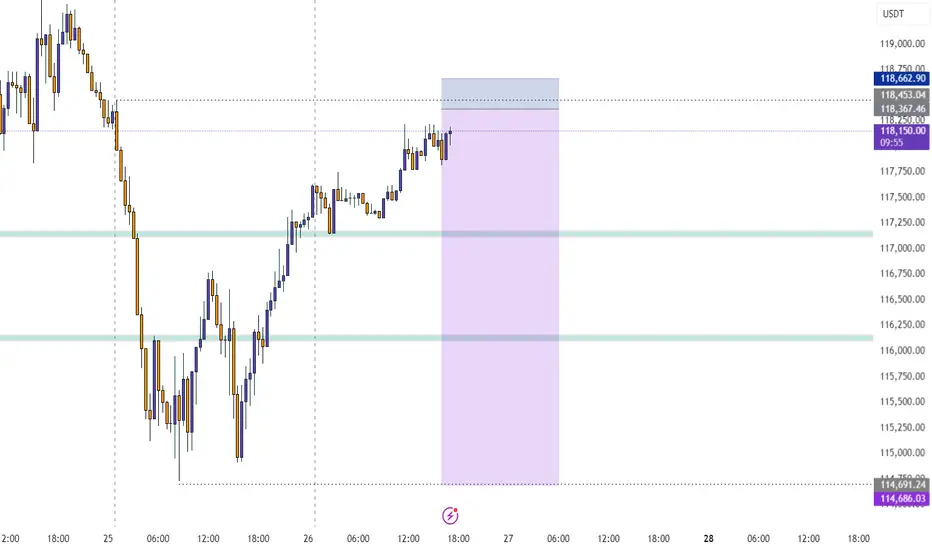
BTC/USDT Analysis. Range Breakout
Hello everyone! This is the daily analysis from a trader-analyst at CryptoRobotics.
Yesterday, Bitcoin bounced off a local sell zone on the 15-minute timeframe (previously mentioned), but a full-fledged bullish move did not follow. Instead, the less likely scenario played out — we broke the range to the downside and tested an important buy zone around ~$115,000 (zone of initiating volumes). Almost immediately, anomalies appeared in the cluster search near this level, and we quickly saw an initial rebound.
At the moment, a retest of ~$115,300 is likely. If buyers show proper reaction there, we could resume an upward move toward the $117,600–$119,200 area (accumulated volumes). To continue the long scenario toward the ATH, we need to consolidate within this area or break through it without a strong seller response — which is less likely.
A short scenario becomes possible if there is no buyer reaction around ~$115,300. In that case, a decline toward the next major support zone is expected.
Buy Zone:
$110,000–$107,000 (accumulated volumes)
Sell Zone:
$117,600–$119,200 (accumulated volumes)
This publication is not financial advice.
Bitcoin Btc usdt Daily analysis
Time frame daily
If btc can't break the green uptrend line strongly I guess it drops to 87$
But if btc can continue it's sharp way , my target is 170 $

Cutting-edge Tech, Outperforming Traditional Tools Until now my AI has been defying market odds
The forecasts work on all timeframes, short, medium or long range
My AI is outperforming traditional tools, in real time, thats right...with real time validation
The question is, will the crown remain intact or be dethroned??

bitcoin, Stay heavy on positionsbitcoin, Stay heavy on positions
Short-term overbought is noise. Focus on the bigger picture. Keeping my position heavy—no plans to reduce yet

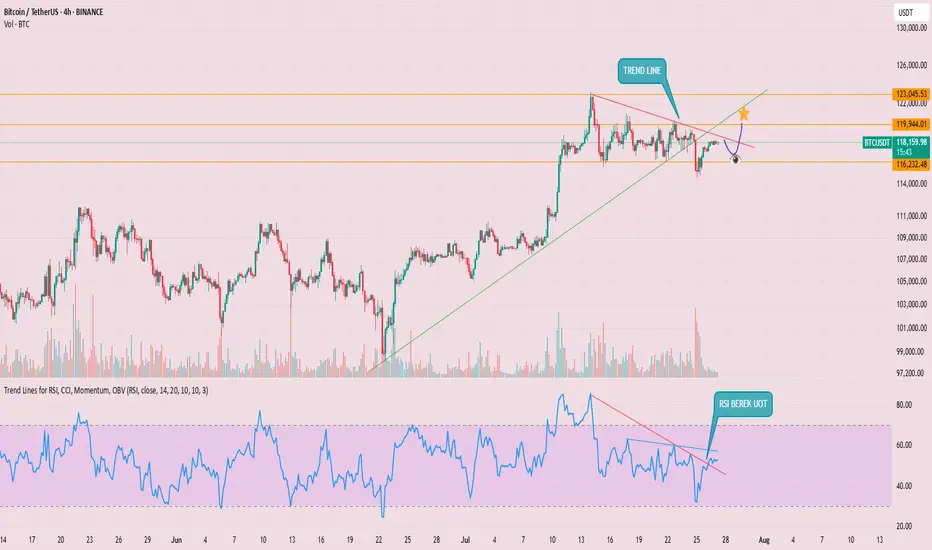
BTC is in a macro-uptrend but undergoing a healthy correction
Structure: BTC recently broke out from a local ascending wedge and is now pulling back toward support.
Current Price: ~$115,250 (at time of chart).
Day Support: ~117,000 (currently lost).
Next Key Support: ~109,244 (marked as WEEK RESIST, now potentially flipping to support).
Upside Target: 123,000 zone remains a key resistance, and aligns with projected measured move from wedge.
RSI: Just broke downward from overbought (divergence present). Currently ~59. A bearish signal in short-term momentum.
Williams %R: Deep in oversold, suggesting short-term bounce potential, but may be early.
200 SMA (blue): Holding well below current price — long-term uptrend remains intact.
Forecast Scenarios:
Base Case: BTC pulls back to 111K–109K, forms support, and continues the uptrend toward 123K.
Bullish Alt : If macro surprises (e.g., ETH ETF approval or FOMC dovish pivot), BTC reclaims 117K swiftly and rallies straight to 131K.
Bearish Risk: Break below 109K support, leading to retest of 98K (200 SMA area).

Btc 4hr time frame forward test3 possible scenarios,
Scenario 1 (Red): If it bounces at 1.272 and fails to break the previous high, a more bearish move is possible.
Scenario 2 (Green): This scenario involves a bounce at 1.272 and consolidation above the previous high.
Scenario 3 (Orange): This is a continuation of the bearish breakdown.
General Notes: All bounce points (indicated by the "yellow line") show a gap-up move (SMC entry area). TP3 is a good entry area, considering all confluences.

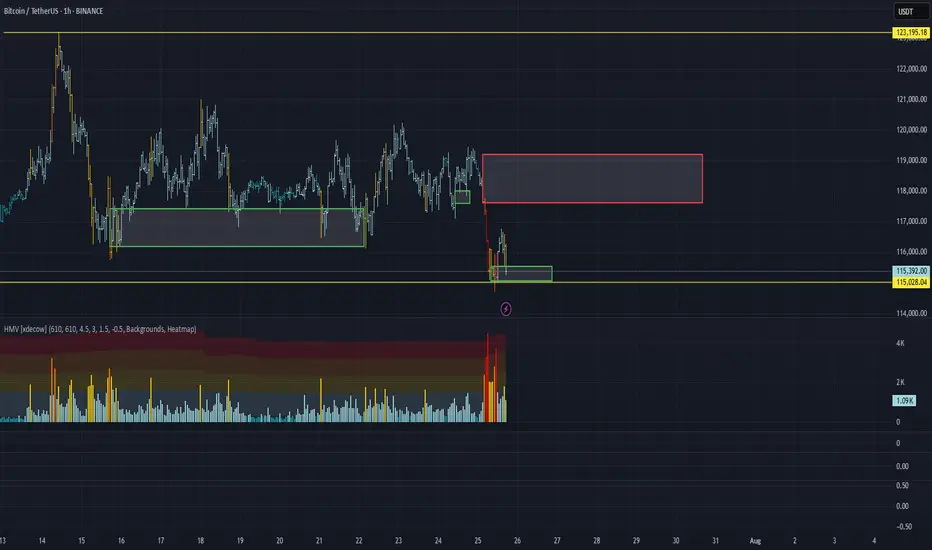
BTC-----Sell around 118000, target 116500 areaTechnical analysis of BTC contract on July 25:
Today, the large-cycle daily level closed with a small negative line yesterday, and the K-line pattern continued to fall. Although the price is at a high level, the attached indicator is dead cross. The current big trend is falling. From the overall trend and the trend law, the pullback is not strong. Instead of breaking the high, the decline is strong and continuous. Then the trend is also slowly changing. The key support position below is 115700 area, which is the position to pay attention to today and next week; the short-cycle hourly chart currently has a continuous negative K-line pattern, the price is below the moving average, and the attached indicator is dead cross. The continuation of the intraday decline is a high probability trend, and whether the European session can continue to break the previous low is the key. The current short-term resistance position is in the 118000 area.
Today's BTC short-term contract trading strategy:
Sell at the 118000 area of the pullback, stop loss at the 1118500 area, and target the 116500 area;

BTC - shake out!BTC Correction 📉
After observing the recent price action, it now seems clear that the inevitable correction is taking the stage.
I revisited the chart and drew potential bullish trendlines for a bull pennant on the 12h timeframe, but even those appear to be breaking down, confirming that we're currently experiencing a clear shakeout/correction.
I'm now expecting at least a full fill of the CME gap, and potentially even a drop toward $112,000.
Keep in mind that the CME price often lags behind spot prices on other exchanges, so in order to properly fill the gap down to $114,000 , a dip toward the $112,000 zone remains a very realistic scenario.
Take note that a lot of new retail investors are coming in recently by all the sounds of a ‘’possible altseason’’ around the corner, especially during the summer holidays when they have more time on their hands to look deeper into this.
all this in combination with a lot of long positions around and beneath the price range of 114k and 116k I expect a shake out and liquidity grab.
The only bullish short-term possibility that remains would be if this turns out to be a massive fakeout from the pennant structure, but I find that unlikely.
Personally, I’m watching for signs of a bottom sometime next week before looking for new upward momentum.
The BTC.D began a dive towards 60%, still: BTC remains dominant, which strongly impacts altcoins.
That’s why I’m currently staying cautious and holding off on entering new trades till we see clear support.
Let’s reach the summit together!
📝 Note
I'm currently building a portfolio of crypto analyses here on TradingView. Your feedback, tips, or validation are greatly appreciated, especially as I continue developing this skill further!


BTC / USDT : Broke down and now going for retestBitcoin Analysis:
Bitcoin has broken down and is now retesting the support zone. As mentioned earlier, a shakeout can happen at any time, and this looks like the potential retest phase.
Bullish Scenario:
Reclaims Resistance: If BTC manages to break through the resistance after the retest, it will stabilize for the short term. This could lead to a move towards higher levels.
Bearish Scenario:
Failure to Break Resistance: If the retest fails and BTC can't reclaim the resistance, further downside could be expected.
Targets: Keep an eye on the CME gap at $114,000 and 92K as key levels to watch for potential price action.
Note:
Manage your risk carefully. The market is volatile, and a shakeout could happen anytime. If BTC fails to break resistance after retest, more pain may be ahead.

Bitcoin possible bounce setupsThis is the only ideal long setups for bitcoin right now to keep bullish momentums
BTC SHORT IDEA114500 is TP1
113 is TP2
BTC is in Price Discovery Mode...
New ATH was created recently.
500M Shorts were Liquidated at 122k Region.
All the dips are healthy.

BITCOIN Indicates Consolidating Moves Before StronBitcoin (BTC) Market Analysis Report
Summary and Conclusion
Bitcoin (BTC) is currently trading around $117,000 to $118,000, showing a slight pullback from its recent all-time high near $123,000. The market sentiment is moderately bullish but cautious, with technical indicators signaling some overbought conditions and short-term consolidation. Institutional interest appears to be cooling off slightly, as evidenced by recent outflows from Bitcoin ETFs, while accumulation continues across various investor tiers, including whales and retail holders.
Key resistance is near $119,400-$120,000, and support lies around $117,200-$116,900. The market is in a "perfect accumulation" phase, with strong buying support despite some profit-taking. The Fear & Greed Index is at 70, indicating greed but not extreme euphoria.
Recent news highlights a mixed picture: Bitcoin remains dominant and stable, but altcoins are gaining some momentum. Institutional flows are shifting somewhat from Bitcoin to Ethereum and other altcoins. Experts predict potential for Bitcoin to reach $200,000 to $250,000 later this year, driven by macroeconomic factors like credit expansion and fiat inflation.
Detailed Analysis
1. Price and Market Data
Market Type Last Price (USD) 24h Change 24h High 24h Low 24h Volume (USD) Funding Rate (Contract)
Spot 116,959.8 -1.65% 119,498.4 116,946.6 1.43B N/A
Contract 116,962.7 -1.65% 119,492.9 116,935.5 8.91B 0.0001
Bitcoin is consolidating below $120,000 after reaching a peak of $123,218 on July 14.
Trading volume remains robust, indicating active market participation.
2. Technical Indicators
Bullish Signals: No strong bullish technical indicators currently detected.
Bearish Signals: RSI indicates overbought conditions, suggesting short-term caution.
Support and Resistance:
Resistance: ~$119,416.6
Support: ~$117,227.4
MACD and other momentum indicators show indecisiveness, implying possible sideways movement or minor corrections before the next major move.
3. Market Sentiment
Fear & Greed Index: 70 (Greed)
Investor sentiment is bullish but tempered by profit-taking and cautious positioning.
ETF flows show a recent reversal with $68 million outflows from Bitcoin ETFs, ending a 13-day inflow streak.
Ethereum and altcoins are attracting more inflows, signaling a rotation in institutional interest.
4. Recent News Highlights
Bitcoin remains dominant but has been mostly stagnant below $120K, while altcoins struggle for momentum.
Institutional investors are shifting some capital from Bitcoin to Ethereum and other altcoins.
Bitcoin is in a "perfect accumulation" phase, with all investor tiers building positions despite some whale transfers.
Experts like Arthur Hayes predict Bitcoin could reach $250,000 by year-end, driven by credit expansion and macroeconomic factors.
Network activity shows a slight dip in active addresses, indicating a short-term pause.
Support levels around $116,952 and $114,354 are critical to watch for downside risk.
Bitcoin's dominance remains strong at around 61%.
5. Outlook
Short-term: Bitcoin may continue to consolidate between $117,000 and $120,000, with potential minor pullbacks due to overbought RSI.
Medium to Long-term: Positive macro factors and accumulation trends suggest potential for new highs, possibly targeting $150,000 to $250,000.
Watch for a breakout above $120,000 to confirm bullish momentum continuation.
Monitor ETF flows and on-chain activity for signs of renewed institutional interest or caution.
Recommendations for Traders and Investors
Traders: Consider cautious trading around current levels, watching for RSI and MACD signals for entry/exit points. Be mindful of resistance near $120,000.
Investors: Accumulation phase suggests good opportunities for long-term holding, especially if Bitcoin holds above $117,000.
Risk Management: Keep stop-loss orders near support levels to mitigate downside risk in case of a correction.
