BTC 4H Structure Break – Long Bias with Conditions🚀 BTC (Bitcoin) has clearly broken bullish market structure on the 4-hour timeframe.
📈 My bias is to ride the momentum and look for a pullback to enter long.
✅ I follow a specific entry criteria — price must pull back into the imbalance, find support, and then form a bullish break of structure on a 15m chart to trigger an entry.
❌ If that setup doesn't play out, we simply abandon the idea.
⚠️ This is not financial advice.
USDTBTC trade ideas

BTC - Consolidation, Manipulation & DistributionMarket Context
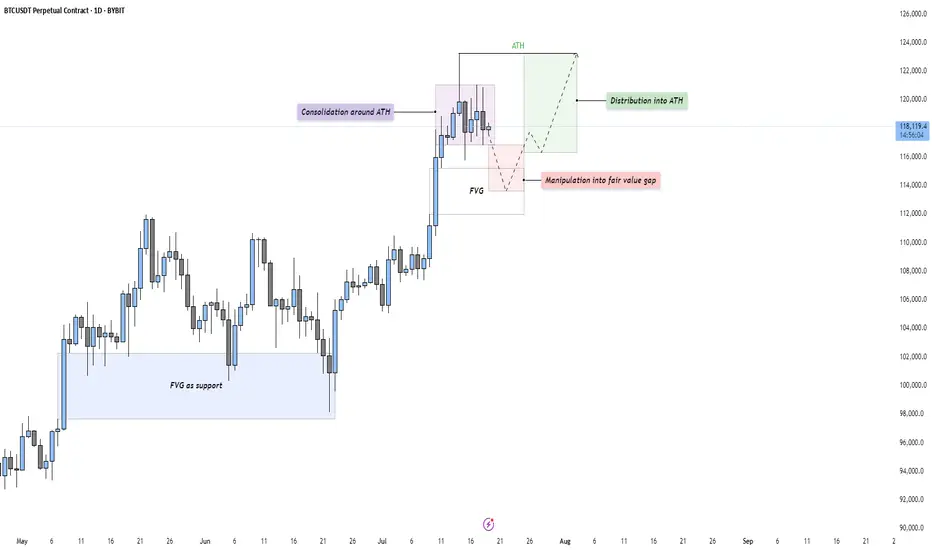
After a strong impulsive rally, Bitcoin is currently consolidating just beneath its All-Time High (ATH). This type of consolidation following an extended move higher often indicates indecision in the market — a pause that either leads to continuation or reversal. The current structure suggests that price is building energy for the next leg.
Consolidation and Liquidity Above ATH
The price action is tight and sideways around the ATH, which likely means liquidity is building above. Many stop-losses and breakout orders are sitting just overhead — classic conditions for a Buy Side Liquidity Sweep. This range may serve as a trap for early breakout traders, providing an opportunity for smart money to manipulate price lower before taking it higher.
Fair Value Gap Retest Scenario
Below the current range, we see a Daily Fair Value Gap that aligns with prior bullish imbalances. A move down into this Gap would represent a manipulation phase — shaking out weak longs before rebounding. The Gap also acts as a potential support level where buyers might be waiting. If price reaches into this zone and reacts strongly, it may offer a high-probability long setup.
Distribution or Reaccumulation?
While this could be interpreted as distribution beneath resistance, it’s equally valid to consider it a reaccumulation phase — a temporary markdown into demand before a fresh expansion. If the market dips into the Gap and quickly reclaims the range, it opens the door for a clean breakout above the ATH and continuation toward the 124,000–126,000 region.
Final Thoughts
Price rarely moves in a straight line. It pauses, retraces, and often tricks participants before making the real move. This type of consolidation presents opportunity — but also demands patience and clarity.
If you found this breakdown insightful, a like would be much appreciated! And I’d love to hear your thoughts in the comments — are we about to sweep down into demand, or is the rocket already on the launchpad?
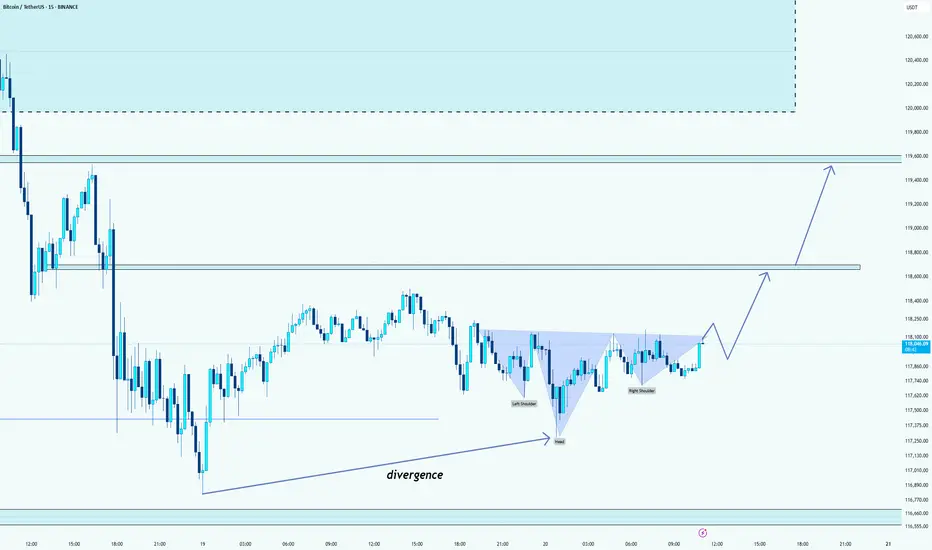
BTC: a Head and shoulders patternHello guys!
As you can see, a Head and shoulders and a divergence formed!
We can expect the price to rise until those two levels that I pointed out!
If the neckline breakout gets a long in retracements!
BTCUSDT - UniverseMetta - Signal#BTCUSDT - UniverseMetta - Signal
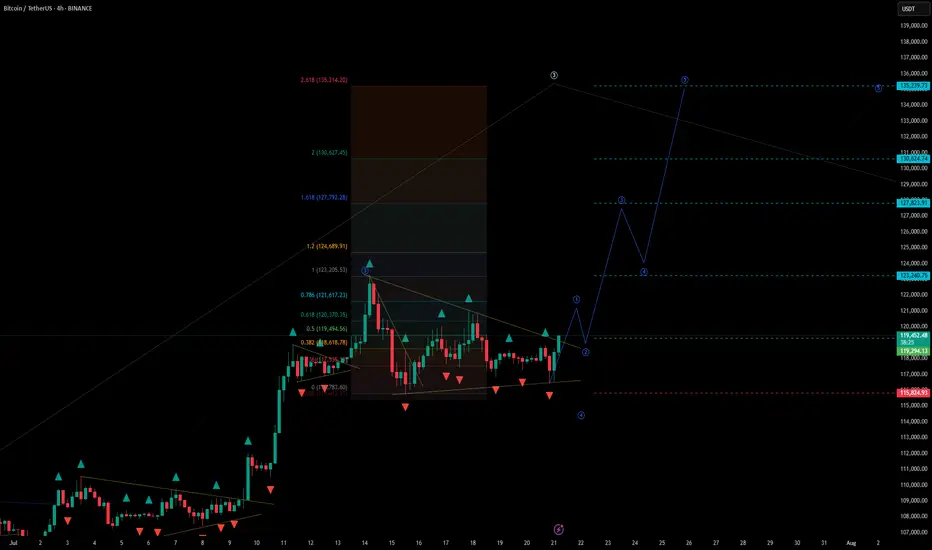
H4 - Formation of a triangular formation in continuation of the trend, for a more confident entry you can wait for a retest and formation of the 3rd wave. Stop behind the minimum of the 1st wave.
Entry: 119294.13
TP: 123240.75 - 127823.91 - 130624.74 - 135239.73
Stop: 115824.93
BTC/USDT – Fibonacci Levels in PlayMEXC:BTCUSDT.P
🔹 Price pushing through key resistance zones
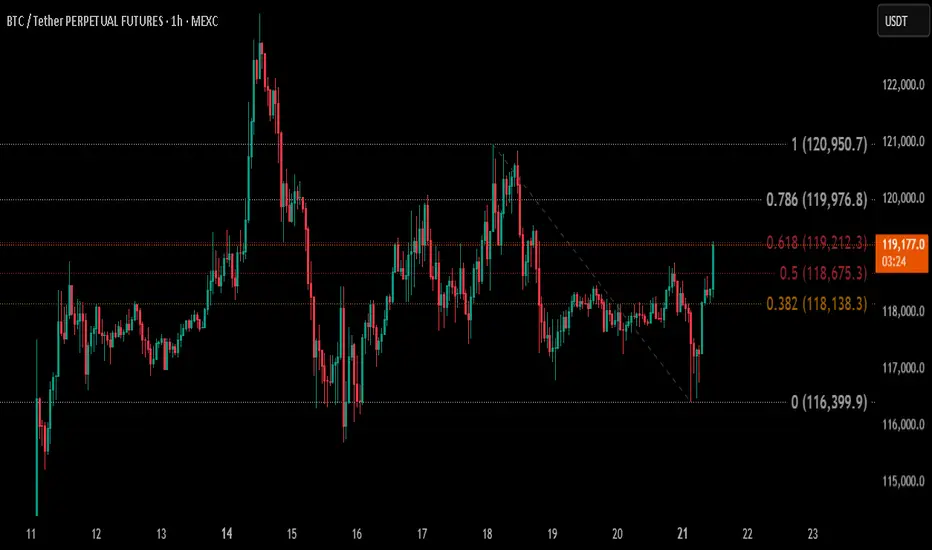
BTC just tapped the 0.618 Fibonacci level (119,212) after breaking above 0.5 — signaling strength in short-term momentum. If bulls can hold above this level, the next logical targets are:
➡️ TP1: 119,976 (0.786)
➡️ TP2: 120,950 (Full retracement)
🔸 Key Support: 118,675
🔸 Invalidation below: 118,500
Holding above the golden zone (0.618) increases the probability for a full move toward 121K. Watching price reaction closely here — breakout or rejection will decide the next leg.
🔄 Keep supporting by sharing and dropping your thoughts!
🚀 And don’t forget to hit that Boost button – it helps and motivates me to keep bringing top-level analysis for you all 🙌
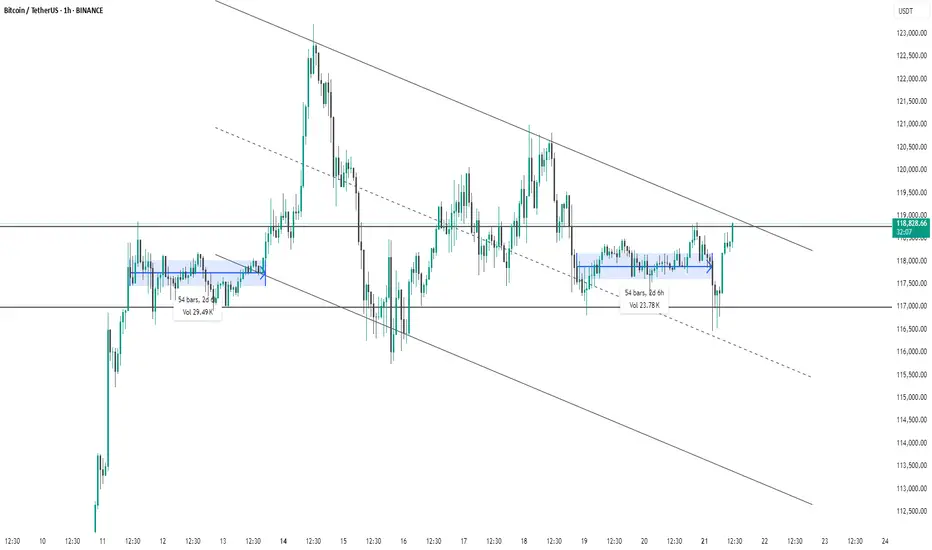
BTC #1-hour chart of Bitcoin/USDTThis 1-hour chart of Bitcoin/USDT (Binance) shows a descending channel pattern with clearly defined upper and lower trendlines. Price has recently broken out of a consolidation zone (highlighted in blue) and is now testing the upper boundary of the descending channel near $119,000. The breakout from the recent range (lasting 54 bars / 2d 6h with 23.78K volume) suggests bullish momentum. However, for confirmation of trend reversal, a strong breakout above the channel is needed. Until then, the broader downtrend structure remains intact.
thanking you
#BTC Update #8 – July 21, 2025#BTC Update #8 – July 21, 2025
Bitcoin isn’t moving in a textbook symmetrical triangle, but it’s trading in a similar, tight range, mostly bouncing around the highlighted box area in the chart. It’s attempting a new impulsive leg, but $120,000 remains a key resistance level, having rejected price several times already.
As long as $116,500 holds, there's no major risk for Long bias. However, considering the triangle-like structure, the short-term upside is limited to about 2% for now.
A breakout above the upper edge of this structure, particularly if $123,200 is broken with strong volume — would justify a Long position. Until then, I don’t plan on entering any trades.
The last corrective move has completed, and my next major upside target is $127,900. If further correction occurs, watch for potential support around $115,000, $113,000, and the strong base at $112,000 — though I don’t expect price to fall that low.

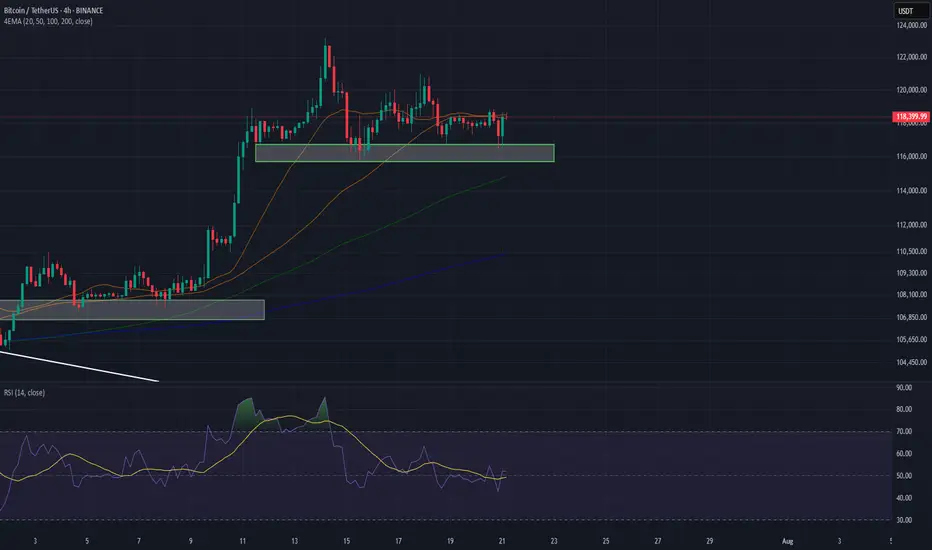
Bitcoin Technical AnalysisBTC made a recorded high of 123,218$ on Monday, and made a correction to 116k$ and keep consolidate in the range of 116k$-120k$, at the time of writing this bitcoin is currently trading at 118,224k$.
116k$-117k$ reacting as a strong support zone, if BTC breakdown this support zone the next target of bears is 112k$-110k$.
The Relative Strength Index (RSI) on the daily chart currently reads 64, having declined from last week's overbought level of 70. This suggests a cooling in bullish momentum, potentially signaling a pause or reversal in the recent upward trend.
Meanwhile, the Moving Average Convergence Divergence (MACD) is on the verge of forming a bearish crossover on the daily chart. If confirmed, this crossover would act as a sell signal, reinforcing the view of emerging bearish momentum.
However, if BTC closes above the $120,000 on a daily basis, it could extend the recovery toward the fresh all-time high at $123,218 and beyond.
BTCUSDT It’s coming soon in 2 or 4 weeksRegardless of the positive comments coming from various media and news, the market flow is already moving as it has been set.
After 2 to 4 weeks, a strong and rapid crash comes.
Nasdaq and S&P also fall together.
GOOD LUCK!!
The stock market is highly volatile. Please be very careful with your investments.

BITCOIN Possible trade ideaHere is the graph of a possible BTC trading idea.
BTC is currently consolidating in a triangle with a possible breakdown after reaching ATH.

BTC ~ 125K when?BTC made this strong hold the green box, Please keep in mind this if it holds, goes straight up and we plan shorts on the top as scalps!

#Bitcoin LTF update #Bitcoin LTF update
After making a high of $123,300, it dropped a bit and made short-term support at $117,000, and currently it is holding at this level.
But it is not strong enough to hold, we will retest the lower level.
IMO, we can see a retest up to $113,000 level approximately.
Where we have 0.382 golden fibre level, which is also aligning with some more important indicators, and most importantly, we have good numbers of liquidation at that level.
If you find my updates helpful, don’t forget to like and follow for more!
DYOR, NFA

Support around 115854.56-116868.0 is the key
Hello, traders.
If you "Follow", you can always get the latest information quickly.
Have a nice day today.
-------------------------------------
(BTCUSDT 1D chart)
The DOM(60) indicator of the 1W chart is generated at the 119177.56 point, and the DOM(60) indicator of the 1D chart is generated at the 119086.64 point, and then shows a downward trend.
However, since the HA-High indicator is formed at the 115854.56 point, it is difficult to say that it has yet turned into a downward trend.
Accordingly, it is necessary to check whether it is supported in the HA-High ~ DOM(60) section.
The next volatility period is expected to occur around July 25 (July 24-26).
However, the important volatility period is expected to be around August 2-5 (maximum August 1-6), so we need to look at what kind of movement it shows as it passes through the volatility period that will occur in the future.
-
Since the StochRSI indicator has entered the oversold zone, there is a possibility that the decline will be restricted.
Therefore, the key is whether there is support around 115854.56-116868.0.
This is because if it falls below the HA-High indicator, there is a possibility that a downtrend will begin.
Also, since the M-Signal indicator on the 1D chart is rising around 115854.56, it can be seen as an important zone.
--------------------------------------------------
An indicator called Trend Check has been added to the OBV indicator.
This indicator is an indicator that comprehensively evaluates the StochRSI, PVT-MACD oscillator, and OBV indicators and expresses them in a column.
Accordingly, if the TC indicator rises from the 0 point, it can be interpreted that the buying force is dominant, and if it falls, the selling force is dominant.
Therefore, if it rises above 0, it is likely to show an upward trend, and if it falls below 0, it is likely to show a downward trend.
Also, if the TC indicator touches the highest point (6) or lowest point (-6), there is a high possibility that the trend will reverse, so you should think about a response plan for this.
-
Thank you for reading to the end.
I hope you have a successful trade.
--------------------------------------------------
- Here is an explanation of the big picture.
(3-year bull market, 1-year bear market pattern)
I will explain the details again when the bear market starts.
------------------------------------------------------

Local Top Confirmed, Short-Term Bearish Pressure BuildingBTC/USDT 1H – Local Top Confirmed, Short-Term Bearish Pressure Building
📍 Timeframe: 1 Hour
📍 Exchange: MEXC
📍 Pair: BTC/USDT
📍 Bias: Short-term bearish, watching for support re-test near 116k
Market Context:
BTC broke out aggressively earlier in the week, pushing above the 120k psychological level before forming a local top near 122k. Since then, we’ve seen:
A strong rejection wick at the top
Lower highs forming
A bearish engulfing candle marking the shift in momentum
Technical Observations:
Bearish Signs:
MACD histogram rolling over, showing fading bullish momentum
QQE MOD flipping red, indicating a shift toward bearish control
RSI crossing below 50 and trending downward — loss of bullish strength
A clean rejection off recent highs, creating a double top feel
Volume on the recent sell candle is higher than average, suggesting strength in the move down
Support Zones to Watch:
116.5k: Prior breakout zone and most recent demand zone
114.8k – 115.2k: Volume consolidation area; if broken, may invite sharper downside
112k: Key structure zone from previous sideways range
Potential Scenarios:
Bearish Continuation (more likely short term):
Break below 116.5k could lead to fast drop to 114.8k support
RSI and MACD momentum align with this move
Look for breakdown confirmation with volume spike + close under structure
Bullish Reversal (less likely unless invalidation):
Hold above 116.5k + reclaim of 118.2k with strength
RSI must turn up above 50 and MACD histogram flip blue
Could target re-test of 120k–121k if bullish momentum returns
Trading Approach:
Short-term traders may look for pullbacks to short under 118k with 116.5k as the first target
Swing traders should be cautious and wait for confirmation at 116k–115k zone before considering long re-entries
Avoid chasing breakouts — let the market confirm direction first
Conclusion:
BTC on the 1H chart shows signs of exhaustion after a strong run. The market is leaning toward a correction phase. Watch the key support levels — they will dictate whether this is a short-term dip or the start of a deeper move.

Bitcoin Technical Setup: Support Holds, Eyes on $118,600Bitcoin ( BINANCE:BTCUSDT ) moved as I expected in the previous ideas and finally completed the CME Gap($117,255-$116,675) in the last hours of the week. ( First Idea _ Second Idea )
Before starting today's analysis, it is important to note that trading volume is generally low on Saturday and Sunday , and we may not see a big move and Bitcoin will move in the range of $121,000 to $115,000 ( in the best case scenario and if no special news comes ).
Bitcoin is currently trading near the Support zone($116,900-$115,730) , Cumulative Long Liquidation Leverage($116,881-$115,468) , Potential Reversal Zone(PRZ) , and Support lines .
According to Elliott Wave theory , Bitcoin had a temporary pump after the " GENIUS stablecoin bill clears House and heads to Trump's desk " news, but then started to fall again, confirming the end of the Zigzag Correction(ABC/5-3-5) . Now we have to wait for the next 5 down waves or the corrective waves will be complicated .
I expect Bitcoin to rebound from the existing supports and rise to at least $118,600 . The second target could be the Resistance lines .
Do you think Bitcoin will fill the CME Gap($115,060-$114,947) in this price drop?
Cumulative Short Liquidation Leverage: $121,519-$119,941
Do you think Bitcoin can create a new ATH again?
Note: Stop Loss(SL)= $114,700
Please respect each other's ideas and express them politely if you agree or disagree.
Bitcoin Analyze (BTCUSDT), 15-minute time frame.
Be sure to follow the updated ideas.
Do not forget to put a Stop loss for your positions (For every position you want to open).
Please follow your strategy and updates; this is just my Idea, and I will gladly see your ideas in this post.
Please do not forget the ✅' like '✅ button 🙏😊 & Share it with your friends; thanks, and Trade safe.

Game Over. Bear market incomingYou can hate all you want. Historically I'm right. Bull run ends in July.
Save this and come back to it.

**BTC/USDT Monthly Analysis: Navigating Key Resistance****Overview:**
On the monthly timeframe, Bitcoin (BTC) is exhibiting significant strength as it approaches a pivotal historical resistance zone. This multi-year resistance, ranging approximately from **$115,000 to $120,000**, represents a critical inflection point for the asset.
**Key Observations:**
1. **Historical Resistance Test:** The current price action sees BTC challenging a formidable resistance level that has previously acted as a major ceiling. A decisive breakout above this zone, supported by strong volume, would signal a continuation of the bullish trend towards new all-time highs.
2. **RSI Bearish Divergence:** A notable observation on the Monthly Relative Strength Index (RSI) is the presence of **bearish divergence**. While price has made higher highs, the RSI has printed lower highs, indicating a potential weakening in bullish momentum. This divergence suggests that the current upward move might be losing steam and could precede a healthy price correction or consolidation phase. This is a crucial cautionary signal for long-term holders and potential new entrants.
**Outlook:**
The bullish macro trend for Bitcoin remains intact, yet the confluence of strong historical resistance and a developing bearish divergence on the monthly RSI warrants caution. Traders should closely monitor for a clear break and sustained close above the $120,000 level to confirm further upside. Conversely, a rejection from this resistance zone could lead to a significant retracement to key support levels.
**Disclaimer:** This analysis is for informational purposes only and does not constitute financial advice. Always conduct your own research and manage your risk appropriately.
**M. Kiani**
```ش

BTC Weekly Recap & Outlook 20/07/2025📈 BTC Weekly Recap & Outlook
Market Context:
Price continued its bullish momentum, fueled by institutional demand and supportive U.S. policy outlook.
We captured solid profits by following the game plan I shared earlier (see linked chart below).
🔍 Technical Analysis
✅ BTC made a strong bullish move, breaking into new all-time highs.
📊 The daily RSI entered overbought territory, which signaled the potential for a short-term retracement or consolidation.
Currently, price is ranging, and RSI is cooling off. That tells me the market is likely building energy for the next leg up — but not before a significant liquidity run.
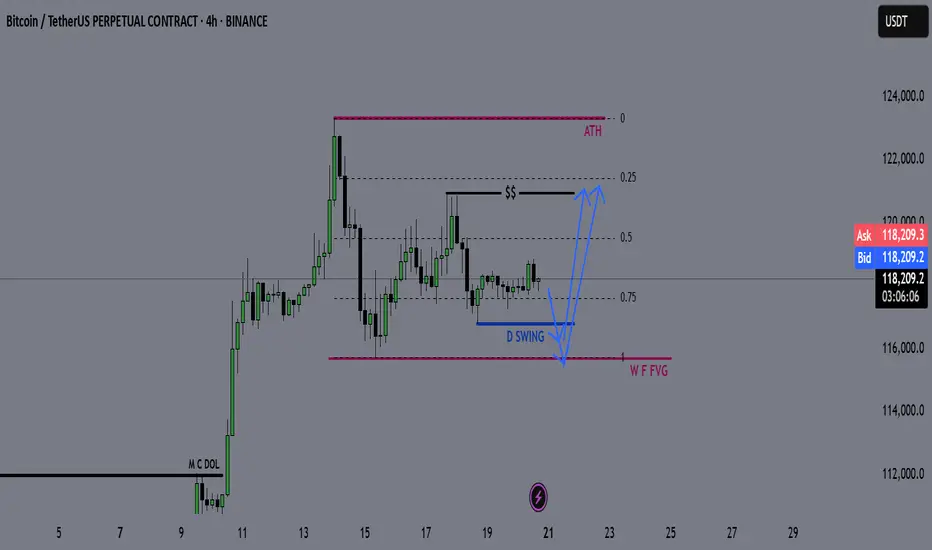
🎯 Game Plan
I'm watching for one of two potential setups:
1️⃣ Liquidity Sweep to the Downside
- A run of the daily swing low
- Into the most discounted range (0.75 Fib zone)
OR
2️⃣ Tap into the Weekly FVG Zone (marked with the purple line)
Either move would create the liquidity and energy needed to fuel a breakout above the equal highs (EQHs) marked by the black line.
🚀 Target
First Target: EQHs (Black Line)
Second Target: Price Discovery (new ATHs)
💬 Let me know your thoughts or drop your own chart ideas below!
📌 Follow for Weekly Recaps & Game Plans
If you found this useful, make sure to follow for weekly BTC updates, market outlooks, and detailed trade plans based on structure and liquidity.
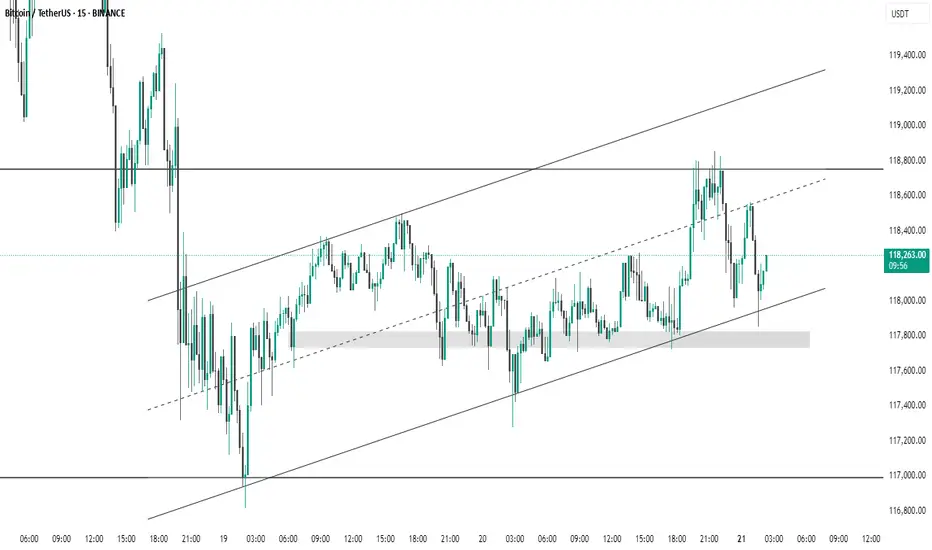
BTC #15-minute BTC/USDT chart This 15-minute BTC/USDT chart from Binance shows Bitcoin trading within an ascending channel. Price recently bounced off the lower trendline and a highlighted demand zone around 117,800 USDT, suggesting strong support. The upper channel and resistance near 118,800 USDT may act as potential targets. Short-term momentum appears bullish as long as price holds above the support trendline.
BTCUSDTBTCUSDT Updated in H1 :
The gold signal is marked on the chart based on the latest price changes and the supply and demand in the market. These points include the entry point, stop loss, and take profit

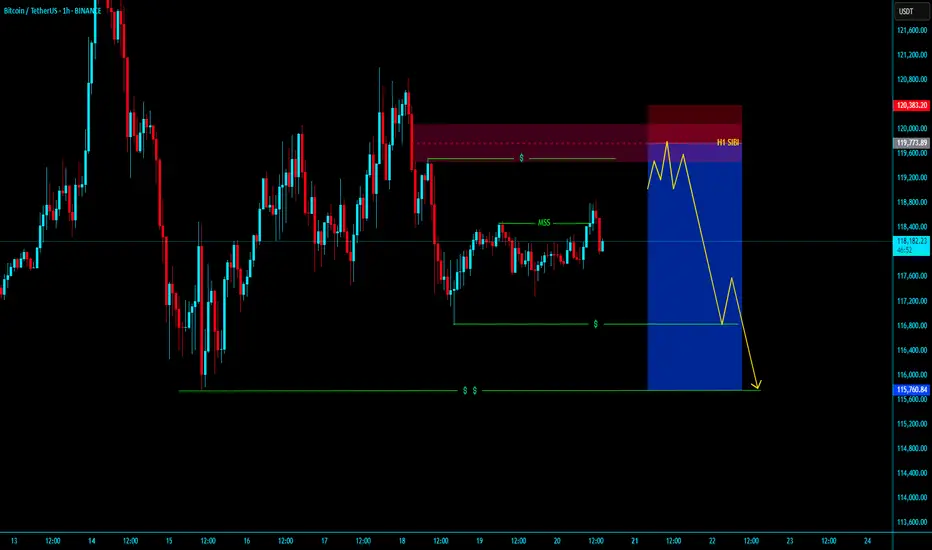
BTCUSDT BEARISH H1 SIBI SELL SHOTBTCUSDT BEARISH H1 SIBI SELL SHOT
Market is Bullesh Right now market is going to h1 sibi in LTF with valid mss with valid obi
entyr with tight sl and Target is our nearest Liquidity .....enjoyyyyyyyyyyy
KGB Priyabrat Behera
ICT Trader & Advance Mapping SMC Trader
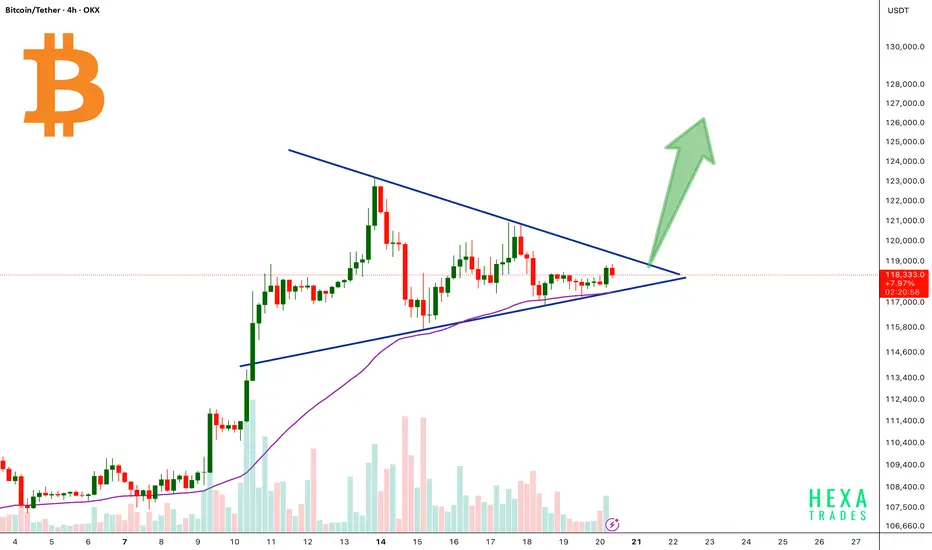
BTC Forming Bullish Triangle!Bitcoin is currently consolidating inside a symmetrical triangle pattern after a strong bullish rally. The price is approaching the apex of the triangle, signaling a potential breakout soon.
The 50 EMA is acting as dynamic support, perfectly aligned with the triangle’s lower trendline, reinforcing the bullish structure.
A confirmed breakout above the triangle resistance could trigger a strong upward move, with a potential target near the $125,000–$130,000 zone.
Cheers
Hexa
BINANCE:BTCUSDT CRYPTOCAP:BTC
Bitcoin Price Could test resistance 120K After DeclineBitcoin is consolidating within a range — not showing strong directional momentum yet — and is testing the resistance zone between 120K and 121K.
This is a critical supply zone, where buyers were previously liquidated. It’s a psychological level and might trigger profit-taking or heavy resistance from sellers. If BTC fails to break and hold above the 121K zone, there’s a high probability of a pullback toward the 116.2K–117K area to grab liquidity before a new move.
Former President Donald Trump signing new crypto laws could introduce market-moving fundamentals. However, the impact on price will depend on the content of those regulations:
You may find more details in the chart Ps Support with like and comments for better work.
