How I Analyze Any Coin in 60 Seconds: 4-Step Masterclass!Heyy traders, it’s Skeptic from Skeptic Lab! 🩵 I’m breaking down my lightning-fast method to analyze any coin in just 60 seconds . This 4-step process is how I spot long/short triggers like a pro. Buckle up, let’s dive in:
✔️ Step 1: Identify HWC/MWC/LWC (10 seconds)
Nature’s got a cool vibe—bet a lot of you hit the outdoors on weekends. When I see an apple tree from afar, it’s majestic, but up close, I spot branches and worm-eaten fruit. From a distance, I miss the details; up close, I lose the tree’s grandeur. Markets work the same. You need different timeframes to grasp the market structure. With practice in Dow Theory, trends, and tools, spotting HWC (Higher Wave Cycle), MWC (Mid Wave Cycle), and LWC (Lower Wave Cycle) becomes second nature. For me, this takes 10 seconds.
Want a full HWC/MWC/LWC guide? Check my free article I wrote a while back—it’s a hands-on tutorial ( link Cycle Mastery ).
📊 Step 2: Draw Support/Resistance Lines (20–30 seconds)
I start with higher timeframes: Monthly, then Weekly, then Daily. Once I’ve drawn lines up to Daily, I don’t always redraw for lower timeframes—often, I just adjust them.
Pro tip : Give more weight to the right side of the (recent data) since it’s fresher and more valuable. I change line colors for 4-hour lines, so I know they’re less critical than Daily. I don’t draw lines below 4-hour, but if you’re a scalper, tweak this to your strategy. This step takes me 20–30 seconds, the longest part.
📉 Step 3: Analyze Candles, Volume, Oscillators, and Indicators (10–15 seconds)
Here, I check everything I can: candles, volume, oscillators, and indicators . The goal? Stack confirmations for my triggers. Think RSI hitting overbought, volume spikes, larger candle sizes, or momentum surges—you get the vibe. This step’s length depends on your tool mastery. For me, it’s quick because I know what to look for.
🔔 Step 4: Check Coin Dominance (5–10 seconds)
This is the most critical yet simplest step. We need to track where liquidity’s flowing . For example, if SOL/BTC is bearish, I skip buying Solana—liquidity’s exiting. BTC.D (Bitcoin Dominance) is also key. The relationships dominance creates are complex and don’t fit in one analysis, but if you want a full dominance tutorial, drop it in the comments!
🔼 Key Takeaway: Using these 4 steps—HWC/MWC/LWC, support/resistance, candles/indicators, and dominance—I analyze any coin in 60 seconds. Your speed depends on experience and knowledge. If you’re new, this might take 60 minutes per coin, but don’t sweat it— practice makes you lightning-fast . Thanks for vibing with this educational idea! <3 I’ll catch you in the next one—good luck, fam!
💬 Let’s Talk!
Want a dominance tutorial or more tips? Hit the comments, and let’s crush it together! 😊 If this guide lit your fire, smash that boost—it fuels my mission! ✌️
USDTBTC trade ideas
BTCUSDT: Good Opportunity to buy Bitcoin has dropped sharply since NFP data came out. We can now see price reversing nicely from 109k area.

BITCOIN BTCUSDT BUYING SETUPBitcoin is currently showing bullish momentum after a clear market structure (MS) shift. The price has formed a bullish reversal and is now retracing after a short-term rally.
We expect BTCUSDT to pull back into the highlighted demand zone (green area), which aligns with previous structure and volume support. If the price taps this zone and shows bullish confirmation, it could present a high-probability buy entry for the next upward leg.
📌 Trade Plan:
✅ Wait for price to enter the green zone
✅ Look for bullish price action or volume confirmation
✅ Target higher highs if support holds
Always manage your risk properly and wait for clear confirmation!

BTC/USD) bullish trend analysis Read The captionSMC Trading point update
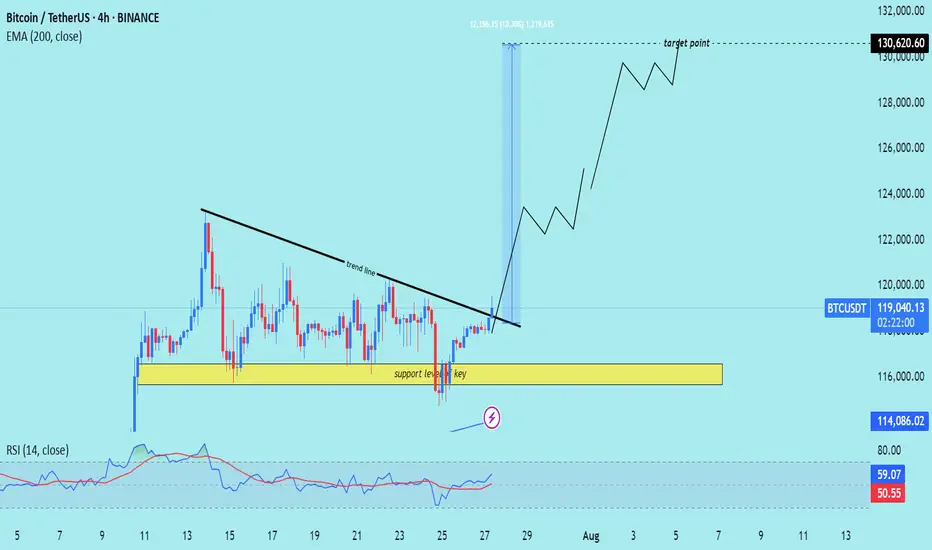
Technical analysis of Bitcoin (BTC/USDT) on the 4-hour timeframe, indicating a potential rally toward the $130,620.60 target zone. Here's the detailed breakdown:
---
Technical Analysis – BTC/USDT (4H)
1. Key Support Level Holding
The yellow zone highlights a strong support zone around $116,000, which has been tested multiple times without breaking.
Marked as “key support level,” it has acted as the foundation for a bullish reversal.
2. Trendline Breakout
A descending trendline was broken decisively with strong bullish candles, signaling a trend reversal.
The breakout was followed by increased momentum and volume, supporting the move higher.
3. Target Projection
The chart shows a projected move up to $130,620.60, labeled as the target point.
This target aligns with a measured move or prior resistance, suggesting a potential swing high objective.
4. 200 EMA Support
Price is well above the 200 EMA (at $114,088.52), confirming the uptrend and acting as dynamic support.
5. RSI Confirmation
RSI is at 60.62, reflecting bullish strength with more room before reaching overbought levels.
Momentum supports the continuation of the uptrend.
Mr SMC Trading point
---
Summary
Bias: Strong Bullish
Current Price: $119,291.13
Support Zone: $116,000 (key area)
Trendline: Broken with bullish confirmation
EMA 200: Acting as solid dynamic support ($114,088.52)
Target Zone: $130,620.60
RSI: 60.62 – bullish with upside potential
---
Please support boost 🚀 this analysis)
btcThis is not a signal.
Just my outlook on BTC based on data
No fluff
No fancy indicators
And definetly no rectangles
Just watch and see how it plays out, as we are currently in a big indecision zone as well as the weekend I would not enter any positions now but rather wait for monday-wednesday to enter.

The Final PushNot long ago Terry started a journey. He led with faith and a determined spirit. Now the time has come for the end. Fortunes were made and fortunes were lost. The end must come so..........
That his new journey may begin,
Thanks for the adventure cant wait to see what is next.
Lingrid | BTCUSD Consolidation PHASE ContinuesBINANCE:BTCUSDT is bouncing from the confluence of an upward trendline and the $112,175 support level, forming a higher low structure. Price remains within an upward channel, with the current pullback holding above key structural support. As long as the higher low remains intact and price stays above $112,175, a continuation toward $120,500 is likely. Momentum appears to be rebuilding within the bullish framework after a period of consolidation.
📉 Key Levels
Buy trigger: Break and hold above $114,680
Buy zone: $111,500 – $112,500
Target: $120,500
Invalidation: Break below $111,000
💡 Risks
Failure to hold the trendline could trigger deeper downside
Resistance at $114,680 may reject early attempts to move higher
Market may stay range-bound if volume remains low
If this idea resonates with you or you have your own opinion, traders, hit the comments. I’m excited to read your thoughts!

TradeCityPro | Bitcoin Daily Analysis #141👋 Welcome to TradeCity Pro!
Let’s dive into Bitcoin analysis. Yesterday, the exact bearish scenario I told you about happened. Let’s see what opportunities the market is offering us today.
⏳ 4-Hour Timeframe
Yesterday, I mentioned that the price had tested the 116829 zone too many times and that this area had become very weak. I also said that if the price made a lower high than 120041, deeper corrections would be likely.
✔️ Another perspective I have on the market is that sometimes certain support and resistance levels simply aren’t strong enough to continue the trend.
🔑 For example, in this case — despite Bitcoin being in an uptrend across all cycles — the 116829 support couldn’t hold, and the price broke it to reach a stronger support zone, one that might be capable of continuing the trend.
📊 Right now, this is what might be happening again. Support levels like 0.5, 0.618, and 0.786 Fibonacci retracement zones could be where the next bullish leg begins.
✅ At the moment, price has reached the 0.5 Fibonacci level, and the previous strong bearish momentum has slightly weakened. If you look at the volume, momentum is still in favor of sellers, but based on the long lower wicks on the candles, we can say the bearish trend is showing signs of weakness.
💥 On the other hand, RSI is approaching 30, and in an uptrend, when RSI nears the Oversold zone, it can often be a good entry point for a long. However, we’re not acting on this yet — we’ll wait for more confirmations before opening any positions.
⭐ For now, there’s no trigger for a long position on this timeframe. A break below 115000 could act as a short trigger, but given the trend Bitcoin is in, I’m not opening any short positions at the moment.
⏳ 1-Hour Timeframe
The price has dropped down to 114560, and I believe today we might enter a corrective phase. However, if the price stabilizes below 114560, the correction could continue. The next targets would be the Fibonacci levels from the 4-hour timeframe.
🔽 I won’t open a short position with the break of 114560, and I suggest you don’t take that short either.
📈 If this move turns out to be a fakeout, the first trigger we have now is at 118736, which is quite far from the current price. For this trigger to activate, we’d need to see a V-pattern form.
🔍 There are no other triggers right now. But if more range structure forms, we might consider opening a risky long on the breakout of the range top.
❌ Disclaimer ❌
Trading futures is highly risky and dangerous. If you're not an expert, these triggers may not be suitable for you. You should first learn risk and capital management. You can also use the educational content from this channel.
Finally, these triggers reflect my personal opinions on price action, and the market may move completely against this analysis. So, do your own research before opening any position.

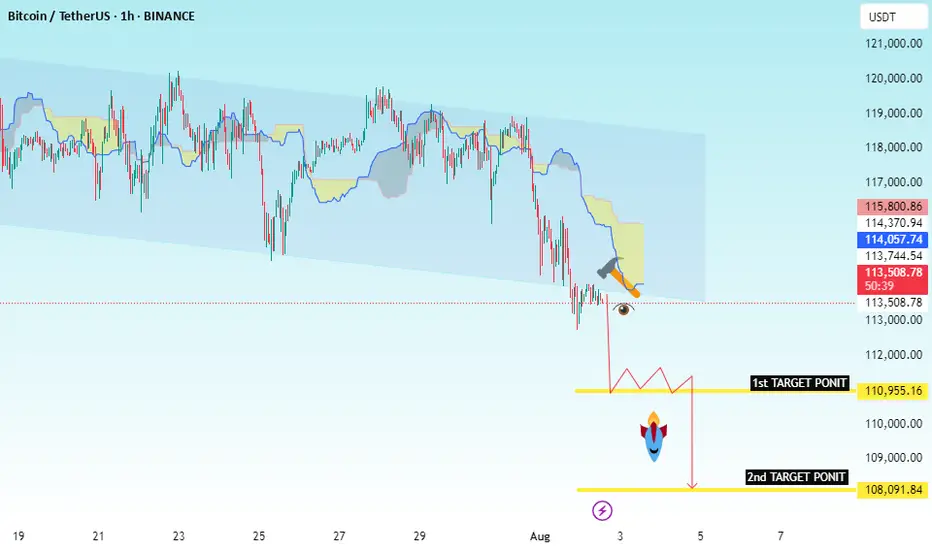
BTC/USDT Bearish Continuation SetupChart Identification:
Timeframe: Likely 1H or 4H
Pair: BTC/USDT
Indicators: Ichimoku Cloud
Pattern: Price broke down from cloud resistance and is retesting previous support
Setup: Bearish continuation with consolidation before next leg down
---
✅ Trade Setup (Sell):
🔹 Entry Point:
Sell Entry: Below 113,500.84
This level marks the neckline of a small consolidation zone.
Wait for clean candle close below this level.
---
🎯 Target Levels (Take Profit):
1. TP1: 110,955.16
Previous minor support
2. TP2: 108,091.84
Key support/demand area
---
🧠 Optional Confirmation:
You can wait for:
Bearish candlestick pattern at 112.1K zone
Rejection of retest near 113.7K–114.3K (top of cloud)
---
📌 Summary:
> BTC/USDT Short Setup
🟢 Entry: Below 113,500.84
🎯 Target 1: 110,955.16
🎯 Target 2: 108,091.84
Bearish bias as price remains below the Ichimoku cloud and shows signs of continuation.
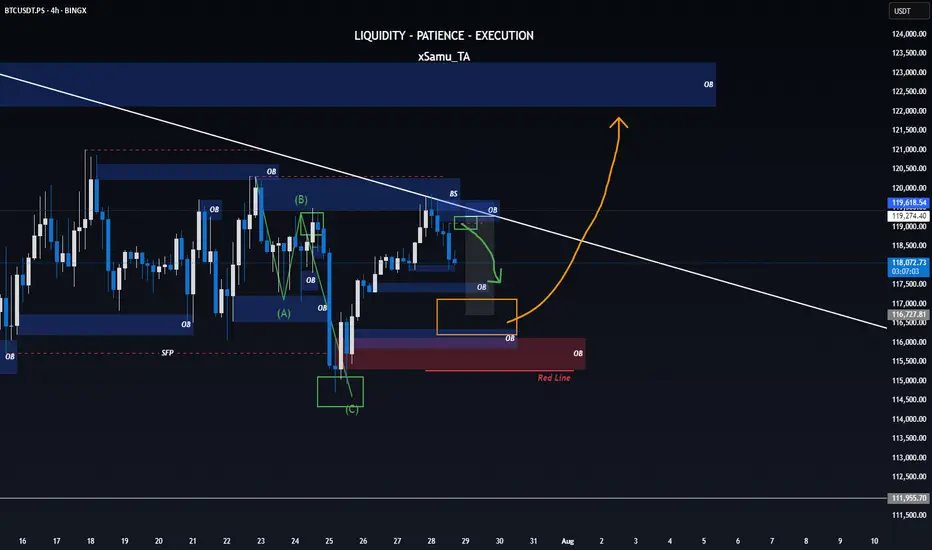
Aug 4, 2025 -- BTCUSDT.PMarket can go to test the weekly Orderblock. If that OB breaks, we are in a reversal and market is more likely to run the HTF SSL. If it runs away from the OB and shows us the first sign of expansion, we can target BSL and beyond.

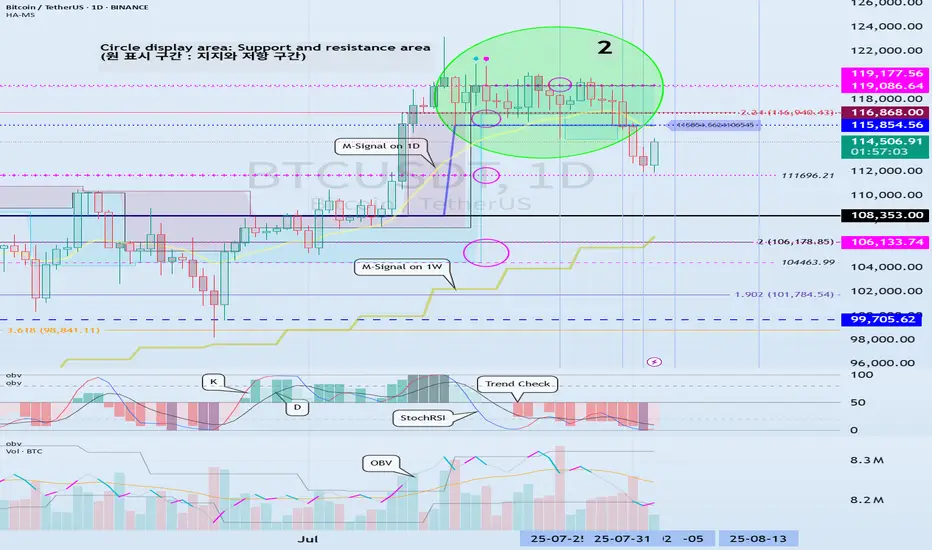
The key is whether it can rise above 115854.56
Hello, traders!
Follow us to get the latest information quickly.
Have a great day.
-------------------------------------
(BTCUSDT 1W chart)
The key is whether it can rise above the newly created DOM (60) indicator point of 119086.64.
If this fails and the price declines, we need to check for support near the previous all-time high (ATH) of 108,353.0.
Since the M-Signal indicator on the 1W chart is rising near 108,353.0, this area is expected to serve as important support and resistance.
-
(1D chart)
This period of volatility is expected to continue until August 6th.
Therefore, the key question is whether the price can rise above 115,854.56 and maintain its upward momentum.
If not, further declines are likely.
-
To rise above 115,856.56,
- The StochRSI indicator must rise within the oversold zone and remain above K > D.
- The On-Bottom Volume indicator must continue its upward trend with OBV > OBVEMA. - The TC (Trend Check) indicator should maintain an upward trend. (If possible, it's best to rise above the 0 point.)
If the above conditions are met and the price rises above 115854.56, it is expected to attempt to rise above 119177.56.
This period of volatility is a significant period of volatility.
Therefore, if the price falls below the HA-High ~ DOM(60) range and encounters resistance during this period, you should prepare for further declines.
-
The basic trading strategy is to buy in the DOM(-60) ~ HA-Low range and sell in the HA-High ~ DOM(60) range.
However, if the price rises in the HA-High ~ DOM(60) range, a stepwise upward trend is likely, while a decline in the DOM(-60) ~ HA-Low range is likely to result in a stepwise downward trend.
Therefore, a split trading strategy is recommended as the basic trading strategy.
When executing a trade, appropriate profit taking secures the liquidity of your investment, giving you the opportunity to seize new opportunities.
To achieve this, you should consider your intended investment horizon before initiating the trade and divide the trade accordingly.
-
The HA-Low indicator on the 1D chart is currently at 89294.25.
Therefore, I believe the market believes it's in a position to take profit.
-
Thank you for reading to the end.
I wish you successful trading.
--------------------------------------------------
- This is an explanation of the big picture.
(3-year bull market, 1-year bear market pattern)
I will explain in more detail when the bear market begins.
------------------------------------------------------
127-128k incoming ( altcoins round ? )Hi, Bitcoin seems to have completed its short term Elliott wave 4 correction and the price action analysis also confirms that this time Bitcoin will be able to break the 120-119 resistance, I predict Bitcoin to make a new high around 127-128. Altcoins have not grown that much yet and if the price can make a reliable consolidation above 120k, altcoins will start to rise.

BTC defies expectations –Absorbs 9 billion USD, aiming for 130K?BTCUSDT maintains its bullish momentum despite Galaxy Digital offloading 80,000 BTC (worth ~9 billion USD). Price only saw a slight dip before bouncing back quickly, signaling strong demand and a more mature market sentiment.
Citi analysts point to ETF inflows and retail participation as the primary drivers of BTC’s rally, even as investors remain cautious ahead of the Fed’s rate decision.
On the daily chart, BTC continues to trade within an ascending channel, with the 116,200 zone acting as a potential buy area on any pullback. The next target is set at 129,500 USDT, aligning with the channel’s upper boundary and technical resistance.
Suggested strategy: Look to buy near 116,200–117,000. Target 129,500. Stop-loss below 115,000.

Bitcoin Next Leg Incoming? Targets $134K from Bullish WedgeBTCUSDT is consolidating within a descending wedge right above a critical demand zone, following a impulsive breakout from its prior range structure. This current setup suggests another potential bullish continuation, especially as price continues to respect both the wedge support and internal demand.
With the higher timeframe structure favoring bulls and previous demand zones holding firm, the projected breakout targets align with $123,218 and $134,446 respectively.
A clean invalidation would only be confirmed on a sustained break below the wedge and loss of the strong support area near $110K.
All eyes on the wedge apex as BTC prepares for its next major leg.

BTCUSD : Short levelHere is a great entry point for those who scalp this instrument or pips. The level is marked with a red arrow. It will be active until I report. It may become inactive over time.
Watch out for trading on the news.

One last Correction till breakoutWith the most recent SFP printed on the higher timeframe and BTC still failing to break a significant high, all signs point toward one final dip – a move to shake weak hands and reload for the breakout that’s been brewing in silence.
⚡ If the orange level holds, consider it a highly bullish signal – supercycle potential unlocked?
Naturally, the Wizard plays both sides of the board:
📉 Short ideas would activate around the blue Order Block / green correction level.
📈 But should we bounce strong from orange… well, let’s just say you’ll want a seat for what comes next.
🟥 Bullish invalidation rests at the red line.
Let’s see how the game unfolds.
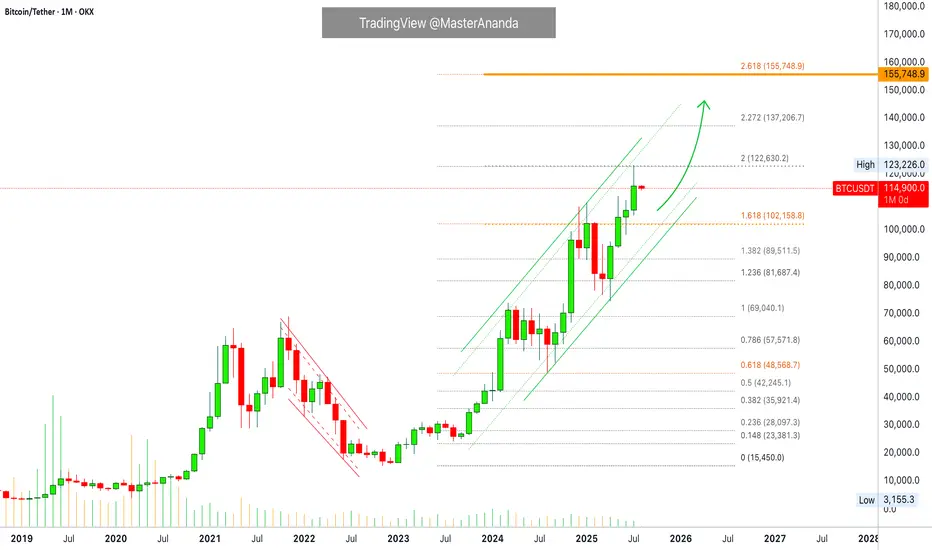
Bitcoin Monthly · Parabolic Rise ContinuesLast month Bitcoin produced its best numbers ever. The highest wick and close, a new all-time high at $123,226.
Bitcoin is not exhausted on the monthly timeframe but there is room for a retrace before the month ends. Think of the first part of the month being mixed, neutral or even bearish while the second half becomes full time bullish.
The levels that are relevant are $122,000 on the bullish side and $102,000 on the low. Right now the action is happening close to the middle so anything goes.
In 2020 Bitcoin produced 7 monthly candles growing and this was repeated again in 2023. In 2025 we have so far four green candles which means that Bitcoin can easily continue to grow. It has been known to produce more than four months green many times but there can be exhaustion at some point.
Bitcoin has been moving within a strong uptrend and is likely to continue rising. Bullish until the chart says otherwise. We are going up. Short-, mid- and long-term.
As Bitcoin consolidates near resistance, the altcoins will continue to build strength in order to grow. Remember, we are still looking at bottom prices across thousands of altcoins. Only a few moved ahead and are trading at all-time highs, the rest will catch up. The time is now, late 2025. The best is yet to come.
Namaste.
Bitcoin Long Position: Strong Trendline Support! Looking to take a long position on Bitcoin (BTC/USDT) as it bounces off the ascending trendline 🚀. The trendline has historically shown strong support levels, and it’s currently retesting it for a potential reversal.
Key Points:
Current Price: 112,580 USDT 💰
Support Zone: Trendline support is around 112,000 – 111,800 ⬇️
Target: Higher Highs near 116,322 (EMA 20 resistance level) 📈
Stop Loss: Set just below the trendline at 111,500 🔒
Trade Setup:
Entry: At 112,580 USDT
Stop Loss: 111,500 USDT
Target 1: 114,800 – 115,500 USDT
Target 2: 116,322 USDT (potential breakout)
Reasoning:
Trendline Rebound: BTC is testing a major trendline support.
Short-Term Momentum: Expecting a continuation after this test.
Risk Management: Tight stop below the trendline for safety.
🔔 Stay updated: Follow for more setups and updates! Happy trading!

BTC AI Prediction Dashboard - 6h Price Path (29.07.25)
Prediction made using Crypticorn AI Prediction Dashboard
Link in bio
BTCUSDT Forecast:
Crypticorn AI Prediction Dashboard Projects 6h Price Path (Forward-Only)
Forecast timestamp: ~09:00 UTC
Timeframe: 15m
Prediction horizon: 6 hours
Model output:
Central estimate (blue line): -118,729
Represents the AI’s best estimate of BTC’s near-term price direction.
80% confidence band (light blue): 118,724 – 119,346
The light blue zone marks the 80% confidence range — the most likely area for price to close
40% confidence band (dark blue): 118,151 – 119,894
The dark blue zone shows the narrower 40% confidence range, where price is expected to stay with higher concentration
Volume on signal bar: 95.57
This chart shows a short-term Bitcoin price forecast using AI-generated confidence zones.
Candlesticks reflect actual BTC/USDT price action in 15-minute intervals.
This helps visualize expected volatility and potential price zones in the short term.

btc buy midterm"🌟 Welcome to Golden Candle! 🌟
We're a team of 📈 passionate traders 📉 who love sharing our 🔍 technical analysis insights 🔎 with the TradingView community. 🌎
Our goal is to provide 💡 valuable perspectives 💡 on market trends and patterns, but 🚫 please note that our analyses are not intended as buy or sell recommendations. 🚫
Instead, they reflect our own 💭 personal attitudes and thoughts. 💭
Follow along and 📚 learn 📚 from our analyses! 📊💡"

BITCOIN PREDICTION: NOBODY IS WATCHING THIS PATTERN !!!(warning)Yello Paradisers, I'm updating you about the current Bitcoin situation, which is extremely dangerous for crypto noobs that will get rekt again very soon!
It's going to be a big move soon. I'm telling you on a high timeframe chart we are doing multi-time frame analysis and on a high timeframe chart I'm updating you about the RSI indicator, the bearish divergence, the moving average reclaim, and the channel reclaim that we are having right now.
We are observing a shooting star candlestick pattern, which is a reversal sign, and I'm telling you what confirmations I'm waiting for to make sure that I can say with the highest probability that we are going to the downside. On a medium timeframe, I'm showing you two patterns: one is a head and shoulders pattern, then a contracting triangle, and on a low time frame, I'm sharing with you the ending diagonal because on a high time frame chart, we are either creating ABC or impulse, and I'm telling you what the probabilities are for the zigzag, which is a corrective mode wave, or the impulse, which is a motive mode wave.
I'm sharing with you what's going to happen next with the highest probability. Please make sure that you are trading with a proper trading strategy and tactics, and that's the only way you can be long-term profitable.
Don't be a gambler. Don't try to get rich quick. Make sure that your trading is professionally based on proper strategies and trade tactics.

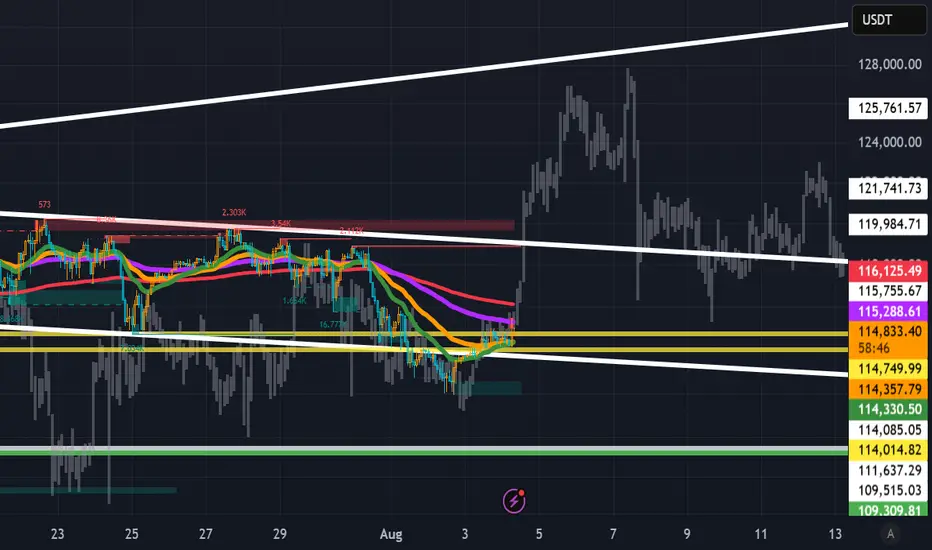
TradeCityPro | Bitcoin Daily Analysis #144👋 Welcome to TradeCity Pro!
Let’s dive into Bitcoin analysis. Today is the first day of the week and Bitcoin has made a bullish move.
⏳ 4-Hour Timeframe
After the weekly candle closed, Bitcoin made an upward move and pulled back up to the 0.5 Fibonacci zone.
✔️ The long trigger I provided yesterday in the 1-Hour timeframe has been activated. If you opened a short-term position, it has likely already hit the target. If it was a long-term position with a larger stop, then it should still be open for now.
💫 The current 4-Hour candle has wicked into the 0.5 Fibonacci zone, which indicates a strong rejection from this area. If the candle closes red, the probability of starting the next bearish wave will increase significantly.
📊 Besides the resistance from the Fibonacci level, the SMA25 is also overlapping with this zone, so this upward move could also be seen as a pullback to the SMA25 before another drop begins.
✨ However, the candle hasn't closed yet, so it's too early to decide anything. In my opinion, Bitcoin has re-entered a choppy and sideways phase that doesn’t provide good and clean positions — most trades like yesterday’s need to be scalps.
🔍 If a deeper correction happens, our lower support levels are already identified (with the most important one being the 110000 zone). For shorts, I’ll look for entries below 110000. As for longs, I’ll wait for confirmation and stabilization above 116000. For now, I’m only observing this box between 110000 and 116000.
❌ Disclaimer ❌
Trading futures is highly risky and dangerous. If you're not an expert, these triggers may not be suitable for you. You should first learn risk and capital management. You can also use the educational content from this channel.
Finally, these triggers reflect my personal opinions on price action, and the market may move completely against this analysis. So, do your own research before opening any position.

BTC Double Combo CorrectionFollowing a failure to maintain support at several critical technical levels, Bitcoin now appears vulnerable to a potential decline toward the ~$111,000 region. This projection is derived from an Elliott Wave corrective structure identified as a WXY Double Combination. The initial leg of the pattern features an ABC correction terminating near the 0.618 Fibonacci extension, thereby establishing the W pivot. This is succeeded by the X pivot, followed by a sharp, impulsive decline forming the Y wave.
By applying a trend-based Fibonacci extension across the W, X, and Y pivots, we can estimate the probable termination point of the corrective sequence—typically extending into the 1.0 to 1.1 Fibonacci range.
This move is anticipated to unfold over the weekend, potentially presenting a strategic buying opportunity, contingent on a favorable reaction at the projected low. Sunday evening may offer optimal conditions for entry, as traditional market participants—limited to weekday trading—could miss the initial dip, subsequently being compelled to re-enter at elevated price levels.
