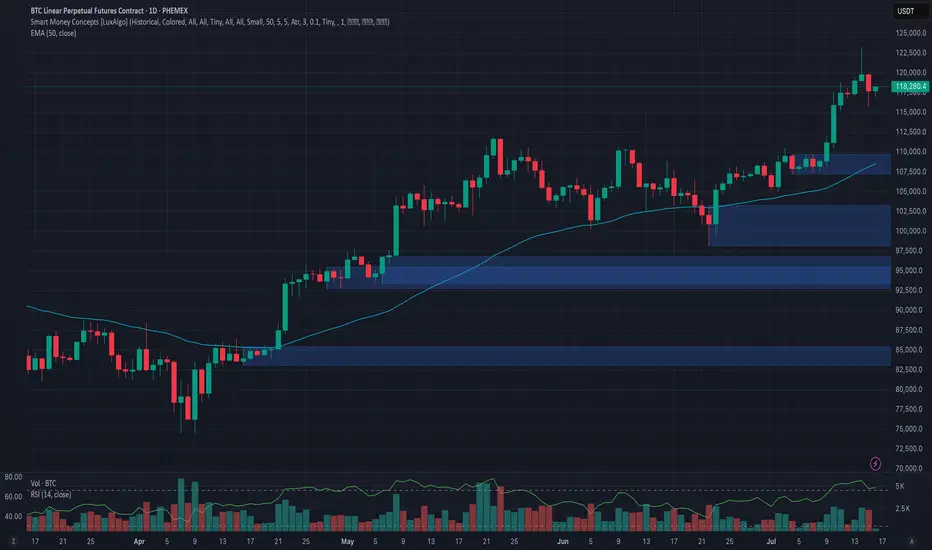
Phemex Analysis #97: What's Next for Bitcoin, After $123k?!Bitcoin ( PHEMEX:BTCUSDT.P ) recently made history by hitting an all-time high of $123,251 on July 14, 2025. However, enthusiasm was quickly tempered as BTC retraced by approximately 6%, dropping sharply to around $115,696 on July 15. Currently, the price has partially recovered and is trading at about $118,200.
With the market sentiment at a pivotal juncture following this volatile movement, traders and investors are carefully considering their next steps. Let's dive into several possible scenarios that might unfold in the coming days.
Possible Scenarios
1. Bullish Continuation (Breakout Above $123k)
If Bitcoin quickly regains bullish momentum, it may retest and surpass its recent high at $123,251. Breaking decisively above this resistance could trigger another strong rally, driven by renewed market optimism and potential institutional inflows.
Pro Tips:
Entry Strategy: Look to open or add to existing positions upon confirmation of a clear breakout above $123,251, especially if accompanied by high trading volume.
Profit Targets: Key resistance zones for profit-taking after a breakout include psychological levels at $128,000, and the significant milestone at $130,000.
Risk Management: Use protective stop-loss orders placed below the recent low around $115,000 to manage downside risks effectively.
2. Extended Consolidation (Range-Bound Scenario)
Bitcoin could enter a period of price consolidation, fluctuating between support at approximately $115,000 and resistance near $123,000. This scenario often occurs when the market awaits clearer directional cues.
Pro Tips:
Range Trading: Employ a grid-trading strategy, placing buy orders near support ($115,000–$116,000) and sell orders around resistance ($122,000–$123,000) to maximize profits from short-term volatility.
Monitoring Indicators: Keep an eye on declining trading volume, which often signals the potential for an upcoming breakout or breakdown.
3. Bearish Pullback (Correction Scenario)
Given the rapid recent surge to all-time highs, a deeper market correction remains possible. If BTC decisively breaks below support at $115,000 with strong selling pressure, further declines towards $107,218 or even $98,132 could ensue, especially if accompanied by negative broader market sentiment.
Pro Tips:
Short Opportunities: Experienced traders might explore short positions if BTC convincingly breaks below the $115,000 support level.
Accumulation Strategy: Long-term investors can strategically accumulate positions around significant lower support levels such as $107,218 and $98,132, provided price stabilization signals are evident.
Conclusion
Bitcoin is currently at a crucial technical and psychological level after hitting its latest all-time high. Traders should closely monitor the outlined scenarios—particularly watching key resistance at $123,251 and essential support at $115,000. By utilizing disciplined risk management, proactive profit-taking strategies, and careful market analysis, investors can effectively navigate BTC’s ongoing volatility and strategically position themselves for the next significant move.
🔥 Tips:
Armed Your Trading Arsenal with advanced tools like multiple watchlists, basket orders, and real-time strategy adjustments at Phemex. Our USDT-based scaled orders give you precise control over your risk, while iceberg orders provide stealthy execution.
Disclaimer: This is NOT financial or investment advice. Please conduct your own research (DYOR). Phemex is not responsible, directly or indirectly, for any damage or loss incurred or claimed to be caused by or in association with the use of or reliance on any content, goods, or services mentioned in this article.
USDTBTC trade ideas
BTCUSDTI expect a bottom to hit 110,000, then another peak. Then to around 130,000. The triple-drive will be complete and I expect a big drop.

Volume Spread Analysis (VSA) reflects increasing selling!🚨 Bitcoin Market Update 🚨
Bitcoin recently hit an All-Time High (ATH) but is now experiencing a downward correction. Multiple technical indicators suggest continued bearish momentum:
📉 Volume Spread Analysis (VSA) reflects increasing selling pressure.
📊 A bearish engulfing pattern confirms the market is trending lower.
📕 The synthetic order book reveals a heavy concentration of sell orders.
📈 The 50 & 100 SMA are acting as strong resistance levels, keeping price action suppressed below them.
🔍 Key Watch Level: If BTC breaks above the 50 SMA, we could see a potential pump. However, as of now, all confirmations point toward a bearish continuation.
💡 DYOR – Do Your Own Research
🛑 Not Financial Advice

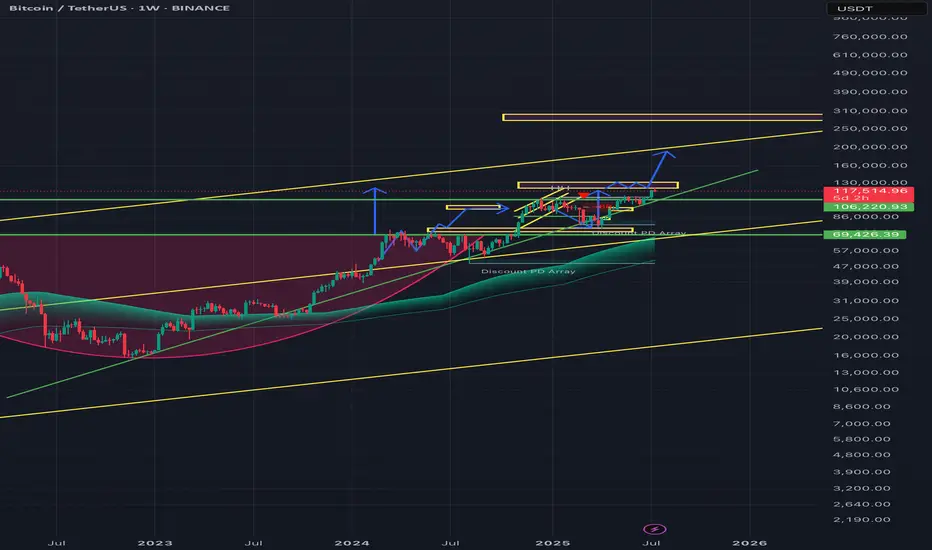
Bitcoin Analysis – 2W Timeframe
📌 As long as price holds above $113K, the trend remains bullish.
🎯 Next targets:
• T1: $151,635
• T2: $175,596
🔍 Any pullback toward $113K is a buying opportunity in a strong uptrend.

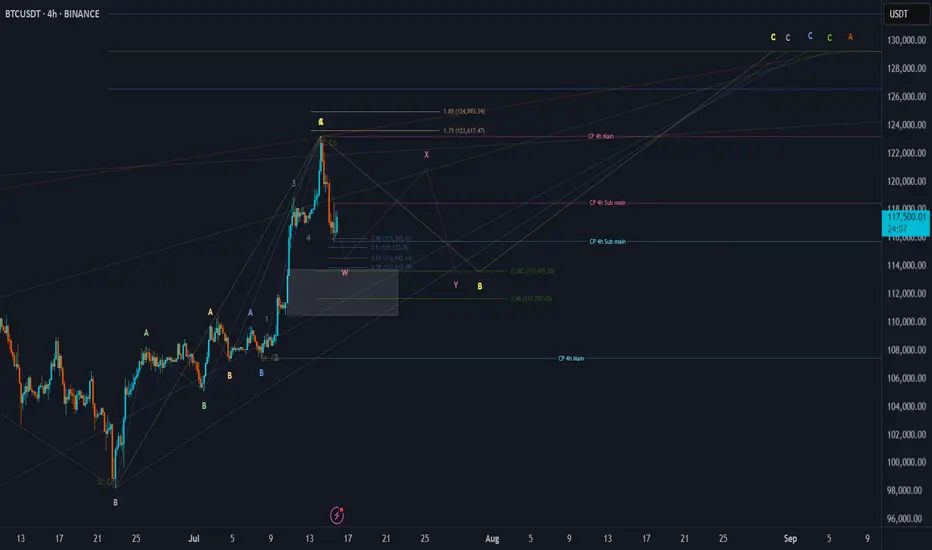
BTC Price Prediction and Elliott Wave AnalysisHello friends,
>> Thank you for joining me in my analysis. I think we have started the Yellow wave B as a micro correction. In my opinion, we will watch three waves wxy as in pink color, or it will extend to be an Irregular flat pattern where x will cross 123250
>> Till now, I am waiting to cross 118500 and stay above it after crossing for double the same time frame (my strategy).
keep like and support me to continue, See you soon!
Thanks, Bros
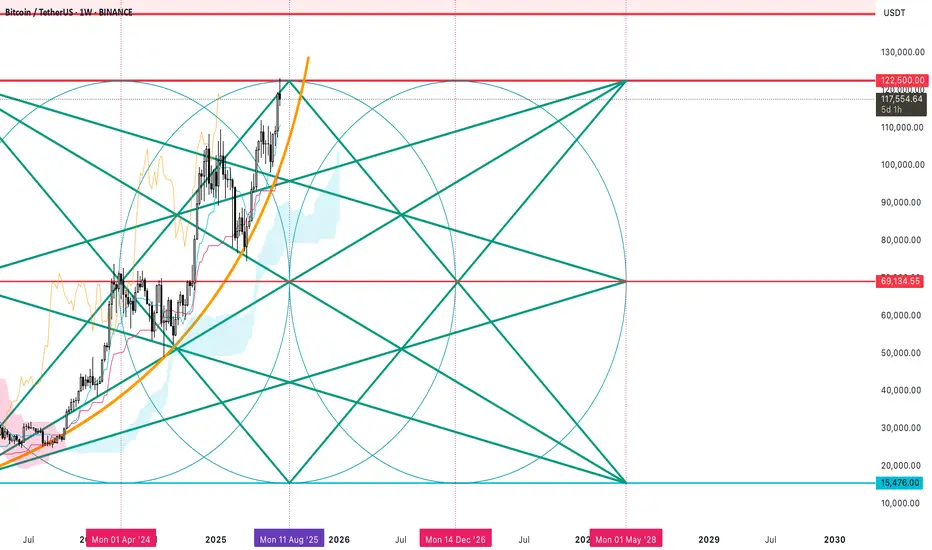
Bitcoin Geometry x IKAGI 2025 - 2028 (Solar Peak)Harmonic angles, and geometry in price and time for Bitcoin.
$122K (Major Level for the system). Potential top
Bitcoin Next Breakout Pump?So far the $117k support seem to have held which is good news for the bulls. Now we should anticipate a reclaim of the $120Ks; this should form a pretty good double bottom for CRYPTOCAP:BTC to surge to $130Ks and more, of course.
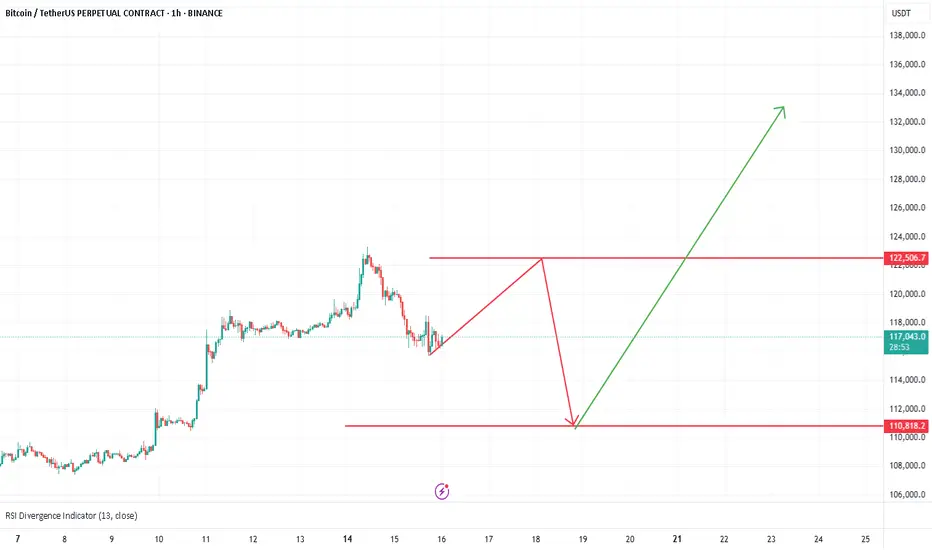
BITCOIN PULLBACK 110.000🔹 The uptrend remains intact
After setting a new high, the price may enter a mild correction toward the $110K zone.
Key support levels in this uptrend are:
✅ $115K
✅ $110K
✅ $105K
As long as the price holds above $105K, any pullback is considered healthy and the uptrend is likely to continue.
📊 A shallow correction is part of a healthy market structure.

Support and resistance zones: 115854.56-116868.0
Hello, traders.
Please "Follow" to get the latest information quickly.
Have a nice day today.
-------------------------------------
(BTCUSDT 1D chart)
This decline created a new trend line.
This added a period of volatility around July 31st.
If the HA-High indicator is generated at the 115854.56 point, the key is whether it can be supported and rise around that point.
If it falls below the HA-High indicator, there is a possibility of a downward trend.
Therefore, it is necessary to look at which support and resistance points the price is maintained at as it passes the volatility period around July 18 (July 17-19).
-
Since the StochRSI 80 indicator is formed at the 116868.0 point, it is important to be able to maintain the price above 116868.0 if possible.
Therefore, assuming that the HA-High indicator will be generated at the 115854.56 point, the key is whether there is support around 115854.56-116868.0.
Next, since the M-Signal indicator on the 1D chart is rising above 116696.20, we need to check if it is supported by the M-Signal indicator on the 1D chart or around 116696.21.
-
So far, we have talked about how to maintain an upward trend by breaking through a certain point or section.
That is,
- The K of the StochRSI indicator should be below the overbought section and should show an upward trend with K > D.
- The PVT-MACD oscillator indicator should show an upward trend. (If possible, it should be above the 0 point.)
- The OBV indicator of the Low Line ~ High Line channel should show an upward trend. (If possible, it should be maintained by rising above the High Line.)
I said that when the above conditions are met, there is a high possibility that the upward trend will continue.
On the other hand, in order to change to a downward trend,
- The DOM (60) indicator should be created and show resistance near the DOM (60) indicator.
- When the HA-High indicator is generated, it should show resistance near the HA-High indicator.
- When the K of the StochRSI indicator falls from the overbought zone, it should switch to a state where K < D and show a downward trend. (However, caution is required as volatility may occur when K reaches around the 50 point.)
- The PVT-MACD oscillator indicator should show a downward trend. (If possible, it is better if it is located below the 0 point.)
- The OBV indicator of the Low Line ~ High Line channel should show a downward trend. (However, it should show a downward trend in the state where OBV < OBV EMA is present.)
When the above conditions are satisfied, there is a high possibility of a downward trend.
Among these, the most intuitive thing to know is whether the DOM (60) indicator and the HA-High indicator are generated.
This is because, in order to first switch to a downward trend, a signal that the current price position is a high point must appear.
The DOM(60) indicator is an indicator that indicates the end of the high point.
Therefore, if the DOM(60) indicator is generated, it is likely to be a high point.
However, since it can be supported and rise near the HA-High indicator, you should check whether there is support in the HA-High ~ DOM(60) section and respond accordingly.
The HA-High indicator is an indicator created for trading on the Heikin-Ashi chart, and if it falls below the HA-High indicator, it is likely to be a point where a downtrend will begin.
-
Since the same principle applies to any time frame chart you trade, it is easier to understand the chart and determine the timing of the start and end of the transaction.
However, the basic trading method must be a split trading method.
The reason is that if it rises in the HA-High ~ DOM(60) section, it is likely to show a stepwise upward trend, and if it falls in the DOM(-60) ~ HA-Low section, it is likely to show a stepwise downward trend.
This basic trading method, that is, buying near the HA-Low indicator and selling near the HA-High indicator, will eventually make you familiar with day trading, which will have an effective influence on finding a buying point when making mid- to long-term investments.
It is wrong to say that you are good at mid- to long-term investments when you are not good at day trading.
You were just lucky.
Unfortunately, this kind of luck cannot last.
-
Thank you for reading to the end.
I hope you have a successful transaction.
--------------------------------------------------
- This is an explanation of the big picture.
(3-year bull market, 1-year bear market pattern)
I will explain more details when the bear market starts.
------------------------------------------------------

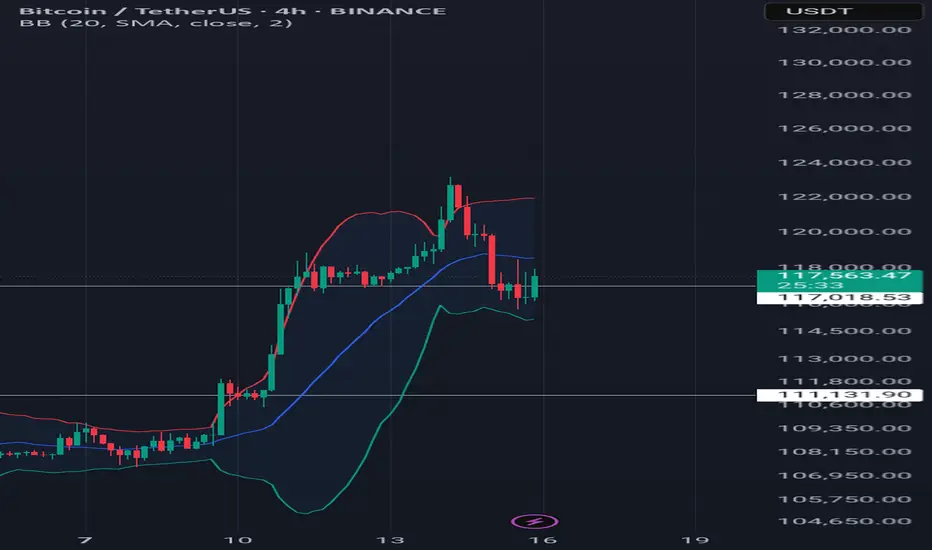
More up📈 Trading Tip – Long Position on Bitcoin (BTC)
As of today, Bitcoin is trading around $117,395, after retreating from an intraday high of $120,196. The price action follows a recent rally toward $123,000, followed by a healthy correction to the $116,000 area.
Technical Overview:
• The resistance zone at $119,000–$120,000 has been broken and could now act as future support.
• A potential inverse head and shoulders pattern is forming, suggesting a breakout toward the $160,000 level, if the support at $114,000–$115,000 holds.
• On the 4-hour chart: MACD is showing a renewed bullish crossover, and RSI is rising steadily without entering the overbought zone — both supporting further upside toward $125,000–$130,000.
🔹 Suggested Entry: Between $117,000 – $118,000, ideally after confirmation of support near the previous breakout zone.
🔹 Target 1 (TP1): $125,000
🔹 Target 2 (TP2): $130,000–$135,000 (depending on momentum continuation)
🔹 Stop Loss (SL): A confirmed break below $115,000 (preferably on the daily close or with strong sell pressure)
⚙️ Risk Management: Do not risk more than 2–3% of your total capital on this trade.
📅 Watchlist Note: Keep an eye on major economic data (e.g., U.S. CPI or Fed announcements) as they can heavily affect market liquidity and volatility.
BTCshort term sell positionDuring the retracement phase, there’s a good opportunity to take a short position

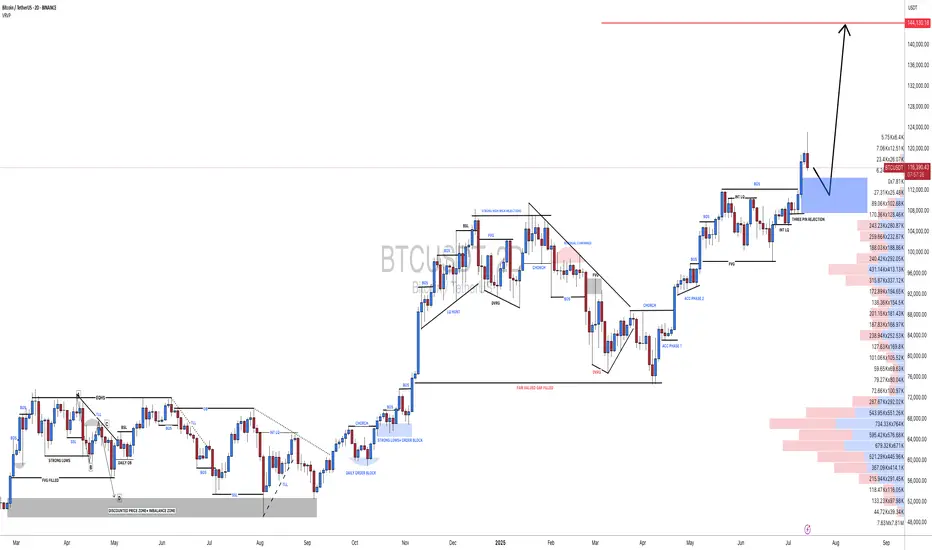
Btc chartBtc harmonics chart.
Price should go up to hit 122k to form a bearish pattern, if the pattern will not get invalidated the target area is around 100k - 98k, and that will form a bullish harmonics pattern that will push the price to 132 - 137k and above, if 100k will hold support.
PVSRA Bitcoin AnalysisMay 08 2025 a bullish candle's parallel volume bar broke the threshold in the below pane; indicating price instability, or unfilled orders if you will. June 22 price returns to that full candle body and dips $500 below it, to feel the opposing force and realize orders have been filled and we are in equilibrium. This set up is usually set up and finished in 1-2 weeks (volume absorption) so this 1.5 month setup was an outlier and a grind that paid off BIG patience and knowing your plan of attack is everything in this game, you have to have a plan for every single variable and NEVER stray.
Present day, a 30 minute candle has broken our volume threshold, and weve moved aggressively away from that magnetic force inevitably pulling price back towards it EVENTUALLY as it did june 22nd. Due to the commonality and the recentness of the move that just happened of 5/8-6/22, we can suspect price pattern will repeat and price will be bid up, from 115-120k, where we will then reverse to 103. The bar pattern from the 5'8 6'22 move was copied, pasted, and retrofitted to current time.
Regardless of the exact pattern of the move we expect price eventually to resolve those orders at the 103 mark and our moves are based in that zone. This seems like a range out as we capitulate these 6 figures whilst remaining in a bull market.

BTC SHORT Price found resistance after exhaustive uptrend to 120K area.
Trend reversal taking place. Looks like more downside for now.

BTC price analysisDO NOT FORGET USING A STOP LOSS
Warning:
This is just a suggestion and we do not guarantee profits. We advise you analyze the chart before opening any position.
I hope you are always profitable

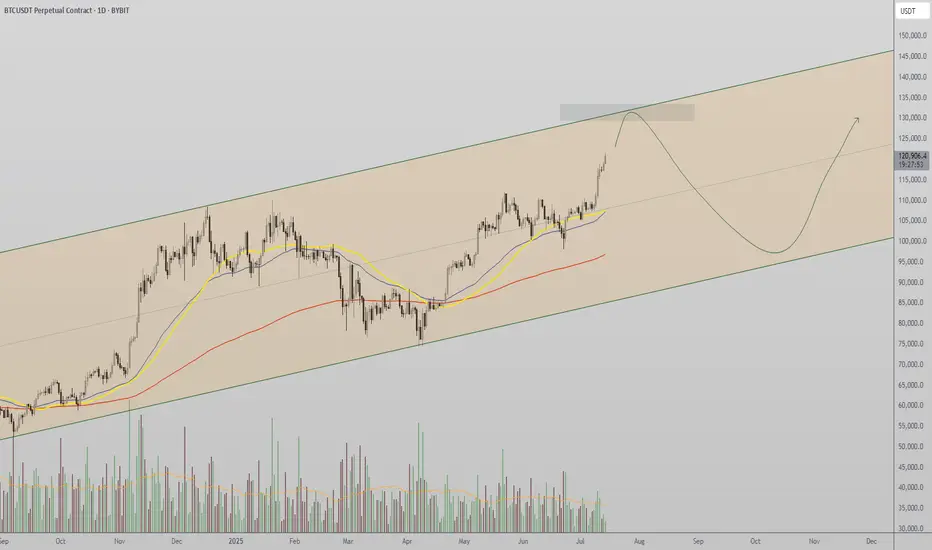
$130K Channel Resistance — Bullish Structure Intact Bitcoin continues its strong uptrend, pushing toward high time frame resistance at $130K. With no bearish structure in sight, short-term momentum favors continuation unless resistance prompts a reversal.
Bitcoin is showing continued strength in the immediate short term, with price steadily advancing toward the $130,000 high time frame channel resistance. This level marks the upper boundary of a macro trend channel and presents the next critical test for BTC. While this zone may act as a barrier, the market remains structurally bullish, and further upside remains possible before any meaningful correction takes place.
Key Technical Points:
- Channel Resistance at $130K: Major high time frame level to watch
- Bullish Market Structure: Consecutive higher highs and higher lows on lower time frames
- No Bearish Reversal Signs Yet: No structural break or shift to indicate correction
Bitcoin’s price action has been defined by clear bullish structure, especially on the lower time frames, where the market continues to print higher highs and higher lows. This confirms that bulls are still in control and dips are being bought aggressively, maintaining the strength of the trend.
The next major technical level is the $130K resistance, which aligns with the upper boundary of a long-term ascending channel. This area is likely to serve as a key decision zone. If price approaches this region without any signs of exhaustion or bearish divergence, the probability of a brief breakout or retest increases.
However, it is also important to consider this level as a potential inflection point. If price begins to stall at or near $130K — especially with declining volume or a shift in short-term structure — it could signal the beginning of a corrective move. Until such a development occurs, however, the market remains decisively bullish.
Traders should closely monitor intraday structure around the $130K zone. A clean break above on strong volume would indicate continued strength and could open the path toward further price discovery. Conversely, the first sign of weakness would be a break of short-term support levels and failure to form new highs — neither of which has occurred yet.
Bitcoin remains bullish in the short term as it approaches $130K resistance. Unless a structural break occurs or bearish signals appear, further upside remains likely before any correction sets in.
Idea that BTC will retrace before bullish continuationI might be wrong tonight, i see some clowns (cme gaps, fibs, OB) lurking need to be eliminated soon, i wish i'm wrong this idea, going to retrace at 113 before bullish continuation. Anyway DYOR and stay safe!

#BTCUSDT(BITCOIN): Another Small Correction And Bounce Straight Bitcoin reached a record high of 125k, but then its price started to drop and is currently trading at 115k. We expect the price to reverse from the 110k area and continue its bull move towards the potential next target of 150k. Keep an eye on the price to see if it falls below our area of interest.
Good luck and trade safely!
Team Setupsfx_
BITCOIN UPDATEHello friends🙌
📈Given the upward trend we had, you can see that the price is in an upward channel and has also formed a bullish pattern, which, given the strength behind the trend, seems to have higher targets.
🔊Be careful, the basic principle of trading is capital management, so be sure to follow capital management.
🔥Join us for more signals🔥
*Trade safely with us*

BTC trading planBINANCE:BTCUSDT A full day has passed since my last update. We’re now witnessing a clear bull-to-bear reversal in market sentiment. The hourly RSI is deeply oversold, but the 4-hour RSI still has room to drop further. Price is aggressively targeting the weekly pivot at $115,334. With the local trendline and the $119K level broken, the orange scenario is now in motion. A short pullback is possible before the next leg down toward $110K. For details, see yesterday’s video
Trade safe and stay adaptive

Don’t Fear Big Pullback Candles — We’re Still in a Bullish Trend🚀 Don’t Fear Big Pullback Candles — We’re Still in a Bullish Trend!
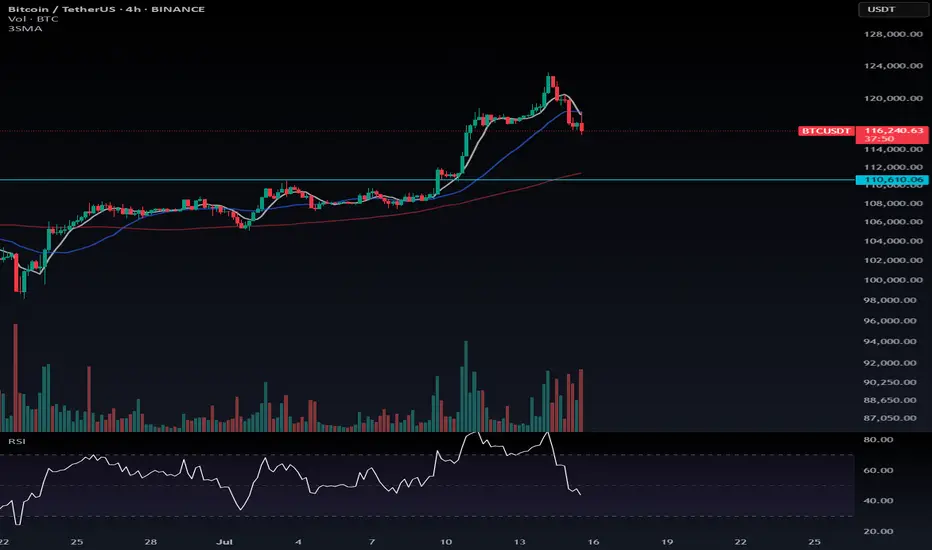
We’re currently in a long-term uptrend, so don’t let large corrective candles spook you. As long as Bitcoin stays above $110,610, there’s no reason to look for shorts. Be patient — let the market build its structure before it hands us a clean long trigger.
Right now, with BTC pulling back, BTC Dominance is also dipping, which is a bullish sign for altcoins. Instead of hunting shorts, focus on altcoins that are outperforming Bitcoin or showing bullish setups.
---
💬 Which alts are you watching right now? Drop your favorites in the comments!
Bitcon Crash Time!!Currently, the price of Bitcoin is at its peak, and it's the best time to exit the market because a major drop is imminent...

1d BTC current movement (quick info)Just a quick reminder. the current upper band of BINANCE:BTCUSDT of the past two cicles is being broken right now. if you zoom in you can even see a retest of this band now as support. if it holds, this could really mean a parabolic shift.
Will look into it further.
