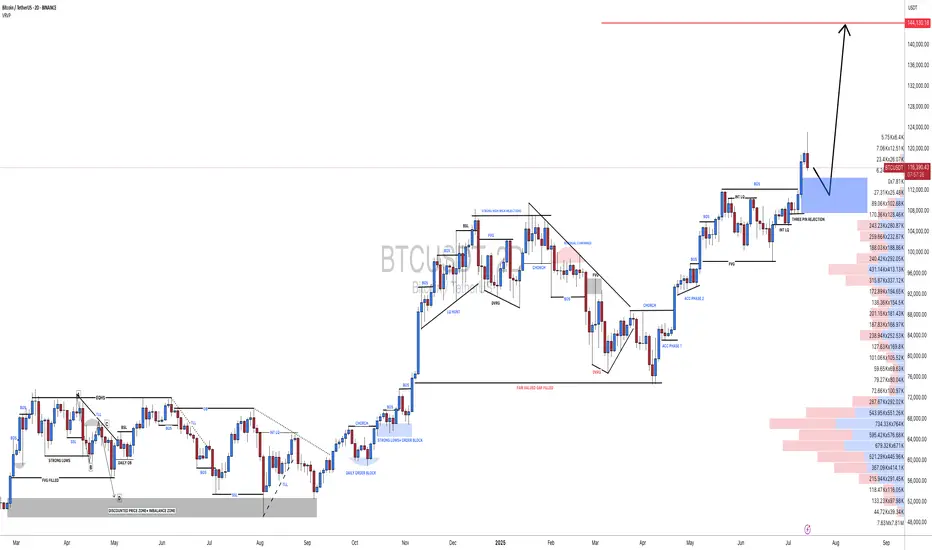
#BTCUSDT(BITCOIN): Another Small Correction And Bounce Straight Bitcoin reached a record high of 125k, but then its price started to drop and is currently trading at 115k. We expect the price to reverse from the 110k area and continue its bull move towards the potential next target of 150k. Keep an eye on the price to see if it falls below our area of interest.
Good luck and trade safely!
Team Setupsfx_
USDTBTC trade ideas
BITCOIN UPDATEHello friends🙌
📈Given the upward trend we had, you can see that the price is in an upward channel and has also formed a bullish pattern, which, given the strength behind the trend, seems to have higher targets.
🔊Be careful, the basic principle of trading is capital management, so be sure to follow capital management.
🔥Join us for more signals🔥
*Trade safely with us*

BTC trading planBINANCE:BTCUSDT A full day has passed since my last update. We’re now witnessing a clear bull-to-bear reversal in market sentiment. The hourly RSI is deeply oversold, but the 4-hour RSI still has room to drop further. Price is aggressively targeting the weekly pivot at $115,334. With the local trendline and the $119K level broken, the orange scenario is now in motion. A short pullback is possible before the next leg down toward $110K. For details, see yesterday’s video
Trade safe and stay adaptive

Don’t Fear Big Pullback Candles — We’re Still in a Bullish Trend🚀 Don’t Fear Big Pullback Candles — We’re Still in a Bullish Trend!
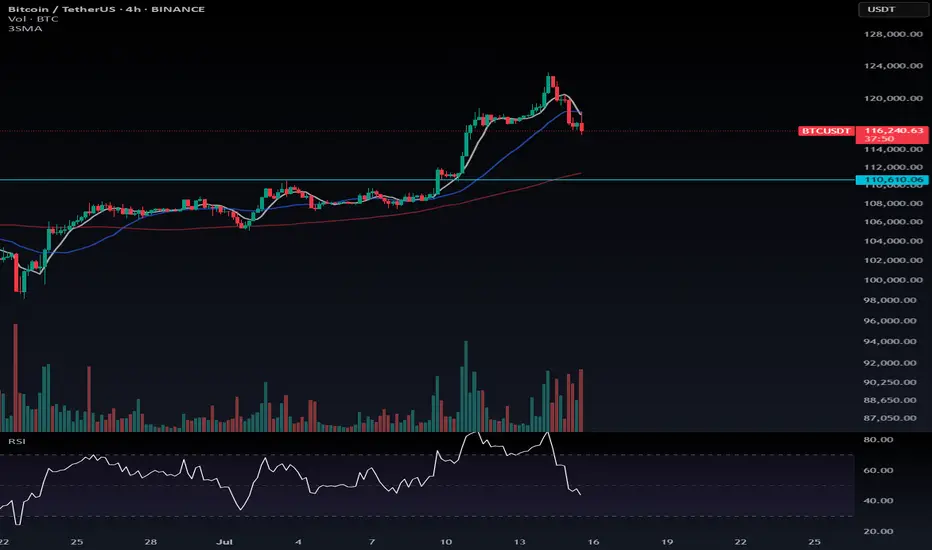
We’re currently in a long-term uptrend, so don’t let large corrective candles spook you. As long as Bitcoin stays above $110,610, there’s no reason to look for shorts. Be patient — let the market build its structure before it hands us a clean long trigger.
Right now, with BTC pulling back, BTC Dominance is also dipping, which is a bullish sign for altcoins. Instead of hunting shorts, focus on altcoins that are outperforming Bitcoin or showing bullish setups.
---
💬 Which alts are you watching right now? Drop your favorites in the comments!
Bitcon Crash Time!!Currently, the price of Bitcoin is at its peak, and it's the best time to exit the market because a major drop is imminent...

1d BTC current movement (quick info)Just a quick reminder. the current upper band of BINANCE:BTCUSDT of the past two cicles is being broken right now. if you zoom in you can even see a retest of this band now as support. if it holds, this could really mean a parabolic shift.
Will look into it further.

Bitcoin Eyes $200K: Why a Correction Could Come FirstAs Bitcoin continues its remarkable run, optimism is high that we could see BTC break the $200,000 mark this year. The momentum is there, with bullish sentiment across the crypto and traditional finance spaces. Yet, it’s important to acknowledge a potential short-term correction ahead before new highs are reached.
Why a Correction May Happen Soon
Several factors point to a volatile period in the weeks ahead:
Upcoming Tariffs: On August 1st, the new round of tariffs announced by President Trump is set to take effect. Trade disputes historically introduce uncertainty into global markets and can sap risk appetite, even in alternative assets like crypto.
Federal Reserve Policy: The Federal Reserve has not yet begun lowering interest rates. High rates continue to pressure both equity and crypto markets by making cash relatively more attractive and increasing the cost of leverage.
Geopolitical Tensions: Ongoing instability in the Middle East adds another layer of unpredictability. Geopolitical flare-ups often lead to market volatility as investors act defensively.
The Takeaway
While Bitcoin is on track to reach unprecedented levels this year, investors should remain mindful of the broader market context. Short-term corrections are part of any healthy bull run and can be driven by macroeconomic and geopolitical events. Staying informed and maintaining a disciplined approach will be crucial for navigating what promises to be an exciting—and eventful—rest of the year.
Not Investment Advice!
#crypto #bitcoin #short #correction #dump #uncertainty #volatility #war #news #bearish

BTC Analysis — Long-Term Buy Zone AheadI'm watching $111,000 as a major buy zone on Bitcoin.
If price retraces to that level, I’ll be ready to enter a long position.
This is not a prediction — it’s a scenario.
Smart traders don’t guess, they prepare.
Let price come to your level. No chasing.
📍Set your alerts and stay patient.

BTC Scenario for this daysHere’s my BTC/USDT analysis.
Hello everyone 👋
❓Has something strange happened today?
Well, on the daily timeframe, we’ve had one red candle after five consecutive green candles — maybe that’s it?
Many traders wanted to take some profit after the recent bullish run.
Also, the transfer of 40,000 BTC to an exchange by a whale likely acted as a trigger for that sell-off.
🟡 So what now?
✅ As long as BTC stays above 110,000, the bullish scenario remains valid.
If price drops below 110,000, we’ll need to reassess based on dominance metrics before making any bearish decisions.
Still, under 110K, I’ll start considering potential short setups.
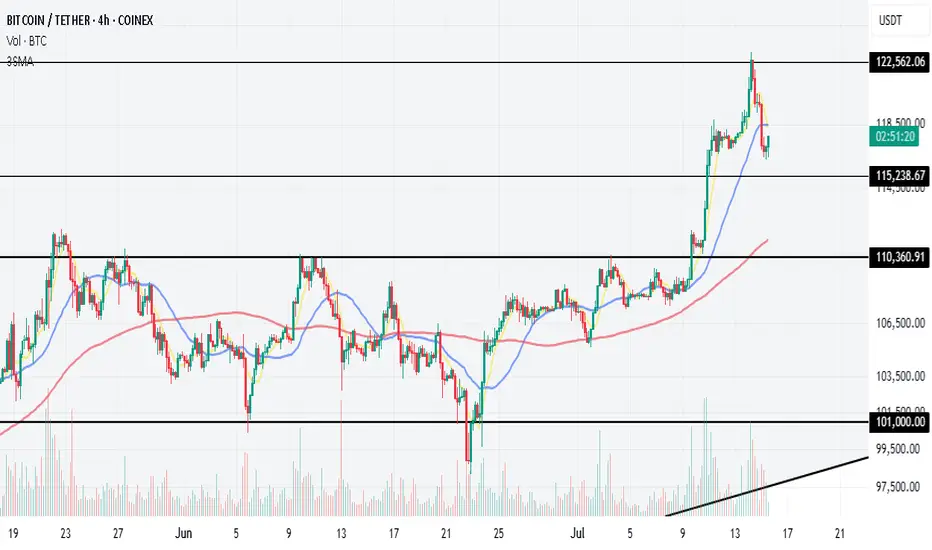
📍There is a strong support zone between 115,000 – 116,000 for long positions.
If that zone breaks, a drop toward 110,000 is likely.
On the other hand, a rebound from 115K – 116K and a retest of 122,000 is still on the table.
🔄 There’s also a chance BTC will consolidate in the current range for a while.
🚀 Finally, a break above 120,000 opens the door for a move toward 130,000 as the next major target.
---
🙏 Thanks for reading!
If this analysis was helpful, hit the 🚀 icon to support the post.
HolderStat┆BTCUSD above $120BINANCE:BTCUSDT has surged past $129,000 following a breakout from long-term consolidation. The chart shows a clean continuation structure with the next resistance between $135,000–$137,000. Momentum remains on the side of bulls.

TradeCityPro | Bitcoin Daily Analysis #129👋 Welcome to TradeCity Pro!
Let’s take a look at the Bitcoin analysis and key crypto indices. As usual, in this analysis, I’ll review the futures triggers for the New York session.
⏳ 1-hour timeframe
Yesterday, Bitcoin faced a sharp drop after being rejected from the 122733 top and fell down to the 116829 level.
⚡️ Currently, the price has reached an important support area that I’ve marked for you, and at the same time, the RSI has entered the Oversold zone.
✅ Considering the main trend of the market is bullish, this RSI entry into Oversold could be a very good entry point for a long position, as it may indicate the end of the correction.
✨ If the price holds above the 116829 zone, we can enter a long position, and it’s worth opening a position at this level. Further entries can be taken with breakouts of 118494 and 122733.
👑 BTC.D Analysis
Let’s go to Bitcoin dominance. It has continued its downward movement and after breaking 64.44, it’s now moving down toward 64.18.
📊 If this level breaks, we’ll get confirmation of the continuation toward 63.96. In that case, long positions on altcoins would be very suitable.
📅 Total2 Analysis
Total2 is also undergoing a correction like Bitcoin and has settled below the 1.3 level.
⭐ If the correction continues, the next level to watch is 1.26. For long positions, you can enter after breakouts of 1.3 and 1.33.
📅 USDT.D Analysis
Now to Tether Dominance. After bouncing from the 4.22 bottom, it has returned to the box between 4.36 and 4.44.
🔑 If 4.36 breaks, the next bearish leg could start. On the other hand, if 4.44 breaks, we’ll get the first signal of a trend reversal.

#BTC Update #7 – July 15, 2025#BTC Update #7 – July 15, 2025
Bitcoin is currently within the consolidation zone where it previously paused during its last upward move. From this zone, it had previously bounced and created a new all-time high. It is now undergoing a correction, and the level it has reached aligns with the 0.382 Fibonacci retracement, which is perfectly normal for a first stop in a correction.
If the correction continues, the second stop could be around $114,795, and the third around $113,012. If it reaches these levels, it will have filled at least half of the imbalance created during the previous rally.
Looking at the volume, I anticipate that Bitcoin might start to bounce from this level. If it manages to break above the $122,666 zone, the next target would be around $127,172.
I do not plan to buy Bitcoin here unless I see a high-volume green candle. However, if Bitcoin breaks above the $118,900 level with strong volume, a long position might be considered, as the target would likely shift toward the $127,000 range.

$BTC FLY TOWARDS 141K$ NEXT?CRYPTOCAP:BTC Bull Flag Target Hit – Eyes on 129K & 134.5K Next! 🔥
Bitcoin has overachieved its bull flag target and is now setting up a textbook Break & Retest of the previous All Time High (~$123K).
📌 Key Levels to Watch:
🔄 Retest Zone: $111K–$113K (previous ATH)
🎯 Next Targets:
$129K (0.12 Fib Extension)
$134.5K (Golden Extension Zone)
📉 Invalidation: Below $104K
Volume remains solid, and structure is bullish — expect a healthy dip & bounce before continuation.
This retest could be the final springboard toward $141K.

BTCUSDT.P liquidity analysis🟠 CRYPTOCAP:BTC
📄 This analysis is for liquidity and comparing supply and demand ratios
🚨 We start by noting that actual selling pressure began at 121826 and this ratio increased as it dropped below 119723
📄 Any daily close below 117612 will increase this pressure, which is logical after such a rise, specifically in Bitcoin
⭕️ The two closest important levels with liquidity and buying strength are at 114813 and 110623
◀️ The current rebound from 116114 (the lowest point Bitcoin has reached currently at the time of writing this analysis) is insufficient in terms of liquidity and needs more momentum, and attention here should be on the level 117612
📄 The current movement is between 117612 - 114813, the range where Bitcoin stabilized before achieving the historical peak, and thus maintaining this range will provide a boost for a larger rise

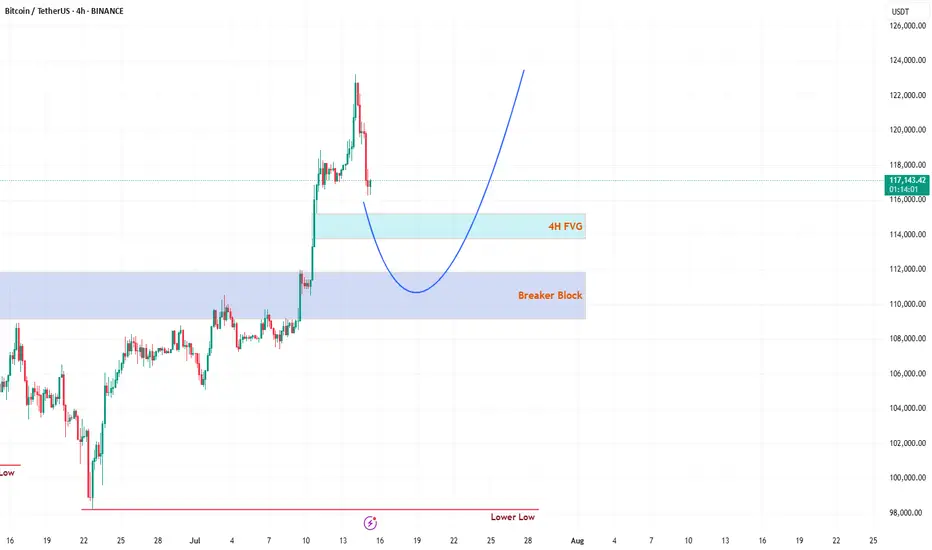
Bitcoin’s Wild Ride to New ATHs: What’s Next for Traders?Hello, TradingView warriors! 👋
Have you caught Bitcoin (BTC) smashing through a new all-time high (ATH) this Monday? 🎉 If you blinked, you might’ve missed it! But don’t worry, the crypto king isn’t done with its rollercoaster ride just yet. After soaring to new heights, BTC has pulled back for a retracement—not a full-on reversal, so hold your horses! 🐎 Whales are playing their usual games, setting traps for unsuspecting traders. Don’t fall prey to their tricks! 🦈 Let’s break down the key levels to watch and stay one step ahead. 💡
🔍 Key Levels to Watch on the Chart
1️⃣ 4H Fair Value Gap (FVG)
This 4H FVG is a thing of beauty—my personal favorite! 😍 But let’s be real, Bitcoin doesn’t care about aesthetics. This FVG is likely to act as the first resistance level. Here’s the plan:
If respected, expect BTC to use this level as a springboard to catapult back toward the ATH. 🚀
If broken, BTC might slide toward the stronger resistance below. Keep your eyes peeled for how price reacts here! 👀
2️⃣ Daily Breaker Block (PD Array)
This is the big one—a rock-solid resistance zone on the daily timeframe. I’m leaning toward BTC dipping into this Breaker Block to clear out liquidity before making its next big move to retest the ATH. 🏦 This level is a magnet for price action, so don’t sleep on it! 😴
🛠️ Trading Strategy: Stay Sharp!
Patience is your best friend right now, traders. 🙏 Don’t rush into trades without confirmation. Watch how BTC interacts with these two levels:
4H FVG: Look for rejection or a breakout to gauge short-term direction.
Daily Breaker Block: If price dips here, it’s likely hunting liquidity before the next leg up.
Wait for clear price action before jumping in—let the market show its hand! 🃏 Stay disciplined, avoid the whale traps, and let’s ride this BTC wave together. 🌊
📚 Want More? Follow Me!
If you’re hungry for more technical analysis insights and market updates, hit that follow button! 📈 I share tips, tricks, and breakdowns to help you navigate the markets like a pro. Let’s level up your trading game together! 💪
What’s your take on BTC’s next move? Drop your thoughts below, and let’s discuss! 💬 Happy trading, and may the profits be with you! 📈
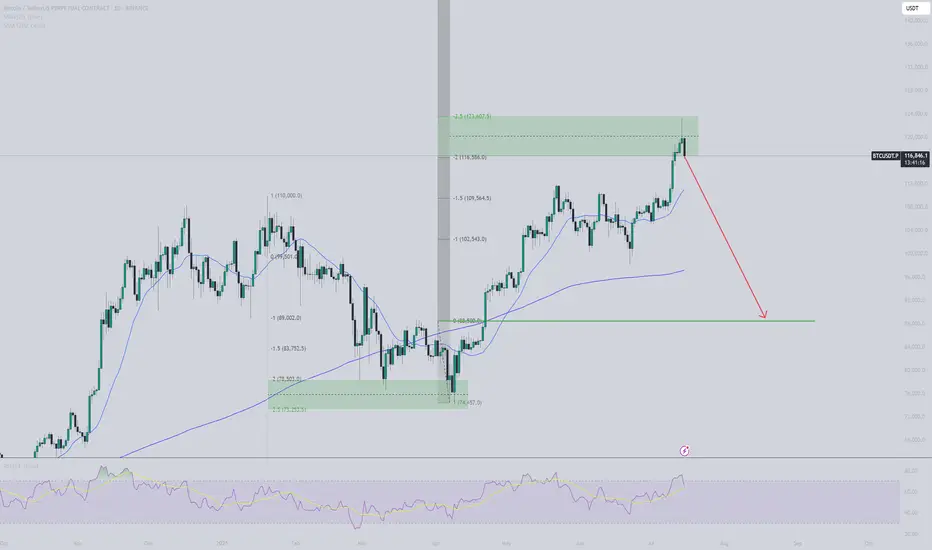
BTC retracement comingBTC seems to follow the 2-2,5 stdv price structure. Based on simply stdv from last manipulation leg down it suggests we are now at reversal zone, and I expect price to retrace down. First reaction seems to support this plan. Aiming at $88,5K.
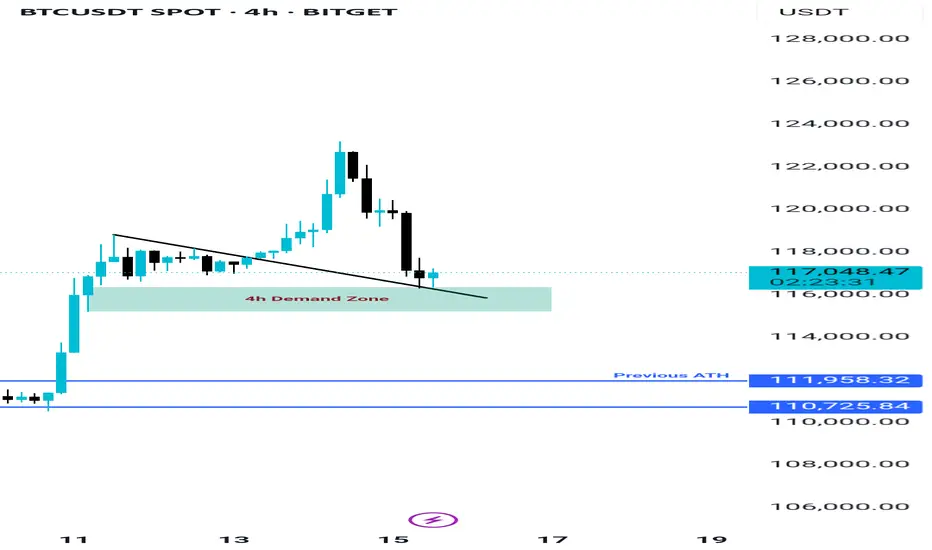
BTC still Holding the Demand Zone, Bitcoin is currently holding the demand zone between $116K and $117K, which also aligns with the retest area of a previously broken trendline—making this zone quite strong. If BTC manages to close above $117.8K on lower timeframes, we could see the beginning of a new uptrend targeting around $130K. However, if this zone fails due to any unexpected news or events, the next key support lies between $111K and $113K.

Bitcoin (BTC): Current Neckline Zone is Crucial | Bounce Coming?After a recent push to a new ATH area, the price has cooled down, which led the price back to the local neckline zone, which is our next important zone.
This correction cooled down the Bollinger Bands Channel and RSI, which would mean we are just one MSB (on smaller timeframes) away from another rally towards the upper zones.
Now if for any reason we fall more, then this might turn into a nasty movement, as our target would be then around $110K, where we would be looking for another buy entry (if we fail to get that MSB we are currently looking for).
Swallow Academy

BTC BIG SHORT!We did a mirror retest, and many other signals also point to a sharp decline, indicating numerological codes 69/96.

$BTC All Eyes on the FVG Zone. CRYPTOCAP:BTC broke out above key resistance and is now retesting the FVG zone near $112K–$115K.
Holding this level could trigger a fresh rally toward $127K–$132K.
DYRO, NFA

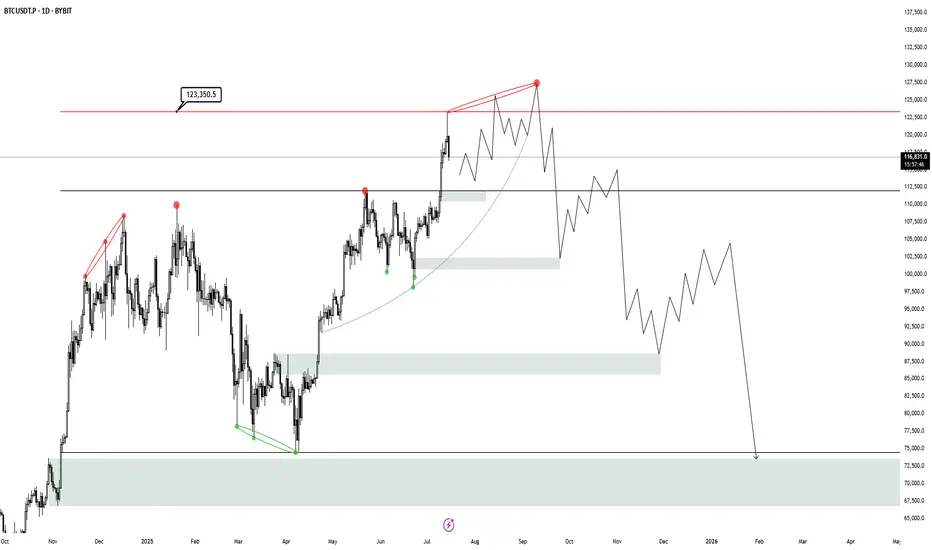
BTC HTF Distribution V3This is my new outlook for BTC if this 250 day old range is intended to be a HTF Distribution Model 1, which has neither been confirmed nor invalidated. A weekly close above 123.350$ will invalidate this model and likely lead to higher prices. Yesterday we had a perfect rejection from the deviation limit, which now probably creates a new range, that then will either reaccumulate or distribute.
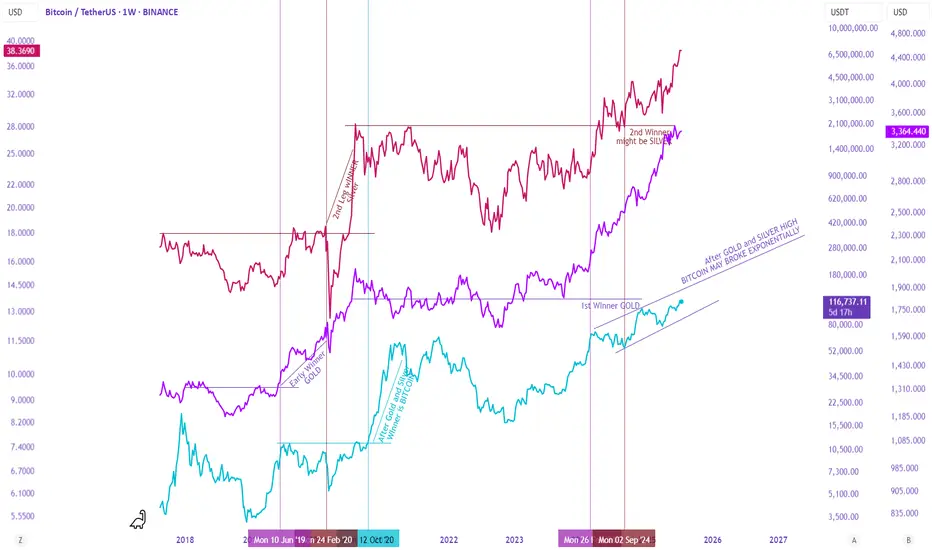
Gold, Silver, and Bitcoin – A Staggered Anti-Currency Rotation?There seems to be a complex yet recurring relationship between Gold, Silver, and Bitcoin during anti-currency phases (when fiat weakens).
First Leg – Gold Leads
Gold typically leads the first leg, breaking out to new highs. Silver follows but lags—trending up without breaking major resistance. During this phase, the Gold/Silver ratio expands.
Second Leg – Silver Takes Over
Eventually, Silver breaks resistance and becomes the second leg leader. As it outperforms Gold, the Gold/Silver ratio contracts back to mean.
Bitcoin, during this time, is usually bottoming or entering Stage 2 (early uptrend). This time, it has already broken resistance but is rising slower than in past cycles.
Third Leg – Bitcoin Dominates
As Gold and Silver peak and begin to correct, Bitcoin accelerates, often making new all-time highs (ATH).
This staggered rotation played out during the 2018–2022 cycle. Let's see if history rhymes in this cycle.