Overlaying AI forecast directly onto chart. Judge for yourself On the 27th of June I put through a prediction into my AI forecasting machine and this is what it said (image on screen)
I am SO impressed with the forecast so far, so I've overlayed the image onto the price action and will check in on it daily
This will give You the dominant trend direction for Bitcoin, and perhaps some extra capital in your accounts #you'reWelcome
USDTBTC trade ideas

SELL BTC 13.7.2025 (scalping M15)Counter-trend trade order: SELL at THE TOP
Type of entry: Limit order
Condition:
- If the price break down at 122,041 confirming the down trend.
Note:
- Management of money carefully at the price of bottom (122,041)
Set up entry:
- Entry sell at 122,821
- SL at 123,334
- TP1: 123,041
- TP2: 121,389
Trading Method: Price action (No indicator, only trend and candles)


BTC Bullish Setup: Two Long Positions Aligned for ContinuationHello guys!
Bitcoin is currently in a strong uptrend, consolidating after a sharp move up. The chart highlights a textbook bullish continuation pattern (pennant/triangle), suggesting momentum is building for another leg up.
Attention:
This is not an either-or setups. Both long entries are valid and could trigger one after the other, offering layered opportunities for bulls.
1- First Long: Breakout from Bullish Pennant
Price is tightening inside a triangle after a strong impulse move.
A breakout above the resistance around $118K would confirm continuation.
Entry on the breakout targets the upper liquidity zone near $122K.
2- Second Long: Pullback to S&D Zone (around $115K)
If the breakout happens and then retraces, watch for price to revisit the S&D zone at $115,200–$115,800.
This area will act as support and provide a second long opportunity.
target: around $122k

BTC Weekly Update -as of Jul14🕰 Timeframe:
📆 Date:
🔎 Market Overview:
💼 Massive Institutional Inflows:
▪️ Over $1.1 billion in net capital inflows have entered spot Bitcoin ETFs in recent days, bringing the total weekly inflows to $2.72 billion so far.
▪️ The total assets under management (AUM) across all Bitcoin ETFs now exceed $150 billion, representing over 6% of Bitcoin’s total market capitalization.
⚖️ Favorable Political and Regulatory Support:
▪️ The ongoing Crypto Week in Congress is reviewing key legislative proposals like the Genius Act and the Clarity for Digital Assets Act, both of which offer promising regulatory clarity for the crypto industry.
▪️ Additionally, former President Trump’s executive order to establish a “Strategic Bitcoin Reserve” signals strong official political support for Bitcoin adoption.
📊 On-Chain & Sentiment Indicators
📦 Exchange Reserves:
Bitcoin reserves on centralized exchanges are at their lowest levels in years, suggesting a trend toward long-term holding (HODLing) and reduced selling pressure.
🧠 Fear & Greed Index:
The sentiment index remains firmly in the “Greed” zone, even hitting its highest level since May, indicating strong bullish sentiment among retail and institutional investors.
🌀 Whale Activity:
Whale wallets continue to show heavy accumulation, with large and steady transfers into private wallets, further supporting a bullish on-chain trend.
📈 Technical Setup
🔵Trend: Ranging upward
🔸 Key Support: 118,000➖ 115,000
🔸 Key Resistance: 125,000➖ 130,000
🔸 Indicators Used: RSI above 70
🧭 Next Week – Key Points
🔹 Watch for the outcomes of Crypto Week legislation in Washington — this will be a key driver for market direction.
🔹Monitor ETF capital inflows — if daily inflows stay above $500M, the bullish trend will likely strengthen.
🔹 Track the Federal Reserve's interest rate policy and the USD outlook, especially in response to inflation or other macroeconomic factors.
🔚 Summary: Final Analysis
📌 After reaching a new all-time high above $122K on July 14, Bitcoin’s bullish trend has strengthened. Strong institutional inflows and political support have reinforced the foundation for growth.
● Key Level Ahead: $125,000
● Outlook: If price consolidates above resistance, we could see a move toward $135K and beyond.
● Weekly Bias: Bullish, with potential for a pullback before continuation upward.
✅ If you like this analysis, don't forget to like 👍, follow 🧠, and share your thoughts below 💬!

BITCOIN → Stopping after the rally? What next? 125K or 110K?BINANCE:BTCUSDT rose and updated its historical maximum to a new record of 118K with “kopecks” (different prices on different exchanges). Now the price has supposedly stopped and entered a consolidation phase, but it is too early to draw any conclusions based on this alone...
Fundamentally, Bitcoin rose following the SP500 and NQ100 indices. The reasons are clearly geopolitical. The correlation level is not high, but the flagship is following the stock indices, which are also updating their historical highs.
Technically, Bitcoin has emerged from a two-month consolidation and entered a realization phase. So what's next? Continuation of the phase or correction? Let's take a look.
On the daily chart, I would highlight two zones. The risk and sell zone is below 117,500. If the price closes below this zone today/tomorrow, we will most likely be able to look for signals for a possible correction. As part of the correction, we can expect a decline to 115,500, 114,300, or even to the old ATH of 112K.
The second zone is the buying zone. A closing price above 118,400–118,900 and consolidation with the gradual formation of a breakout of structure may hint at a possible continuation of growth toward psychological targets.
Resistance levels: 118,400, 118900
Support levels: 117100, 116700, 115500
In the chart above, I have highlighted the situations, levels, and zones that interest me more precisely.
Now I am waiting for Bitcoin to retest resistance or support and confirm certain levels, based on which decisions can be made. I think that in the near future, Bitcoin will show us where it is headed. Updates will be published as something interesting emerges...
Best regards, R. Linda!

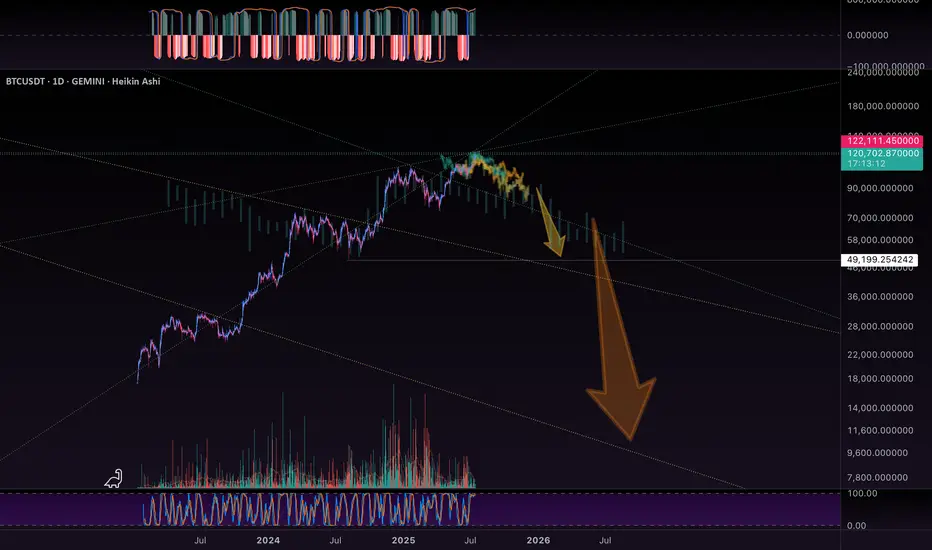
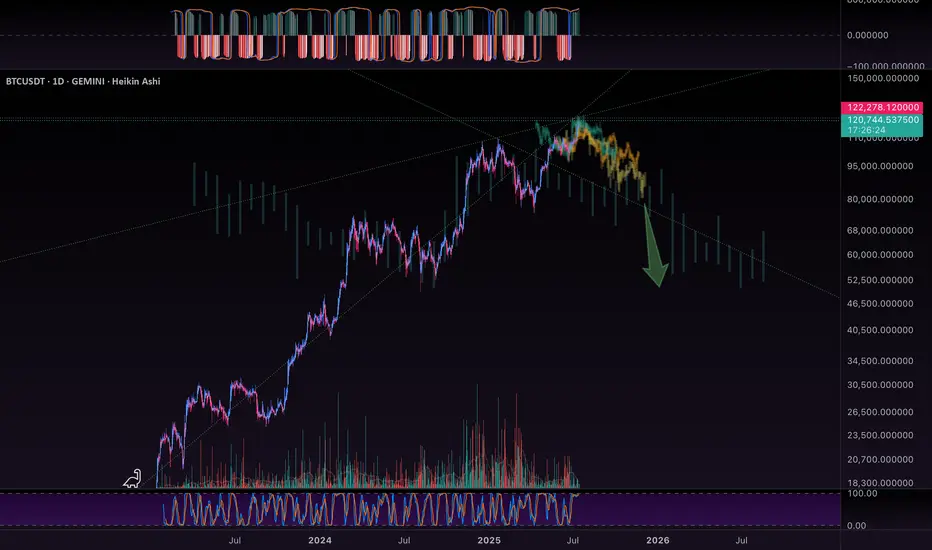
Just Two Months Left: Navigating Bitcoin and Global ChangesGreetings to everyone reading these lines! Today, I want to share with you not just an analysis, but my personal reflections and feelings about the current situation in the financial and cryptocurrency markets, especially regarding Bitcoin.
Many of you already know that I have always been a firm believer in Bitcoin’s market cycles. Right now, we are approaching the final stage of another such cycle-the distribution phase. The past few months have seen considerable turmoil: Trump's election, escalating conflicts between India and Pakistan, Israel and Iran, rising tensions between Russia and Ukraine, and not to mention China’s increasingly assertive geopolitical moves. I can't shake the feeling that the world stands on the threshold of something significant, perhaps serious. I sincerely hope I'm mistaken, but signs of a global conflict or a substantial reset in the world order are undeniably in the air.
History shows us that after major upheavals and wars, the world undergoes profound changes. It seems we are nearing such a pivotal moment within the next couple of months. For a long time, I've highlighted September 2025 as a critical point in the current market cycle, and now everything confirms this scenario.
In these unstable times, participants in the financial markets face both risks and tremendous opportunities. The distinguishing factor today is the rapid integration of artificial intelligence into all areas of life. I firmly believe that if you don't begin incorporating AI into your activities now, you risk being left behind. Personally, I'm actively integrating artificial intelligence into my professional processes and everyday life, as I see it as inevitable in our near future.
Regarding the cryptocurrency market, I'll be frank: the past couple of years have significantly changed it and even somewhat disappointed me. Liquidity has become diluted, and the market has clearly become seasonal, with brief periods of explosive growth followed by long downturns. This has led me to return to trading Forex and gold, where the market is more transparent and predictable.
Many crypto projects that seemed promising in 2017 are now nearly forgotten and stagnating. Think of Dash, EOS, Litecoin, ZCash, and others-they haven't disappeared entirely, but they no longer play significant roles in the market. The battle for user attention has become overly aggressive, and competition has devolved into chasing short-lived hype. Nevertheless, there are exceptions, such as Solana—a project that achieved success thanks to a fortunate combination of factors. Yet such projects remain exceedingly rare.
Today, I see the most promising and powerful trend as the tokenization of real-world assets (RWA). It doesn’t matter so much which blockchain will be used-the concept itself has already proven effective. While this journey won't be easy, the involvement of giants like BlackRock indicates the trend is sustainable and promising in the long run.
Overall, I am confident that financial markets and digital currencies will continue to evolve and grow. However, in about two months, I plan to adopt a bearish stance. Unfortunately, there are few signs of a quick global economic recovery. The world needs significant restructuring and changes-new rules and agreements are inevitable, and the coming year promises many notable events.
Ask yourself: Are you ready for these changes? Are you prepared to adapt to new conditions, technologies, and realities? Personally, I'm fully ready, which is why I remain active in the market, continuing to share my thoughts, assist, and engage with each of you. If you have questions, ideas, or proposals for collaboration, I am always open to dialogue and eager for any interaction.
I sincerely thank each of you for your support, comments, and attention to my posts. I stay here because I believe in the enormous opportunities available even in the most uncertain times. We have an exciting journey ahead, and I invite you to travel it together with me.
Wishing you success, profits, and above all, peace and kindness on our planet. The time of change is already here. Let’s meet it together.
Warm regards,
Your EXCAVO.

BTC - Historic Levels to CheckBTC has some checking in to do…. On historic resistance levels…
I drew in the major ones visible on this chart… and the initial bearish fractal, which was shown to us previously int he chart.
It will fractal for each arrow.
Pump and Dump!
Im going to run my DOGe.
See my linked post below for a bigger picture view of all this.
BTC - Topping outWow.. and look at those beautiful harmonic pattern fits! My eyeballs are so pleased with my work! Hehe!
These aggressive monsters like to propagate and fractal…
I met with another wizard of the charts yesterday… forecasted BTC to $5,000 !!! Holy crap!
Are you getting FEARFUL yet? Or still feeling GREEDY?
This is gonna be fun!
Check my linked idea for more insights.
It is possible that Bitcoin is finishing wave 4It is possible that
Bitcoin is finishing wave 4
Will expand to wave 5
The target is more than 250,000 dollars

btc buy longterm"🌟 Welcome to Golden Candle! 🌟
We're a team of 📈 passionate traders 📉 who love sharing our 🔍 technical analysis insights 🔎 with the TradingView community. 🌎
Our goal is to provide 💡 valuable perspectives 💡 on market trends and patterns, but 🚫 please note that our analyses are not intended as buy or sell recommendations. 🚫
Instead, they reflect our own 💭 personal attitudes and thoughts. 💭
Follow along and 📚 learn 📚 from our analyses! 📊💡"

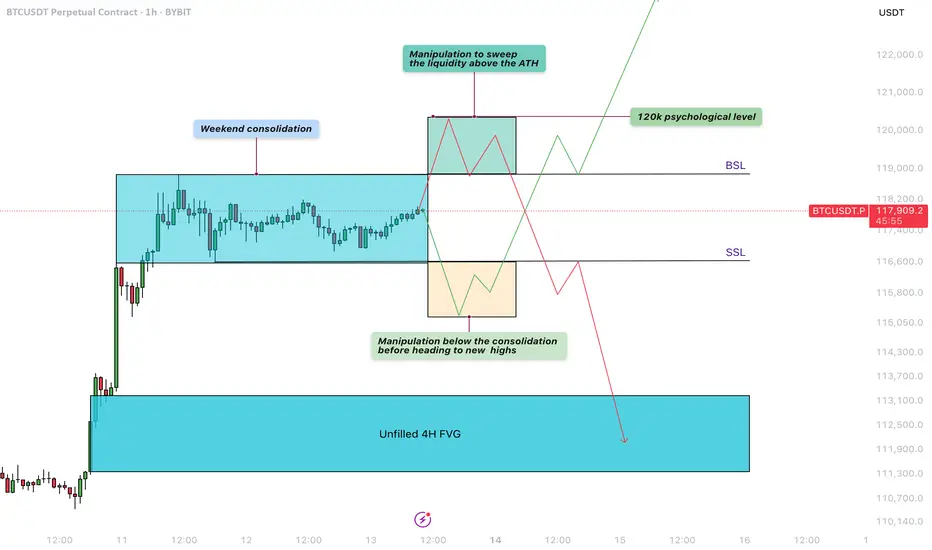
Bitcoin - Liquidity sweep before the next move!Weekend Consolidation
During weekends, Bitcoin often moves sideways as institutional players step back and retail traders prepare for the next move. During this consolidation phase between $117.000 and $119.000, liquidity builds up on both sides—sell-side liquidity below the range and buy-side liquidity above it. After these weekend consolidations, Bitcoin typically sweeps one side of liquidity before continuing in the opposite direction.
Manipulation Above the Buy-Side Liquidity
A significant amount of liquidity has formed just above the all-time high, right below the $120,000 level. Retail traders are positioning for a potential downward move, making this area a prime target for a liquidity sweep. This aligns perfectly with the psychological barrier of $120,000, a level where many traders are likely to take profits.
Manipulation Below the Sell-Side Liquidity
Over the weekend, traders are entering both long and short positions while placing stop-loss orders just below recent lows. This behavior creates a buildup of liquidity underneath the range. Bitcoin could dip below these lows to stop out retail traders before reversing to higher levels.
4-Hour Unfilled Fair Value Gap (FVG)
If Bitcoin sweeps the all-time high and enters a distribution phase, there’s a strong chance it will retrace to fill the unfilled Fair Value Gap on the 4-hour chart at $113.000 - $111.000. This imbalance was created during a sharp move up, leaving behind unfilled orders. Such levels often get revisited as price action seeks to rebalance.
How to Execute This Trade
Wait for Bitcoin to sweep either the low or the high of the weekend range. Avoid entering the market immediately after the sweep. Instead, wait for confirmation that price is returning back inside the range, signaling a clean sweep. On lower timeframes, such as the 5-minute chart, you can look for entry models like an inverse Fair Value Gap to refine your entry.
Final Thoughts
At this point, it’s unclear which direction Bitcoin will take next. The best approach is to wait for a clear liquidity sweep and signs of a reversal before entering any trades. That said, there’s a possibility we may first move up to test and claim the $120,000 psychological level before revisiting and filling the lower 4-hour imbalance zones.
Thanks for your support. If you enjoyed this analysis, make sure to follow me so you don't miss the next one. And if you found it helpful, feel free to drop a like and leave a comment, I’d love to hear your thoughts!
Bitcoin Weekly Chart Outlook – Retrace Expected at 125KBased on the Bitcoin weekly chart, I’ve noticed a repeating pattern where Bitcoin tends to reach a short-term top or enters a retracement phase at every $25,000 level — $25K, $50K, $75K, $100K.
If this pattern continues, my projection is that Bitcoin could reach its next significant top or retrace zone around $125,000. This level could act as a psychological and technical barrier, attracting profit-taking and triggering a correction.
While this is not financial advice, it’s a structure I’m closely watching as the market unfolds.
What do you think? Let’s discuss.

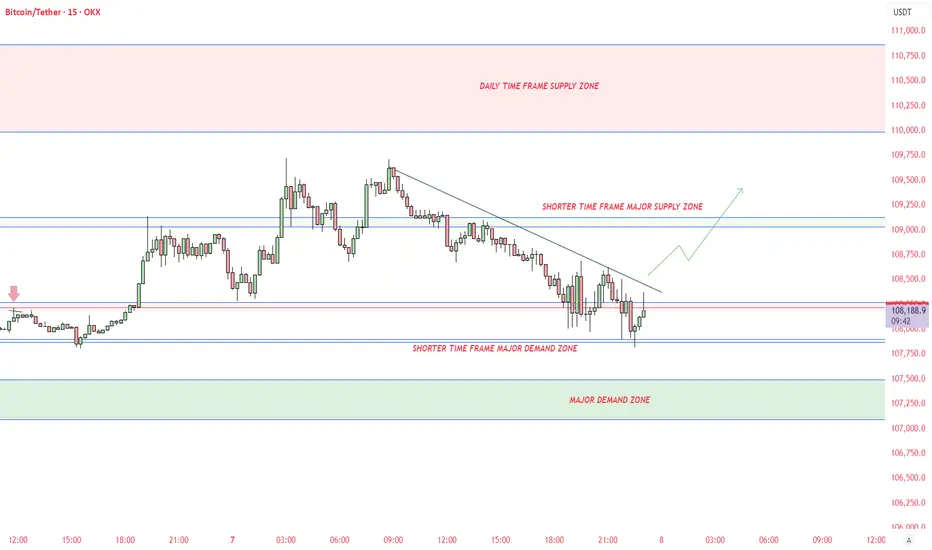
BTCUSDT - MOSTLY UPTREND DIRECTIONAll supply demand zone identified.
May breach till 110000$. Please do your own research before taking any trades
Bitcoin's Macro View: The Next Major Resistance ZoneAnalysis of the Daily Chart
This is the daily (1D) chart for Bitcoin (BTC/USDT), which shows the "big picture" trend over many months.
1. The Significance of the Breakout
You are correct to highlight the breakout. After consolidating for months and forming a solid base since April 2025, Bitcoin has now decisively broken out to new highs for the year. This is a very strong bullish signal on a macro scale, indicating that the long-term uptrend is accelerating.
2. The Immediate Resistance: The Green Zone ($128,000 - $132,000)
After such a powerful move, the next major obstacle is the area marked by the green box on your chart.
What is this zone? This area, approximately between $128,000 and $132,000, represents a major historical resistance or supply zone.
Why is it important? This is likely a price level where significant selling occurred in the past. As the price returns to this zone:
Traders who bought at the previous top may look to sell to get their money back ("break-even selling").
Bulls who have been riding the trend up from the lows may see this as a logical area to take profits.
New sellers may view it as an opportune level to open short positions.
What to Expect
When the price enters this key zone, we can expect a significant reaction. It is the next major battleground between buyers and sellers. Watch for:
A slowdown in the upward momentum.
A period of consolidation or sideways price action.
A potential rejection or a significant pullback from this area.
A clean and powerful break above this $128k - $132k zone would be an exceptionally bullish event, signaling a high probability of continuation towards new all-time highs.

Why This Breakout Feels Like $29K and $48K – Big Moves Ahead?🤔📊 Why This Breakout Feels Like $29K and $48K – Big Moves Ahead? 🚀📈
Hey everyone! It’s Saturday, July 12th , and while the markets take a breather, it’s the perfect moment to zoom out and assess the bigger picture . Are we in for another retail weekend surge?
Let’s break it down 🔍👇
After closely analyzing the charts, one thing becomes clear — this breakout is structurally similar to the previous key breakouts at $29K and $48K. In both historical cases, price surged significantly without immediately retesting the breakout level.
➡️ Back in 2020, price exploded +144% above the yellow level before ever coming back to test it.
➡️ At $48K, a similar move of +49% occurred before signs of exhaustion and a retest emerged.
Fast forward to today: We've just broken above a massive ascending support zone — $114,921–$115K — and the market shows no intention of pulling back yet. This tells us something powerful: Momentum is in control.
💡 According to my technical roadmap, we may not see a retest of $115K anytime soon. Instead, the next target zone lies around $182K–$189K, depending on velocity and sentiment. With halving-to-ATH cycles historically lasting ~550 days, we’re well within that bullish window.
Remember the channel support/last entry right after the Iran-Israel ceasefire on June 23rd? That’s been a defining entry and it’s still playing out beautifully. So we wish for geopolitical stability and peace.
So, while it’s easy to feel left out — don’t short, don’t sulk. This may be our moment to ride the wave long. 🎯📉📈
One Love,
The FXPROFESSOR 💙
Disclosure: I am happy to be part of the Trade Nation's Influencer program and receive a monthly fee for using their TradingView charts in my analysis. Awesome broker, where the trader really comes first! 🌟🤝📈

Btc usdt idea I think Btc will top around 140k and alt season will start at the distribution phase . we are so close for the money to start moving to the eth and other alts . pick wisely the time will arrive very quickly
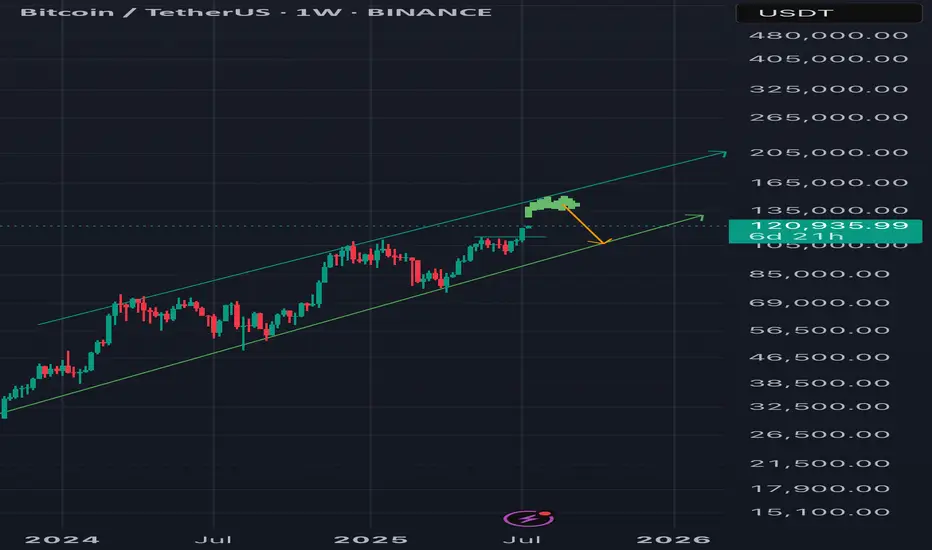
Bitcoin Crash? No! The Bullish Wave Starts Now! $155,601 Next!Some people are still expecting for "Bitcoin to go down." Poor bastards, the advance is just starting. Bitcoin just broke out of a 210 days long consolidation phase. After this huge, long-term consolidation, expect a major advance. Next target is now set at $155,601.
This week is the first week green after the consolidation finally ends. The market was sideways for seven months, with some fluctuations, and the result is a bullish breakout. Why a breakdown? Why expect a drop? If the market just broke up—think about it—why would it go down?
If resistance is confirmed; you remember the range between $100,000 and $110,000. If resistance is confirmed then Bitcoin would start crashing down from $110,000. If the break of $110,000 does happen and Bitcoin moves to $112,000 as a bull-trap, then you would expect a major crash happening from $112,000 and no more. But, reality is saying, showing, something much different. We have a major advance. Resistance has been flipped into support.
Now, the first that is needed is the weekly close. It is still very early into this move but Bitcoin is showing maximum strength. Remember the altcoins? These confirm that the advance is just new, early, because these are recovering from all-time lows or major lows. There is still plenty of room for growth.
My people, wake up! Bitcoin is going up.
The next target is $155,601 and it can go higher, this is only the mid-term target based on the long-term. When Bitcoin consolidates for 7 months, it tends to grow some 137% on average, it can be less but it can also be much more. And it tends to grow at least for 1-2 months, but this also is just the average, Bitcoin can grow straight up for 4 months.
So, are you still bearish?
Oh please no! The bulls already won.
The 2025 bull market final phase starts now, soon you will experience a marketwide bull-run. We have not seen the euphoria phase, this is only the start. Prepare for additional growth.
I am calling out all of the bears, never bet down on Bitcoin; Bitcoin is going up.
Namaste.

Btcusdt 4hr timeframe, bullish iH&S patternComming from shorters take profit area, formed a bullish ih&s pattern. If closes above 108725 in 4hr time, may activate the pattern.
Targets are 111500, 115000 and 120000
Invalidation if closes below 105k

Bitcoin's Next Move: Planning the Counter-Trend ShortThis 30-minute BTC/USDT chart provides an excellent case study. After successfully identifying and trading the breakout from the consolidation range (highlighted in the brown box), the focus now shifts to a new, potential trade setup.
Asset: Bitcoin / TetherUS (BTC/USDT)
Timeframe: 30-Minute
Recap: The price has powerfully broken out of its previous range, a move that was anticipated and resulted in a successful long trade.
Current Situation: Following the strong, nearly vertical rally, the price is approaching the psychological $120,000 level. Runs like this are often followed by a period of profit-taking or a short-term pullback.
The New Trade Plan: A Bearish Setup
The chart now displays a new short position setup. This is a bearish, counter-trend trade designed to profit from a potential price rejection.
Strategy: To sell or "short" Bitcoin at a higher price, anticipating a pullback. This is a riskier strategy than trading with the trend, but it's based on the idea that the sharp rally is due for a correction.
The Setup is as follows:
Entry (Sell): $120,222.31
Take Profit (Target): $119,323.25
Stop-Loss (Invalidation): $120,579.09
In summary, after the breakout rally, the plan is to watch for signs of exhaustion. If the price pushes up to the $120,222 level and gets rejected, this trade aims to capture the resulting downward move towards the $119,300 area. The stop-loss is placed tightly above to manage risk in case the powerful uptrend continues without pausing

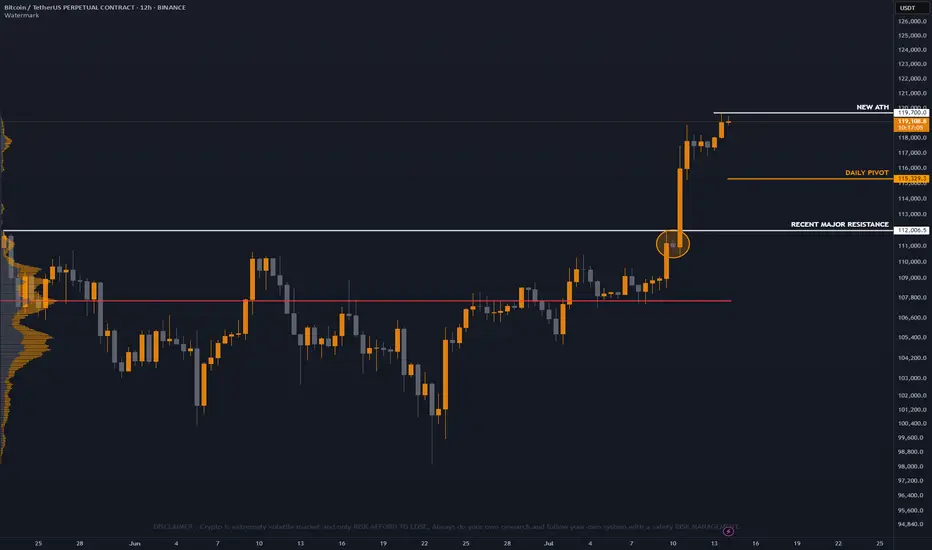
Bitcoin Update H12 Timeframe
New All time high unlocked again this time at 119700 area ! 🚀
Take note panda fam there's a unfilled gap below on bitcoin price still consider correction below is still possible, Above ATH price is discovery price panda fam.
But as of now since BTC is on fire and hype, Buyers volume are still strong this time, Trade safe always panda fam will focus on altcoins scalp trade. 🔥

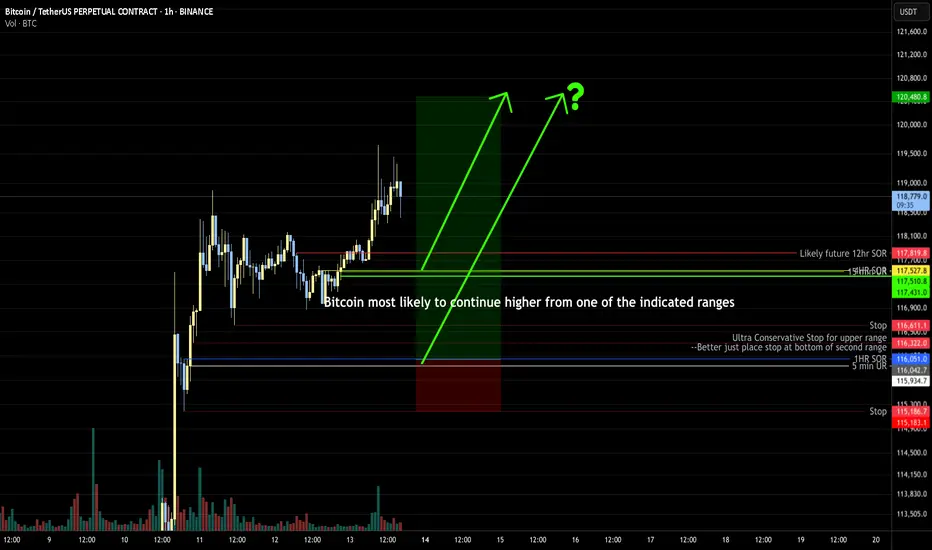
Bitcoin Overall: higherBitcoin most likely to continue higher from one of the indicated ranges. It may be best to split a trade 1/2 entry on one and 1/2 entry on other with stop below the second, or 2 trades with 1/2 normal risk.