#BTC Potential Trading Opportunities📊#BTC Potential Trading Opportunities🔥
🧠We've been trading sideways for quite some time, and selling pressure has largely been exhausted, so we need to find support to enter a long trade.
➡️From a structural perspective, there's a chance for a bullish head-and-shoulders pattern to form. If this pattern holds, we could see a move above $120,000 or even higher.
Potential support is likely between $116,300 and $117,000.
Short-term resistance is around $120,000.
⚠️Note: A break below L1 would destabilize the structure and significantly reduce bullish expectations.
🤜If you like my analysis, please like 💖 and share 💬 BITGET:BTCUSDT.P
USDTBTC trade ideas

BTC Accumulation, Bullish Breakout Signs💎 BTC PLAN UPDATE
1. Key Chart Features:
Currently, the BTC/USD price is at $118,893.
The chart shows a strong upward trend recently, and we are seeing accumulation with short-term corrections.
2. Fibonacci Levels:
The Fibonacci retracement levels are drawn from the lowest point ($114,460) to the highest point ($119,809).
At the moment, the price is hovering near the 0.5 retracement level ($113,000), which is a key support level.
If the price holds above this level, a rebound is likely.
3. Trendlines and Price Patterns:
The trendlines (dashed blue lines) are indicating a descending triangle pattern, which could lead to a breakout if the price surpasses resistance levels.
A potential Head and Shoulders pattern might be forming, though it is not yet clear and needs confirmation by breaking key resistance.
4. Breakout and Retest Zone:
The breakout zone (red area) is around $119,000.
If the price breaks and holds above this level, we may see a continuation of the uptrend toward the next target around $122,792 (Fibonacci 1.618 level).
After the breakout, the price might retouch (retest) this support area before resuming the upward movement.
5. Technical Indicators:
• Moving Averages (MA):
• The red MA (long-term) is below the current price, indicating a strong uptrend.
• The yellow MA (medium-term) is near the current price, providing support for the uptrend if it holds.
• RSI Indicator:
The RSI has not yet reached overbought levels, suggesting that the market still has potential to rise without being overheated.
6. Conclusion:
If the price breaks above the $119,000 resistance and maintains that level, BTC/USD could continue its strong bullish trend, potentially targeting $122,792 or even $127,941.
Note: If the price fails to hold above $119,000 and drops back below, a pullback to the nearest support level at $114,460 may occur.

Accumulate waiting for btc price increase💎 BTC PLAN UPDATE – End of July (31/07)
📊 BTC Technical Analysis (4H Timeframe – End of July)
✅ Positive Signals:
• BTC has broken out of the consolidation triangle pattern (blue diagonal line), indicating a potential strong uptrend.
• The current price is retesting the breakout support zone around 117,800–118,000 → showing a good reaction and creating upward momentum.
• MA50 and MA200 are starting to slope upwards → confirming increasing buying strength.
📈 Bullish Scenario:
• If BTC holds above 118,000, it is likely to move toward the nearest resistance zone at 119,900.
• After breaking 119,900, the next targets are:
→ 122,792 (Fibonacci 1.618)
→ Further target: 127,900 (Fibonacci 2.618)
🛑 Risk Note:
• If the price drops below 117,000, it’s important to monitor again, as it may retest a deeper support zone around 114,500.

BTCUSD LongWe´re in a bigger bullish 5wave structure. Right now we´re in the 4th wave and could have completed a ABC correction. On 15min Chart we can see, that we just formed the 1st wave to start the 5th wave in the bigger structure
daily #bitcoin analysisBitcoin is fluctuating between the two price areas of $115,000 and $120,000 and I don't think it will trend either up or down anytime soon. Unless it breaks the two mentioned areas from above or below. As we can see, the new RSI indicator also shows a sideways trend. This analysis is not a financial recommendation in any way.

The Only Bitcoin Chart You NeedUnderstanding Price Action is essential for successful trading as it allows traders to interpret market dynamics and make informed decisions based on pure price movements. By focusing solely on price movements, traders can eliminate noise and distractions caused by indicators or external factors, leading to a clearer understanding of market trends and patterns.

BTCUSD going to touch 116,800BITSTAMP:BTCUSD Long trade, with my back testing of this strategy, BTCUSD need to touch 116,800
This is good trade, don't overload your risk like greedy, be disciplined trader, this is good trade.
Use proper risk management
Looks like good trade.
Lets monitor.
Use proper risk management.
Disclaimer: only idea, not advice

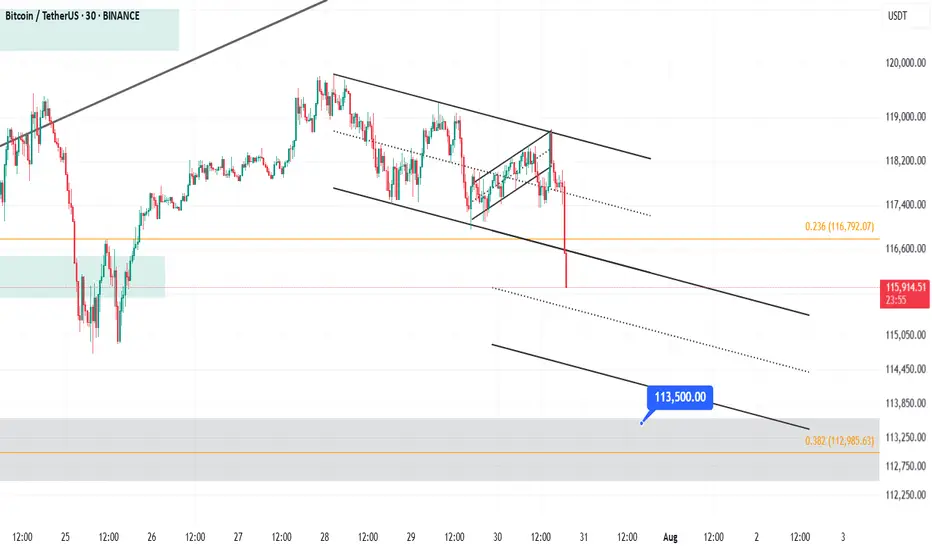
Quick Bitcoin Analysis – 30-Minute TimeframeQuick Hey friends 👋
Bitcoin was recently moving inside a weak upward channel on the 30-minute chart. But now, it has broken below the channel with a strong bearish candle. This suggests we’re entering a short-term correction.
🔹 However, don’t forget — the overall trend is still bullish.
This drop looks more like a healthy pullback, not the start of a full downtrend.
🎯 Possible Targets for This Correction:
✅ Target 1: Around $114,500
(This comes from measuring the width of the broken channel.)
✅ Target 2: Strong support near $113,500
(This level has shown solid buyer interest in the past.)
📊 The RSI is also approaching the oversold zone, which means we might see a small bounce or slowdown in the drop soon.
📌 In short:
This is likely just a dip in a bigger uptrend. Be patient, watch key support zones, and don’t rush into trades.
Always stick to proper risk management! 💼
Bitcoin Analysis – 30-Minute Timeframe
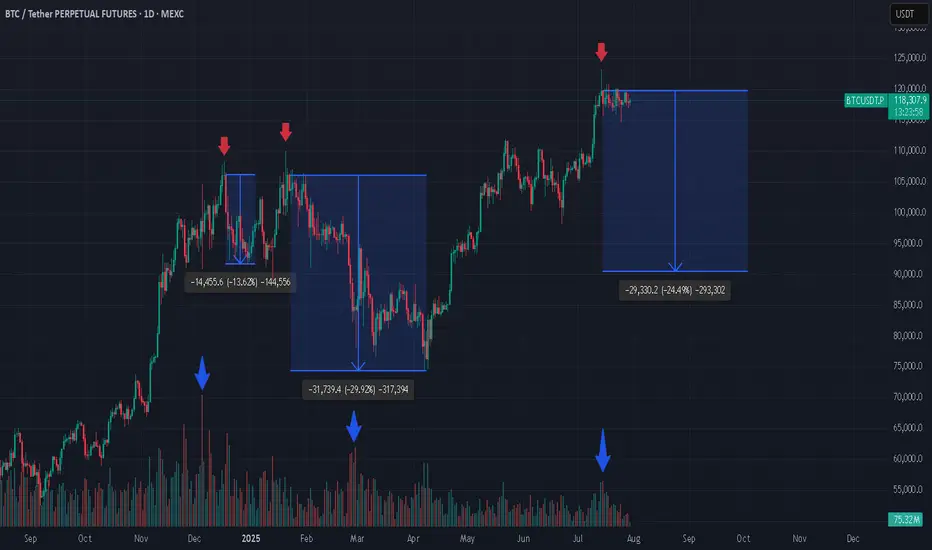
3 Bitcoin Tops, Weak Green Candles, and What’s Next? If you're closely monitoring the Bitcoin (BTC) market, patterns often begin to reveal themselves in surprising ways. In the attached chart, I’ve highlighted three major local tops that Bitcoin has made, each marked by a weak green daily candle. What’s even more striking is what comes next: a dramatic increase in trading volume, followed by steep corrections.
Spotting the Pattern: Weak Green, Heavy Volume
At each pointed top (see red arrows), BTC formed an all-time high (ATH) with a relatively weak green candle, hardly the sign of euphoric buying strength.
Look closely at the volume bars below (blue arrows). Each time, as price struggled to push higher, volume surged after the top, often a signal of major sellers stepping in or longs closing en masse.
What followed? Significant corrections: -13.6%, -29.2%, and, now it might be shaping up for another potential drop (-24.1%) if history rhymes.
Why Does This Matter?
From a technical analysis perspective, volume is the fuel behind price moves. When a new high is reached with limp buying (weak green candles) but is swiftly met with rising volume on the way down, it’s a classic sign of distribution, a strong hand selling into retail euphoria.
Is Another Drop Coming?
Given the consistency in behavior, it’s not unreasonable to ask: are we about to witness another similar correction now that BTC has again hit a top with a weak green candle and volume is ticking up? The historical evidence certainly makes it plausible.
Long-Term Perspective: Still Bullish
Despite these corrections, my long-term outlook remains bullish. Every cycle has corrections, they’re opportunities for healthy consolidation, allowing strong hands to accumulate and the market to reset for its next leg higher.
*not investment advice
#crypto #btc #bitcoin #finance #trading
Overhyed Punishment This is what happens when everyone starts to fomo.
Lucky things, I sold some of my Altcoin with profit when BTC went into overbought band as in my chat.
BTC is bearish as long as below 117.6 to 118k :) . Good luck

BTCUSD : Long levelHere is a great entry point for those who scalp this instrument or pips. The level is marked with a green arrow. It will be active until I report. It may become inactive over time.
Watch out for trading on the news.

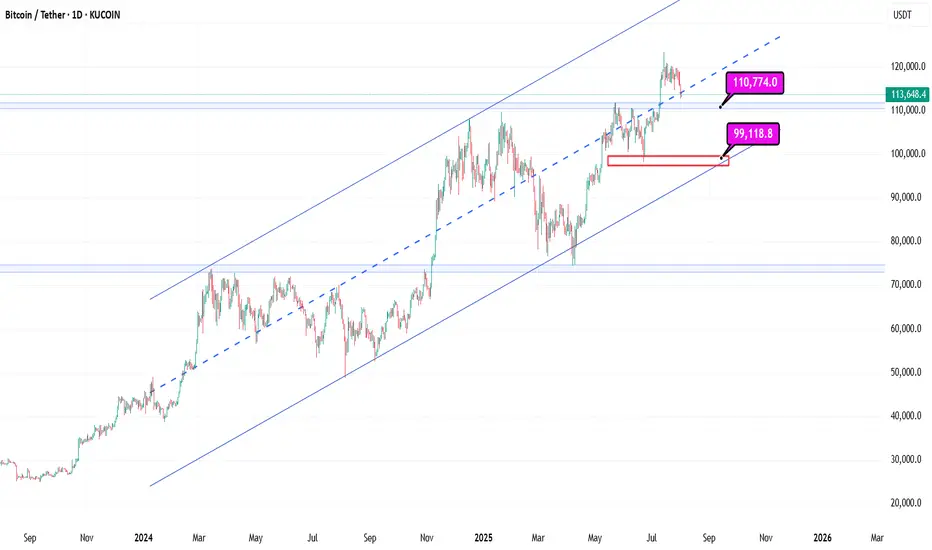
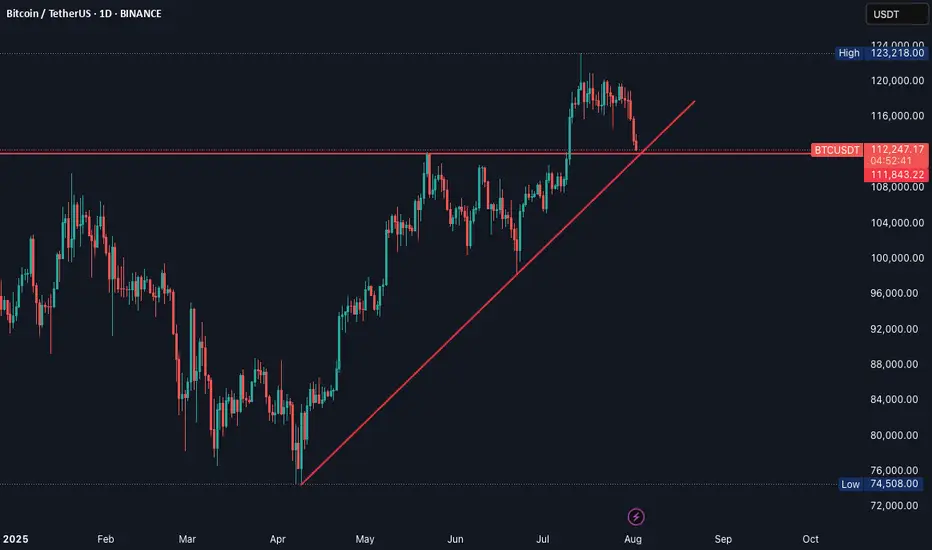
Bitcoin Support: Midline Channel Support at 114kBitcoin
1D
Bitcoin Support: Midline Channel Support at 114k and then Blue Line 110k
With these supports holding in the long term, progress is still possible
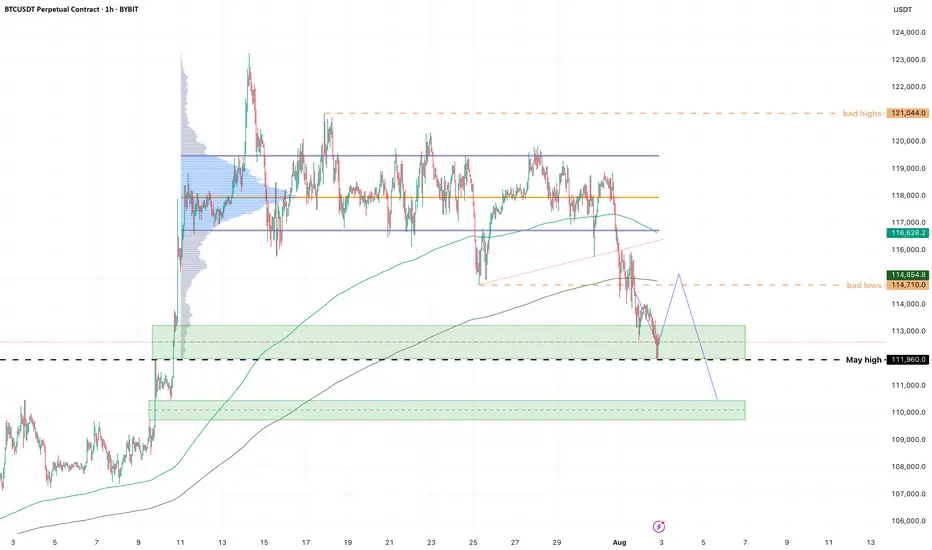
BTC - HOOOLLDDD!!!!Looks like we got our downside first.
Short update, but important level to watch is that 112k high from May this year. I longed on a ltf low hold, looking for a bounce into the highs of this sell-off cluster, then see what's what.
Flow is still very heavy; I expect to get stopped on this but it's one of those setups I just have to take, or I kick myself tomorrow.
BTCUSD As I prepare for the continuation of the weekly Bitcoin bullish trend, I foresee a potential price retracement down to the 109k zone. This dip could offer a valuable opportunity for a robust bullish continuation, setting the stage for upward momentum in the market. The anticipation of this movement encourages a strategic approach, as we watch for signs of strength and confirmation in buying pressure. I'm preparing to capitalize on the ongoing weekly bullish trend in Bitcoin. I anticipate a price retracing to 109k zone, which could provide a strong opportunity for bullish continuation

BTC- On a Crucial Testing PointBTC Seems to be testing a strong support point, if it bounce back , it's good opportunity to buy, otherwise sell.
BTC Potential Bullish continuation to a new ATH BTC Looking Bullish after the Pull back .we anticipating a bullish continuation from 114.600 to the high 122k and above. If you trade risk management is a must so you don't get caught up in the volatility of the crypto Market. #Btcusd

Bitcoin Correction Maturing – Long Setup Brewing!Bitcoin ( BINANCE:BTCUSDT ) has fallen by more than -4% over the past day.
Let's take a look at the reasons for the decline.
One of the key reasons behind Bitcoin’s decline in the past 24 hours ( July 25 ) could be the reduced likelihood of Jerome Powell being replaced as Chair of the Federal Reserve.
In recent days, market participants were speculating that Donald Trump might replace Powell — a scenario that was considered bullish for risk assets like Bitcoin. However, recent reports of a meeting between Trump and Powell, and signs that Powell might not be dismissed, have weakened this fundamental narrative.
This meeting may signal a truce or reduced tension between Trump’s team and Powell , which could imply a continuation of current Fed policies. That’s bad news for Bitcoin, as it removes a potential psychological tailwind from the market and dampens speculative sentiment.
As a result:
Over $500 million in liquidations(Long Positions) occurred
Weak inflows into Bitcoin ETFs
A stronger U.S. Dollar Index ( TVC:DXY )
And declining Gold( OANDA:XAUUSD ) prices over the past two days
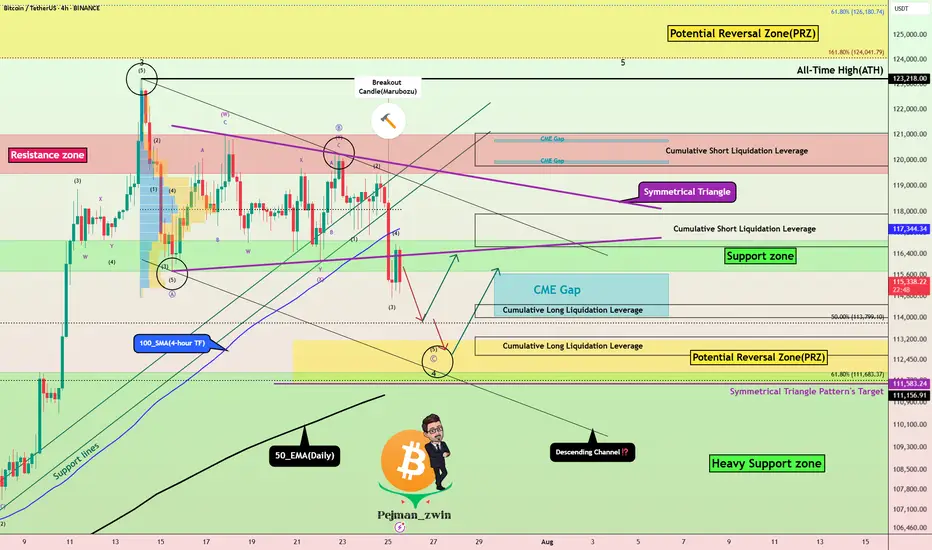
all added additional selling pressure on BTC. Now let's take a look at Bitcoin's conditions on the 4-hour time frame .
Bitcoin currently appears to have broken the Support zone($116,900-$115,730) , Support lines , 100_SMA(4-hour TF) , and the lower line of the Symmetrical Triangle Pattern with a bearish Marubozu candle .
Note : In general, trading was difficult when Bitcoin was inside a symmetrical triangle (about 10 days).
It also seems that the pullback to these zones has ended and Bitcoin is waiting for the next decline .
In terms of Elliott Wave theory , Bitcoin appears to be completing microwave 5 of microwave C of major wave 4 . There is a possibility that main wave 4 will create a descending channel and complete at the bottom of the descending channel (at Potential Reversal Zone(PRZ) ).
I expect Bitcoin to start rising again after completing the CME Gap($115,060-$114,947) from Cumulative Long Liquidation Leverage($114,480-$114,000) or Cumulative Long Liquidation Leverage($113,284-$112,603) near the PRZ and Heavy Support zone($111,980-$105,820) .
Cumulative Short Liquidation Leverage: $117,904-$116,665
Cumulative Short Liquidation Leverage: $121,046-$119,761
Do you think Bitcoin has entered a major correction, or does it still have a chance to create a new ATH?
Please respect each other's ideas and express them politely if you agree or disagree.
Bitcoin Analyze (BTCUSDT), 4-hour time frame.
Be sure to follow the updated ideas.
Do not forget to put a Stop loss for your positions (For every position you want to open).
Please follow your strategy and updates; this is just my Idea, and I will gladly see your ideas in this post.
Please do not forget the ✅' like '✅ button 🙏😊 & Share it with your friends; thanks, and Trade safe.
Why Everyone’s Stop Loss Gets Liquidated?!!...Why does your stop loss always get hit first?
Is it possible that everyone else placed theirs exactly where you did?
Maybe it's time to face an uncomfortable truth about the market and crowd psychology.
Hello✌️
Spend 3 minutes ⏰ reading this educational material.
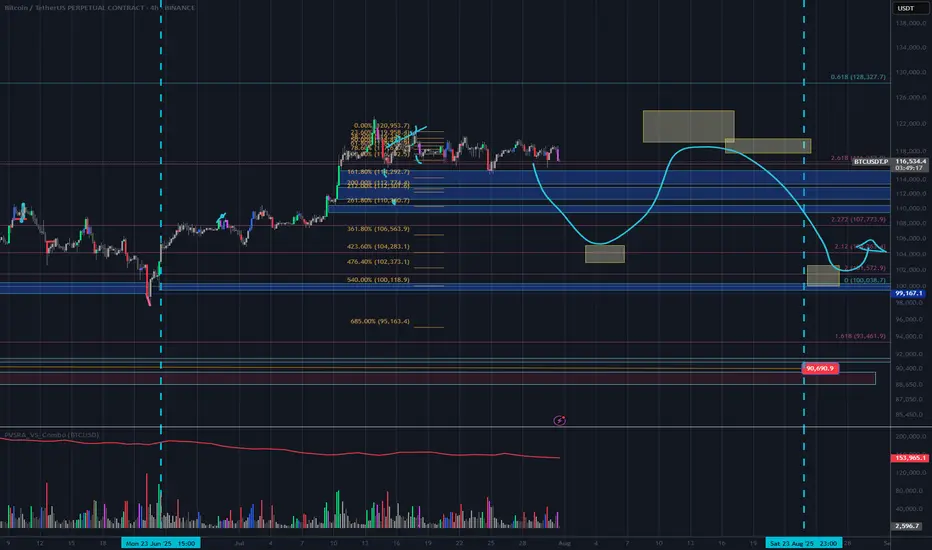
🎯 Analytical Insight on Bitcoin:
BINANCE:BTCUSDT has established a well-defined range in this zone, triggering multiple stop hunts and now approaching a fresh daily resistance. A confirmed breakout above this level could open the door for an 8% upside move toward the 128,000 area. 📈🧠
Now , let's dive into the educational section,
🎯 Crowd Psychology: The Fixed Target of the Market
In crypto markets, when everyone thinks the same, they tend to lose the same way. One of the clearest signs of this is where stop losses are placed. When a level becomes too obvious to too many traders, it becomes a magnet for liquidity hunters.
Public stop losses are usually placed right below obvious lows or above clear highs. These are areas that everyone has mentally marked as strong support or resistance. Ironically, that’s exactly where a sudden wick appears, takes out stops, and then the market goes right back in the original direction.
🧠 Your Brain Wants Safety, The Market Wants Liquidity
New traders search for “safe” places to hide their stops. That very logic makes those places unsafe. The market needs liquidity to move, and the most liquidity sits right where people feel safe placing their stops.
Remember: stop losses are actual market orders, buy or sell triggers. When yours gets hit, someone else enters a position. Your loss is their entry. This is a zero-sum game.
🐋 Whale Activity Before the Trap
Ever noticed how, just before your stop gets hit, there’s a small move in the opposite direction? That’s bait. Right after, a strong wick sweeps through, takes out public stops, then reverses. It’s not an accident. It’s planned.
If you observe these small shifts with suspicion rather than trust, you’ll often catch the trap before it happens.
💡 Your Trigger Shouldn't Be Where Everyone Else Sets It
There’s a smarter way to manage your stops, ways that avoid the obvious traps:
Use ATR to dynamically calculate distance
Place stops based on candle structure, not just price levels
Wait for confirmed reversal patterns before setting stops
Consider mental stops based on invalidation logic, not fixed price points
⛔️ Blind Trust in Repeated Zones
When a support or resistance level holds multiple times, people begin to trust it blindly. That collective trust becomes a weakness. The market doesn’t respect obvious levels, it exploits them.
If you see it, everyone else sees it. And so does the market. But the market plays a different game. You seek safety, it seeks liquidity.
🎲 Is It Really Your Fault?
Many traders blame themselves when their stop gets hit. The truth? You’re not the problem, your thinking pattern is. Most traders make the same decisions because they learned the same textbook strategies. That’s what makes their stops predictable.
It’s not always about poor analysis. Sometimes, it’s just about being part of the herd.
📉 Practical TradingView Tools to Track Public Stop Zones
Here are a few powerful TradingView tools and indicators you can use to figure out where stop loss clusters are likely hiding. Use them together for better accuracy:
Session Volume (Fixed Range)
Apply this tool to recent ranges or high-volatility zones. Peaks in volume often reveal where most traders are entering or exiting, which means stops are likely nearby.
Liquidity Pools Finder
This indicator estimates areas with potential liquidity pools. These are often the next targets for large moves.
Horizontal Ray or Box Tool
Use these to mark the areas just above highs and below lows. These zones are where most public stops typically sit.
Fair Value Gap (FVG)
Gaps in price action can act as magnets. It's no coincidence that public stops often get hit in these areas during fakeouts or trap moves.
📌 Final Thoughts
When everyone looks at the same level, the market attacks it. Public stop losses are a primary fuel source for liquidity-based moves. Use TradingView tools, train your eye, and place your stops where no one else dares. That’s how you stay out of the trap.
✅ Wrap-Up
If your stop always gets hit right before the big move, it’s not a coincidence, it’s a mindset issue. Stop thinking like the crowd, and the market will stop treating you like one.
✨ Need a little love!
We pour love into every post your support keeps us inspired! 💛 Don’t be shy, we’d love to hear from you on comments. Big thanks , Mad Whale 🐋
📜Please make sure to do your own research before investing, and review the disclaimer provided at the end of each post.

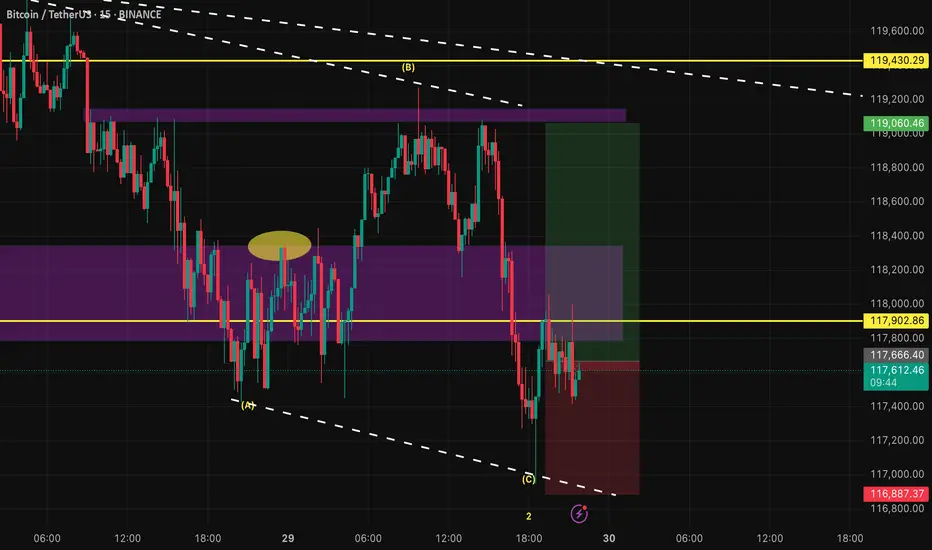
BTCUSD – Wyckoff Accumulation + Elliott Wave SynergyTimeframe: 1H
Title: "A textbook Wyckoff Accumulation with Elliott Wave Confirmation – Sign of Strength Next?"
This chart presents a textbook Wyckoff Accumulation structure seamlessly combined with Elliott Wave Theory, highlighting how the two methodologies can complement each other in timing and structural validation.
🔍 Wyckoff Accumulation Phases:
SC (Selling Climax) and AR (Automatic Rally) define the range.
ST (Secondary Test) and STB (Secondary Test in Phase B) confirm horizontal support.
A classic Spring and Test pattern occurs in Phase C, marked by a sharp downward probe below support (Spring), followed by a successful retest with no new low (Test).
The LPS (Last Point of Support) is forming above the Spring low and near the 61.8% Fibonacci retracement level, showing bullish absorption of supply.
The recent rally and pullback suggest we're entering Phase D, with the Sign of Strength (SOS) expected next.
🌀 Elliott Wave Alignment:
The Spring aligns with the end of wave (iv) of a larger impulse, and the structure unfolding from the Spring appears to be the start of wave (v).
The move from Spring to SOS shows impulsive qualities, labeled as wave (i), with the corrective pullback forming wave (ii), ending near the golden Fibonacci ratio (61.8%).
This alignment of wave (ii) with the LPS further validates the accumulation and sets the stage for a strong wave (iii) within wave (v), likely to coincide with a Sign of Strength breakout.
💡 Key Takeaways:
This is a classic Wyckoff Accumulation with all major phases visible: A to D.
Elliott Wave counts confirm the internal structure and suggest bullish continuation.
Watch for the SOS rally above resistance at ~120k to confirm the transition into Phase D/E and a potential trending move.
🔔 Conclusion:
Combining Wyckoff and Elliott Wave provides a high-probability setup. A successful break above resistance will signal the start of a trend phase. LPS offers a favorable risk-reward area, especially with wave (ii) possibly completing soon with a test of Fibonacci ratio (61.8%).

Targets and their point in timewe use the threshold breaks to determine targets AKA areas of liquidity. we also utilize pattern detection paired with the threshold breaks to validate cycles and where we are in said cycle.
its btc short according to mirrior concept A Bitcoin short position based on Fibonacci levels and market sentiment is a trading strategy to profit from a price drop.
It involves:
1. **Technical Analysis:** Using Fibonacci retracement levels (e.g., 61.8%) to identify a potential price reversal point after a bounce.
2. **Sentiment Analysis:** Confirming the reversal signal by checking for "extreme greed" in the market, which suggests overbought conditions and an impending correction.
A trader enters a short trade when both signals align, expecting the price to fall from that key resistance level.

Bitcoin Overall: Still Expecting new ATHIndicated are the supports I’m watching. If price goes below the ‘invalidation leg’ I consider the btc bull market to be over.

Bitcoin: Pennant - Bullish Continuation PatternI spotted a bullish continuation pattern called Pennant in Bitcoin chart
Support and resistance are marked with yellow trendlines
There is also a Flag Pole (white trendline)
The model is clean as we already see a bullish breakup and a textbook pullback
to the broken resistance.
The target is established at the height of the Flag Pole applied to the broken resistance
at $135k.
For final confirmation the price should overcome the top of breakout at $119,800
The invalidation point is located at the bottom of the Pennant at $114,700
