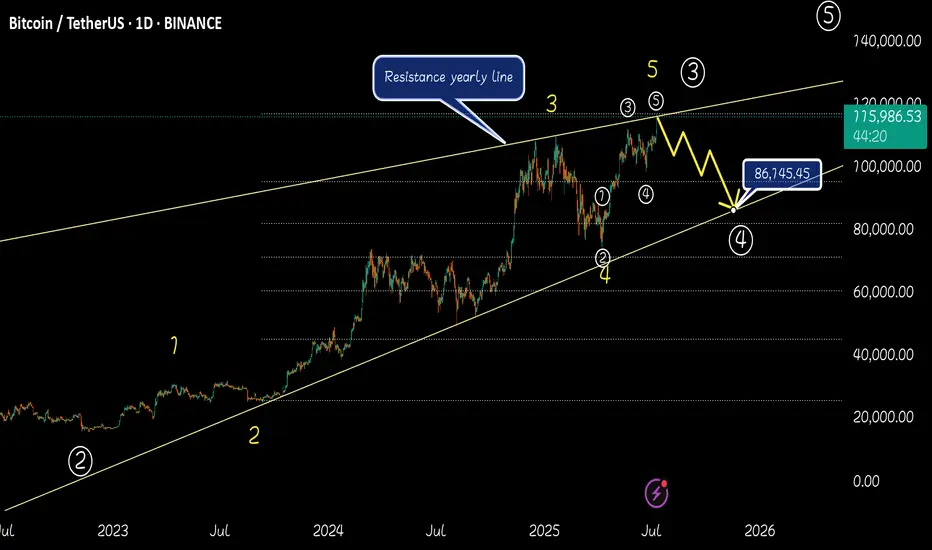
bitcoin - Time to buy again!As I mentioned, the price has started the third bullish wave and has shown good growth so far, with the bullish wave still ongoing. In my opinion, the price could rise to $127k, after which it may correct to form the fourth corrective wave.
previous analysis
USDTBTC trade ideas

Projected price targets for BitcoinAs long as the $108,400 level holds, the current market outlook remains bullish

BTCUSDT[BITCOIN]:Price is Likely to be Heading Towards $144,000.Recently, Bitcoin has shown extreme bullish price behaviour, and there’s no sign of bearish influence in the market. After monitoring the price since May 4th, we believe there’s a high possibility of price hitting the 120k region first. This could be followed by a small correction around 105k, where a strong bullish price influence will lead the price to our final target at 140k. Both fundamental and technical factors support this view, but it doesn’t guarantee the price will follow our expectations.
Before investing or trading cryptocurrencies, do your own research as they carry significant financial risk. This chart analysis is for educational or secondary purposes only.
Good luck and trade safely.
If you want to support and encourage us, you can do the following: ❤️
-Like the idea
-Comment the idea
-Share ;)
Team Setupsfx_

BTCUSDT[BITCOIN]: $150,000 On The Way In Making!Hey there everyone!
Bitcoin took a bit of a dip around 105k, but it’s right back at a crucial level now. We’re keeping a close eye on the daily volume and expecting it to soar towards $115,000 before it might take another dip if the buying pressure dries up.
We’ve got three targets in mind, and you can set or look at them however you like based on your own analysis and preferences. The crypto market is going to be buzzing with volume, so keep an eye on the news and stay focused on the fundamentals. In the world of cryptocurrencies, fundamentals are more important than technicals, and it’s a whole different ball game compared to forex or gold.
Good luck with your trading, and please like and comment on this idea to show us your support. We really appreciate your support throughout our journey, and we’re excited to see it grow and continue.
If you’d like us to analyse a specific pair, just let us know!
Cheers,
Team Setupsfx_❤️

#BTCUSDT(BITCOIN): Two Targets First $130,000 And Then $150,000Bitcoin is poised for significant distribution, with a potential price surge to $130,000, followed by a swing target of $150,000. The current accumulation phase is poised to transition into a substantial bullish move. We anticipate a surge in bullish volume in the coming days or weeks. Our analysis anticipates this transition to be completed by the end of the year or sooner.
It is important to note that this analysis does not guarantee a specific price movement and is provided solely for educational purposes.
We extend our best wishes for your successful trading endeavours. If our analysis has been of assistance, we would appreciate it if you could express your gratitude by liking and commenting.
For further insights, please follow our account.
Team Setupsfx_

#BITCOIN: Accumulated Volume, Time For $150,000Bitcoin has accumulated nicely, but we don’t expect the price to distribute strongly towards $150k. We have set two targets: 125k and a swing target at 150k. Remember to have a confirmation before entering.
Good luck and trade safely,
Team Setupsfx_

#BTCUSDT: Major Bearish Correction?Bitcoin is currently undergoing a correction following its recent peak. While the initial price decline appeared insignificant, it has since experienced a substantial drop, suggesting a substantial volume of selling activity in the market.
We anticipate two potential areas where the price could reverse and resume its upward trajectory. These areas could lead to a price of 110,000, followed by 120,000, and ultimately reaching 150,000.
We strongly recommend that you implement rigorous risk management measures and conduct your own analysis before making any investment decisions.
Best regards,
Team Setupsfx_

from 118k $, I expect a correction to the area of 100k$Somewhere from the current levels of 118k $, I expect a correction to the area of 100k$
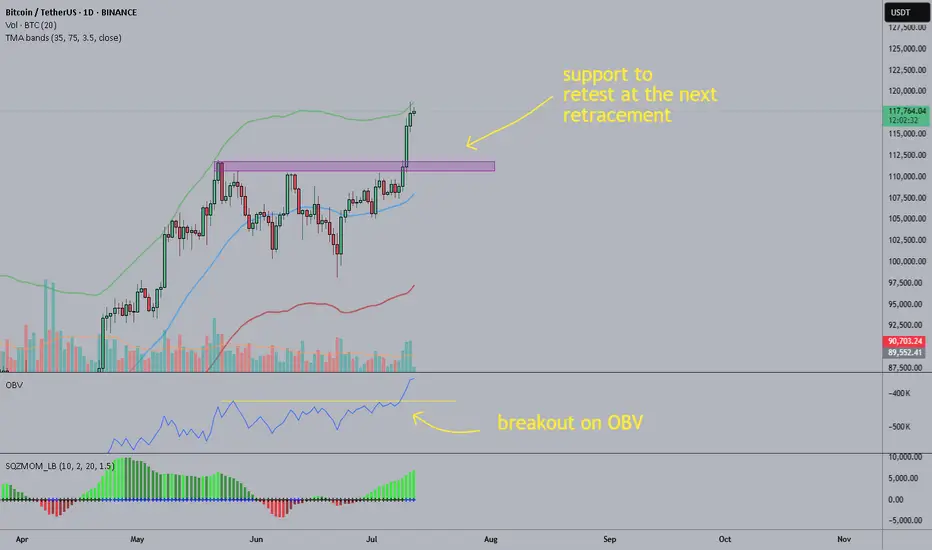
BTC: the breakout should be legitAs you can see the breakout had 3 days of rising volume and OBV also broke out so it should bne legit. On daily the upper band of the TMA bands is being tested, probably soon we'll see a retracement, I suppose the former resistance is now the support to test, however if the euphory continues we could see another peak of the price while RSI stays below the "overbought zone".
I'd look at opportunities to short although I usually don't trade BTC, I use it mostly as indicator on when to buy alts.
Good luck
BTC is Back in Price Discovery Mode — Targeting $140K!After a clean break above the previous all-time high, Bitcoin has officially entered a new impulse phase, trading within a steep rising channel.
The green zone around the previous ATH is now acting as a strong support zone, confirming the shift in market structure.
🟠 The macro trend remains intact, and bulls are clearly in control.
🌀 Corrections continue to offer opportunities for trend-following entries, and if momentum holds, BTC could be on its way toward the $140,000 mark — the upper boundary of the macro channel.
Until then, every dip is a gift in this bullish cycle. 🔥
🧠 Trade with the trend. Manage your risk. Stay ready.
📚 Always follow your trading plan regarding entry, risk management, and trade management.
Good luck!
All Strategies Are Good; If Managed Properly!
~Richard Nasr

BTC - Falling Correction = Continuation?BTC has been playing by the rules lately!
Every time Bitcoin forms a falling correction, it turns out to be a bullish continuation pattern — and history might be repeating itself 👀
As shown on the chart:
Previous falling channels (flag/wedge structures) have consistently led to strong bullish impulses.
The current correction also appears to be a falling channel, hinting at another potential bullish leg soon.
As long as the structure holds and no major support is broken, the next target could be a new all-time high.
Let’s see if BTC continues to respect this textbook behavior.
📌 Remember: Falling corrections in an uptrend = healthy continuation!
📚 Always follow your trading plan regarding entry, risk management, and trade management.
Good luck!
All Strategies Are Good; If Managed Properly!
~Rich

BTC – Bullish Continuation Ahead ?Bitcoin has been trading within a well-defined rising channel since mid-2023, respecting both upper and lower bounds beautifully.
After each impulsive move, we’ve seen healthy corrections followed by bullish continuations — a classic market structure in play.
🟦 Accumulation Zone: After a long accumulation phase, BTC kicked off a strong bullish cycle.
🟥 Correction Phases: Each major move was followed by a red correction zone before resuming the uptrend.
🟧 Current Phase: BTC is consolidating just below the upper channel boundary. A breakout above this zone could confirm the next bullish wave toward $140K+.
🔵 Key Observations:
Structure remains intact within the channel
Previous breakout zones now acting as support (blue arrows)
Continuation patterns are forming, signaling potential upside
🏹As long as the orange zone holds, BTC remains in a bullish structure, and a breakout would likely push us to new highs.
📍Will history repeat and BTC continue its journey toward the upper channel boundary? Let’s wait for confirmation!
💬 What’s your bias here? Are you bullish or waiting for a deeper pullback?
📚 Always follow your trading plan regarding entry, risk management, and trade management.
Good luck!
All Strategies Are Good; If Managed Properly!
~Richard Nasr

Bitcoin flightpath: great vs good1D timeframe.
There are 2 signs that the price of Bitcoin is about to explode:
1. We have broken above the ATH
2. BTC peaks Nov-Dec in historical halving cycles 2013/2017/2021
And there are 2 paths that could play out.
1. Great.
BTC has touched an uptrend (white line with 3 x red crosses). A break above this uptrend + a weekly candle close above 110K could result in a parabolic run to the upside with a target estimate of 246K. A bounce off the uptrend could be a good long entry.
2. Good
We break below the uptrend represented by the thick white line and said line begin to act as resistance. This would result in a higher high estimated at 125K. A bounce off 95K could be good long entry.

btc 120k then 115in im opinion btc will go up 120k max then fall to 115k , bcs there are a lot of sl's :D

Yeet! You thought "Why are these market so fake and scammy" is our daily crypto mantra. We extend this tradition

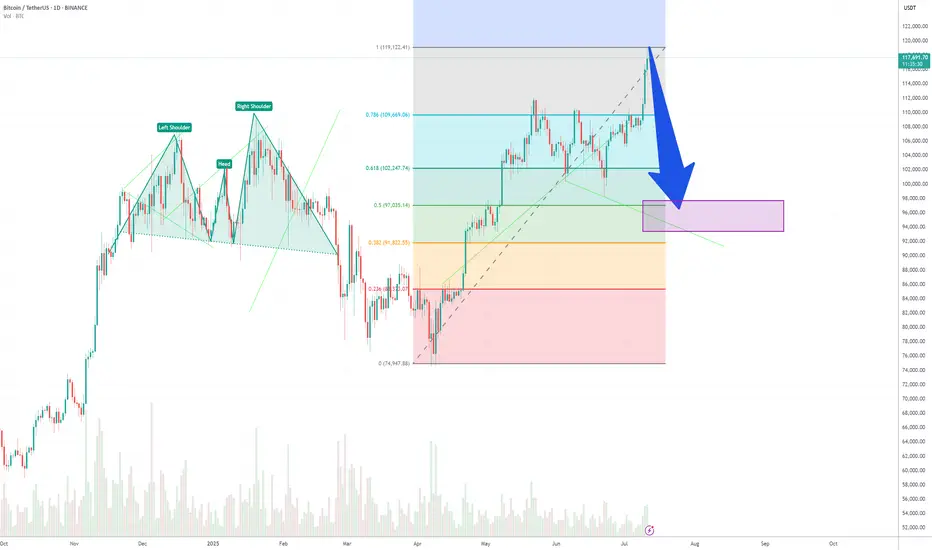
Crash incoming 117k - 86k Today btc record a new ATH . according to the Elliotts theory 117K was the end of main wave 3 . i think btc will start to dump very soon to 86k (wave4 ) . its need to start main wave 5 (86k - 140k) . Good luck. I think btc will bearish in next days.
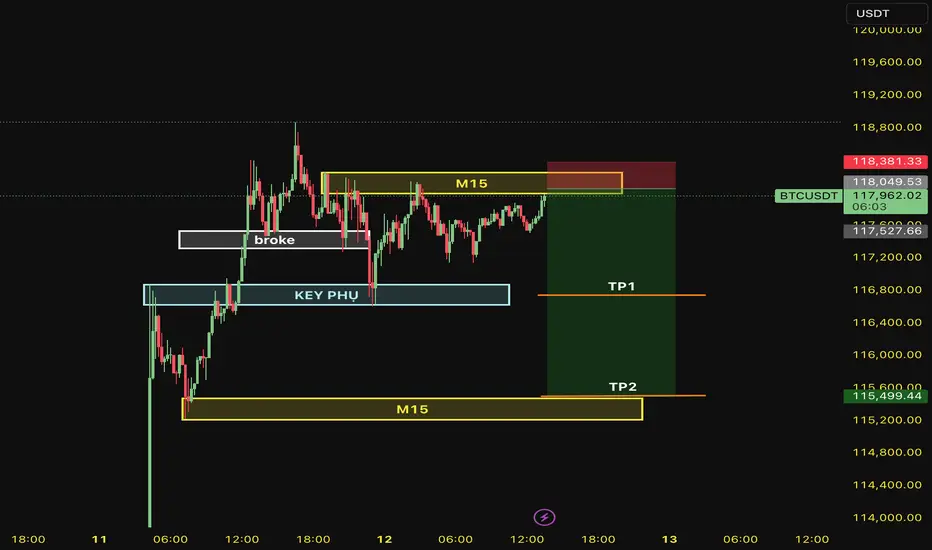
SHORT BTC 12/07/2025OUR STRATEGY TODAY.
Technical Analysis: FORECAST the price will hit M15 AT 115,500 because it broke M15 at 117,520.
- SELL at 118,000 because M15.
- TP1: SUB KEY at 116,727
- TP2: MAIN KEY at 115,504
- SL: 118,382
BTCUSDT – Market Update & RecommendationBTCUSDT – Market Update & Recommendation
In my previous analysis published on June 1, 2025 (TradingView), I mentioned the corrective pullback towards the $100k area before BTC resumed its next upward wave.
My latest evaluation (posted recently on my personal blog, linked in my TradingView signature) stated clearly that BTC would rise toward $110k, then experience a minor retracement to around $108.2k before consolidating and reaching new ATH between $118k–$125k.
At present, BTC has successfully touched the $118k mark and is undergoing a minor correction—this is a critical consolidation phase before price approaches the significant $125k distribution zone.
Recommendation:
Investors holding BTC purchased below $108k should closely monitor price action to secure profits as necessary.
Consider signals for potential Swing Short positions based on monthly (M) timeframe bottoms. This is a powerful and extended signal, potentially lasting until the end of 2025.
Caution is advised for any new BTCUSDT positions at this time.
Link:

BTC 4 HR TIME FRAME ANALYSIS 4H Technical Analysis – BTCUSDT.P (Bitcoin Perpetual on Bitget)
✅ 1. Trend Overview:
Current Market Phase: Strong uptrend.
Price has broken multiple H4 BOS (Break of Structure) levels with strong bullish momentum.
The last impulse candle shows a vertical breakout, often a sign of aggressive buyers or FOMO.
🔄 2. Key Structure Zones:
🔵 Demand Zones (Highlighted in Green):
Around 113,700–114,000 → fresh demand zone after last breakout.
Around 108,000–110,000 → mid-level zone from earlier accumulation.
Deeper zone at ~96,000–98,000 → higher timeframe demand (may hold if larger correction happens).
🔴 Supply Zones (No immediate supply shown, but...)
Watch for reaction zones around 118,000–120,000 as psychological resistance.
📍 3. Price Action & Structure:
The current move is parabolic, indicating momentum exhaustion may soon follow.
However, the last CHoCH and BOS signals are clearly bullish, and pullbacks are being aggressively bought.
Short-Term Expectation:
A correction or sideways consolidation may happen near 118,000–119,000.
Best scenario: price pulls back into the 113,700 zone, forming a bullish continuation setup.
🔍 4. Candlestick Patterns:
At the top, the last 2 candles are showing wicks, indicating possible early rejection or take-profit activity.
No confirmed reversal pattern yet (e.g., no bearish engulfing, pin bar, or evening star).
Wait for confirmation if considering a reversal trade.
📉 5. Risk Zones:
If price breaks below 113,700, then correction may deepen toward 110,000 or even 108,000.
Below 108,000 would invalidate the current short-term bullish structure and signal trend weakening.
📌 6. Key Levels to Watch:
Type Price Zone Notes
Resistance 118,500–120,000 Current high zone, psychological barrier
Demand Zone 1 113,700–114,000 Nearest fresh demand
Demand Zone 2 108,000–110,000 Mid support
HTF Demand ~96,000–98,000 Deep liquidity + structural demand
✅ Conclusion:
Market is in a strong bullish trend on the 4H chart.
Wait for a healthy pullback to demand zones before considering new longs.
Watch for bearish candlestick confirmation (like engulfing or M-structure) near highs for possible short-term reversals.
⚠️ Disclaimer:
This is not financial advice or a trading signal.
It's purely educational analysis.
Always trade based on your personal strategy and risk management. BITGET:BTCUSDT.P

BITCOIN Bitcoin and the Potential Move to $136,000 based on my price action +sma+ema advanced strategy.
Current Market Context
Bitcoin (BTC) is trading near all-time highs, recently surpassing $117,000-118000
The market is characterized by strong institutional inflows, robust ETF demand, and bullish technical momentum.
Is a Move to $136,000 Possible?
Analyst and Model Forecasts
Bitwise Asset Management and several market analysts see a 30% rally possible in July, which could push Bitcoin to the $136,000 level. This projection is based on:
Historical post-crisis rallies (average 31% gains after macro/geopolitical shocks).
Institutions buying more BTC than miners can supply.
Global rate cuts increasing liquidity and risk appetite.
Quantitative models and technical forecasters also predict a range between $136,000 and $143,000 as a potential 2025 high, with some models extending targets to $151,000 and beyond.
Other major banks and analysts (e.g., Standard Chartered, Bernstein, Fundstrat) maintain even higher year-end targets ($150,000–$200,000), but $136,000 is seen as a key intermediate technical and psychological level.
Technical Analysis
Bullish momentum is confirmed across short, medium, and long-term timeframes.
Key resistance levels to watch: $120,000 (psychological), $130,000 (round number), and $136,000 (target zone highlighted by several analysts).
Sustained trading above $112,000–$118,000 would support a move toward $130,000–$136,000, especially if ETF inflows and institutional demand remain strong.
Drivers Supporting the $136K Scenario
ETF and Institutional Inflows: Demand from US spot Bitcoin ETFs and corporate treasuries remains robust.
Macro Tailwinds: Expectations of US Federal Reserve rate cuts and a weakening dollar are fueling risk-on sentiment.
Supply Dynamics: The recent Bitcoin halving has reduced miner supply, amplifying the impact of new demand.
Technical Breakouts: Bull flag and breakout patterns suggest further upside, with $136,000 cited as a technical extension target.
Risks and Considerations
Volatility: Bitcoin remains highly volatile; sharp pullbacks are possible even in a strong uptrend.
Regulatory and Macro Risks: Changes in regulatory stance or a major shift in macro conditions could impact the trajectory.
Profit-Taking: Approaching major round numbers like $130,000 or $136,000 could trigger profit-taking and temporary corrections.
Summary Table: Bitcoin 2025 Price Targets
Source/Model 2025 Target Range $136K Move Outlook
Bitwise, Polymarket $136,000 (July 2025) High probability if current trends persist
Coinfomania AI Model Up to $143,440 $136K within model range
Investing Haven $80,840–$151,150 $136K within bullish scenario
Changelly, CoinDCX $100,000–$150,000 $136K is a key resistance
Standard Chartered $120,000–$200,000 $136K as a stepping stone
Conclusion
A move to $136,000 for Bitcoin is considered plausible in 2025 by my market structure advanced strategy , This scenario is supported by strong institutional demand, favorable macro conditions, and bullish technical patterns. However, volatility and macro/regulatory risks remain, so price action should be monitored closely as BTC approaches key resistance levels at 120k and 136k level
#bitcoin #btc

#BTC Update #6 – July 11, 2025🟠 #BTC Update #6 – July 11, 2025
Bitcoin has surged nearly 9% from the supply zone and is currently trading around the $119,000 level. However, looking at the current volume, the momentum seems to be fading.
If a correction takes place, the potential support zones are:
✨First stop: $114,000
✨Second stop: $113,000
✨Third stop: $111,500
After a pullback, the next target may be around $122,000. However, macroeconomic risks are rising. The U.S. is considering a 500% tariff on Russia imports, and in the past, even a 100% tariff triggered a sharp drop in Bitcoin.
Since BTC has already made a significant move up, I don’t think opening a Long or Short position is wise at the moment. Just observing for now.

Bitcoin: Final Push in the 60-Day Cycle?Bitcoin appears to be making its final move higher within the current 60-day cycle. We could potentially see a push into the $121K–$122K range before a sharp correction takes us down to around $110K–$112K toward the end of the month, driven by the 3-day cycle timing.
After that, we’re likely to form a new 60-day cycle low, which could set the stage for a renewed move to the upside.
Is it time to go long?
At this point, the risk/reward doesn’t look favorable for new longs. Personally, I’m watching for one final push above $120K to consider opening a short position into the expected cycle low.

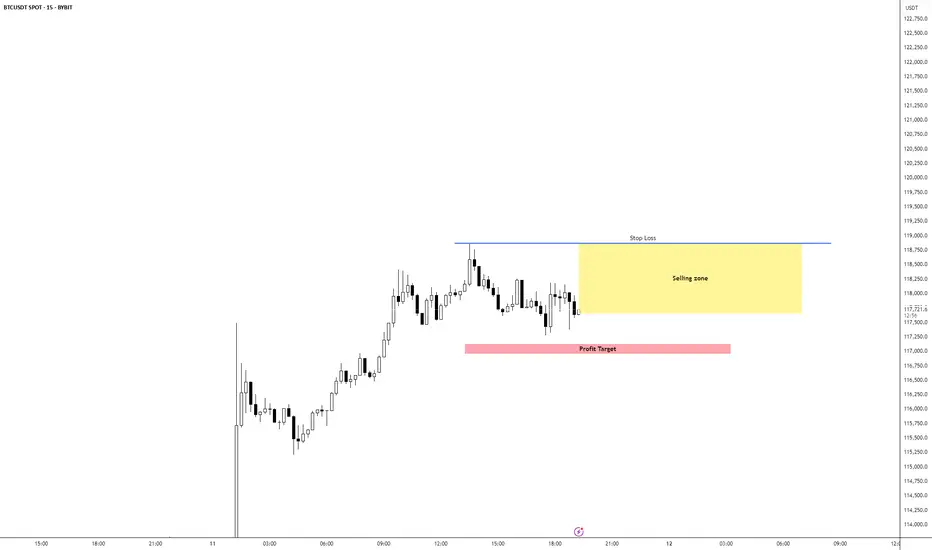
BTC/USD Short IdeaBTC/USD is currently bullish overall but seems overextended, Expecting a pullback to the 5m Equilibrium levels which would be our TP area. 1M has switched bearish adding confluence to our setup.
I would be layering short positions inside the yellow selling zone