Bitcoin is getting Ready for 143K$ nowMajor red resistance trendline is now broken also last week the retest is completed now price is range for a while for new week to start and fresh volume and buys that make path easier to reach above 140K$.
Get ready and take a look at important zones at chart and possible scenarios which are all mentioned.
DISCLAIMER: ((trade based on your own decision))
<<press like👍 if you enjoy💚
USDTBTC trade ideas

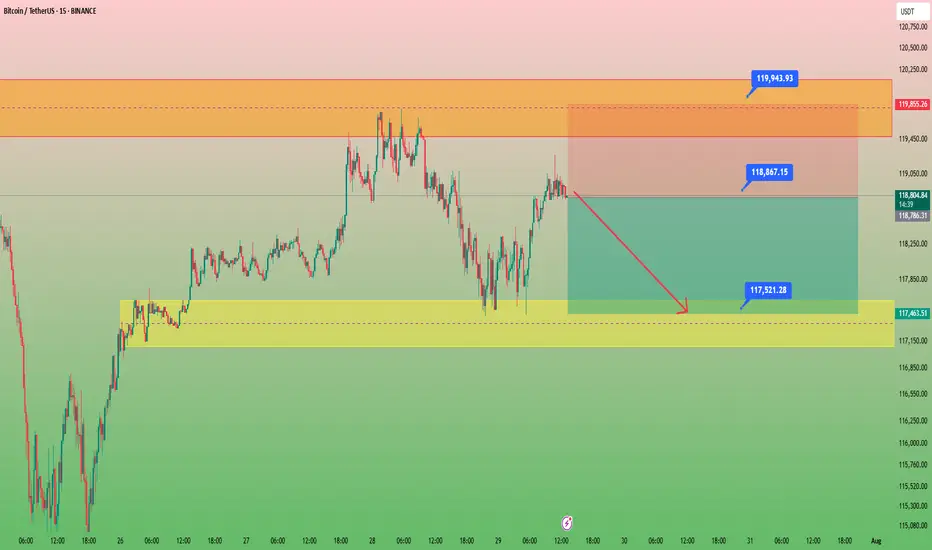
Bitcoin in 15minCaption important🛑🛑🛑
Hello to all traders. 😎😎
I hope all your deals will hit their targets. 🎉🎉
I’m opening a short position on Bitcoin from the current level, targeting $118,200 as the first take-profit, and $117,600 as the second target.
⚠️ This is a high-risk trade, so make sure to apply proper risk management.
What Do You Think?
Which scenario do you think is more likely to happen? **Share your thoughts!** ⬇️
Don't forget that this is just an analysis to give you an idea and trade with your own strategy. And don't forget the stop loss🛑🛑🛑
❤️❤️❤️The only friend you have in financial markets is your stop loss❤️❤️❤️
Please support me with your ✅' like'✅ and comments to motivate me to share more analysis with you and share your opinion about the possible trend of this chart with me 🙏😊
Be Happy , Ali Jamali
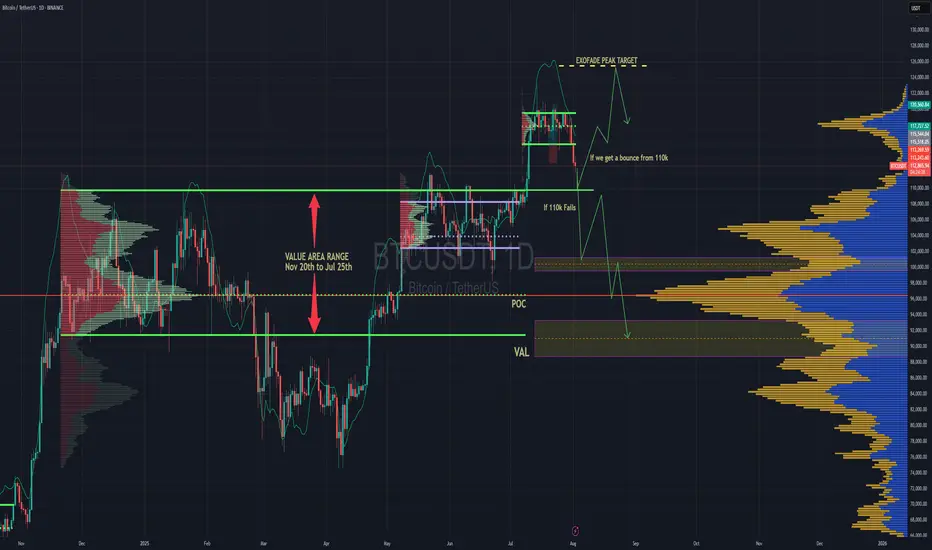
BTC Forecast For August & September. The Only Roadmap You Need !This is one is so obvious, its a no brainer , and would likely be very easy to trade as long as you follow this road map i have provided.
The Value Area High at 110k price range is most important upcoming battle line between bull vs bear. If bulls fail to get a strong bounce from 110k and we close at least 2 daily candles below it. Then it would mean bears have full control and the implication of that is that since we would at that point be closing back inside an established Value Area range, formed between Nov 20th to Jul 25th, then it would mean the probability of price selling all the way down to re-test the VAL (value area low) at $91.6k would instantly become very very high.
After re-testing $91.6k we'll watch and see what happens.
It'll either hold after grabbing some liquidity below and stay in the Value Area Range until further notice Or we lose it and the sell off continues. Bear market will be in full swing if that happens and you can bet a ton of weak hands will start to exit due to max pain & cascading long liquidations. Fear index will be back in the red at that point as capitulation starts to set in. Alot of new alts and meme coins will be completely obliterated.
Bullish Continuation Scenario
If bulls get a strong bounce from 110k and don't close back inside the Value Area Range below, then we could continue up to a make a new ATH for a classic trend pullback continuation trade. Once we get back above 115.4k, the dream of a new ATH will become much more realistic. There is an UFA(Unfinished Auction) at 120.8k which is only visible to traders using the market profile or footprint chart. This make poor high and needs to be taking out at some point.
For the Price target to the upside, we would be using the peak formation line of the ExoFade indicator.
BTCUSDT: Trend in daily time frameThe color levels are very accurate levels of support and resistance in different time frames.
A strong move requires a correction to major support and we have to wait for their reaction in these areas.
So, Please pay special attention to the very accurate trend, colored levels, and you must know that SETUP is very sensitive.
BEST,
MT

BTC accumulates, slightly adjusts down💎 BTC PLAN UPDATE – START OF THE WEEK (04/08)
🔍 1. Current Technical Structure
Price Pattern: The chart shows BTC is forming a falling wedge pattern, with converging support and resistance lines.
False Break: There was a false break below the strong support zone around ~112,000, followed by a sharp rebound. This indicates buyers are actively defending this level, showing potential buying pressure.
Fibonacci Retracement: From the recent low to high, the 0.5 (115,559) and 0.618 (116,361) Fibonacci levels are acting as key resistance zones.
Key Price Levels:
• Strong support: 111,800 – 112,300
• Near resistance: 115,500 – 116,500
• Next resistance: downtrend line and previous high around 118,000 – 119,000
🔄 2. Possible Trend Scenarios
✅ Main scenario (bullish):
BTC made a false break below the wedge → rebounded toward Fibonacci resistance → potential:
• Continue rising to the 115,500 – 116,500 zone
• If it breaks and holds above this zone, BTC could break out of the wedge pattern and target 118,000 – 120,000
• A longer-term target could be the 1.618 Fibonacci Extension around ~123,159
❌ Alternative scenario (bearish):
If BTC fails to break above 116,000 and gets rejected:
• It may retest the 112,000 support zone again
• A breakdown below this support would bring back the downtrend
🔄 3. Bullish Supporting Factors:
• The false break signals a shakeout of weak sellers.
• A potential inverse head-and-shoulders pattern is forming, supporting a bullish reversal.
• Moving Averages (MA): Price is nearing the 200 MA (red) – a possible bullish crossover with shorter-term MAs may occur, signaling a buy.
🧭 Suggested Trading Strategy
• Safe buy zone: Around 113,500 – 114,000 if there’s a pullback.
• Take profit in stages: 116,500 – 118,000 – 120,000
• Stop-loss: Below 112,000 in case of a confirmed breakdown

Is Bitcoin Pulling Back to the 100,000 Area?If we consider the $124,000 level as Bitcoin's high, Bitcoin should correct to the 0.5 Fibonacci level. Write your comment.

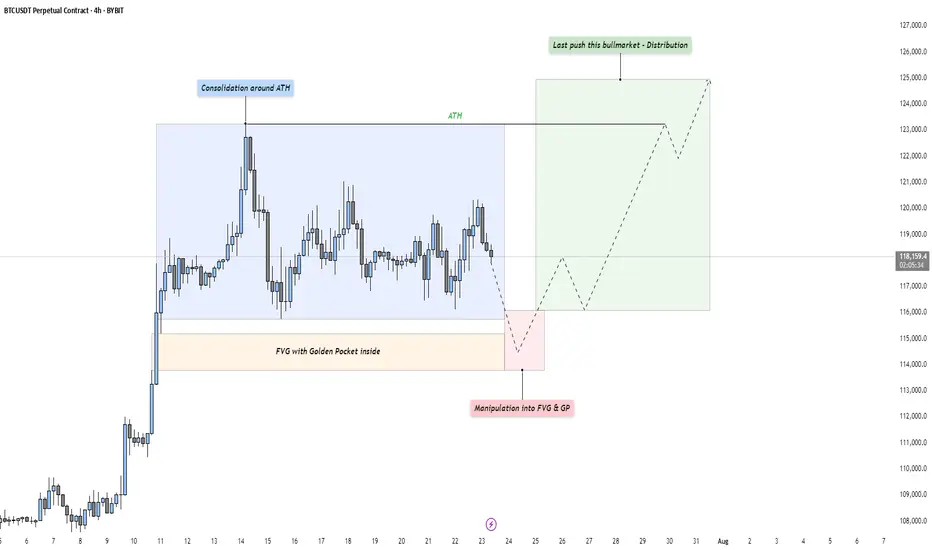
BTC - Last Push: Consolidation, Manipulation & DistributionMarket Context
After a strong upward impulse, Bitcoin has entered a mid-term consolidation phase just below its all-time high. This kind of price action is typical as the market digests recent gains and larger participants prepare for the next move. These pauses in momentum often precede either trend continuation or a reversal — and the structure here suggests we might be witnessing the former, but not without a final shakeout.
Phase 1: Consolidation Around the All-Time High
The first phase is defined by a tight range just beneath the all-time high, where price moves sideways in a balanced struggle between buyers and sellers. This is often where retail participants become overly bullish, anticipating a breakout. However, the lack of a sustained move higher indicates that smart money may be waiting for better entries — or preparing to engineer liquidity to fuel the next move.
Phase 2: Manipulation Into the Fair Value Gap and Golden Pocket
Directly below the range lies a clean Fair Value Gap, with a Golden Pocket retracement nestled inside it. This zone represents a strong area of interest. A sharp move into this area would likely sweep late long positions and trigger stop-losses from range traders — a classic manipulation pattern. This phase serves two purposes: collect liquidity and offer favorable pricing for larger players looking to position themselves before expansion. Watch for signs of absorption or reversal as price enters this zone.
Phase 3: Expansion – The Last Push of the Bull Market?
Following the liquidity sweep and reaction from the Fair Value Gap and Golden Pocket zone, we could see a renewed expansion toward higher highs. This is the phase where volume returns, sentiment shifts, and price accelerates. If this plays out, it could mark the final leg of this bull cycle — potentially driving Bitcoin to new all-time highs with strength.
Execution Thoughts
If you're looking to participate, it's wise to wait for a confirmation signal on a lower timeframe — like the 5-minute or 15-minute chart — once price enters the Fair Value Gap and Golden Pocket zone. Watch for a strong bullish reaction, break of structure, or shift in order flow to signal that buyers are stepping back in.
Final Thoughts
Let the market come to your level and don’t chase moves without context. These three phases — consolidation, manipulation, and expansion — are timeless patterns seen across all markets. Stay patient, stay objective, and react with clarity.
If this breakdown helped you see the setup more clearly, a like would mean a lot — and I’d love to hear your thoughts in the comments! Are you watching the same zone, or do you see something different?
BTC - Trap, Tap, and Blast Off!BTC has been overall bullish, trading within the rising blue channel (1). After reaching a local high, it entered a short-term correction, forming a falling red channel (2).
👀All eyes are now on the key demand zone (3), which aligns with the lower bound of both the red channel and the rising blue structure.
🔎As long as this confluence holds, we anticipate a potential bullish impulse in August.
A retest of the $111,500–$112,000 zone could serve as the trigger for the next leg toward $128,000. Let’s see if BTC is gearing up for another breakout or if a deeper correction is in play.
🔔 Disclaimer: This analysis is for educational and informational purposes only. It does not constitute financial advice or a recommendation to buy or sell any asset. Always do your own research and manage your risk accordingly.
📚 Always follow your trading plan => including entry, risk management, and trade execution.
Good luck!
All strategies are good, if managed properly.
~ Richard Nasr

BTC : The future of Bitcoin...Hello friends🙌
👀According to the price history, the price has always been bullish and is in a long-term bullish channel.
📈Now that the price is struggling in the middle of the channel and is gathering strength for a big move, which is expected to break the middle of the channel in the form of a resistance or middle channel, the price will move to the ceiling of the channel.
⚠Don't forget risk and capital management.
🔥Follow us for more signals🔥
*Trade safely with us*

Bitcoin projection for the rest of the year. Bullish.We are in a retracement phase , i think btc will retrace deep enough to convince people that bull run is over . Once that happens it will flip to the upside and leave everyone shocked.
A retrace towards 108k-104k is possible.
Once they get tapped btc will start a new run towards a new all time high where everything will get to an end and a new besr market will start. Until then lets enjoy the rest of the year.
Accroding to VSFA+ long turm BTC Asalam-o-Alikum All,
Accroding to VSFA+ Strategy BTC very soon big drop coming, BTC testing 90k to 95k price velue, Total market cap crashing so overall crypto coin's crashing toO so becareful...

What Nobody Taught You About Risk Management. Part 1
Numerous authors and communicators have addressed the importance of risk management, more or less comprehensively, but I have not come across any who present what I intend to share with you today. Once my presentation is complete, I will share some useful resources with which you can complement what you learn here, as I will only cover an important but small part of the topic: execution.
What is risk management?
Risk management is the planning an investor undertakes to protect capital and maximize profits. It encompasses factors surrounding the creation of a profitable system or method, the allocation of our capital, and the execution of our trades.
Some key concepts:
Risk-Reward Ratio
The risk-reward ratio is a metric used in trading and investing to assess the relationship between the risk taken in a trade and the expected potential profit. It is expressed as a ratio, for example, 1:1, 1:2, 2:1, etc.
Stop Loss (SL)
The SL, or stop-loss, is an automatic order placed in a trading operation to close your position at a specific price, with the aim of limiting losses if the market moves against you.
Take Profit (TP)
The TP, or take-profit, is an automatic order placed in a trading operation to close your position at a specific price to secure profits when the market reaches a favorable level. It is the point where you decide to "take" your profits and exit the trade.
Margin
In trading, margin is the amount of money a trader must deposit or maintain in their account to open and sustain a position.
Volatility
Volatility, in the context of trading and financial markets, measures the magnitude and frequency of changes in an asset's price.
Leverage
Leverage in trading is a tool that allows investors to control a larger market position using only a fraction of their own capital. It acts as a "loan" provided by the trading platform, amplifying both potential profits and potential losses.
Risk Management and Trade Execution:
The most common problem among other investors, beyond psychological factors or lack of experience, is the absence of total control over their trades. They use random leverage, take entries with risk-reward ratios below 1:1, and some don’t even know what percentage of profits or losses they will have at the end of the trade.
For an investor to execute a successful trade, they must meet the following criteria:
1. Ensure minimum risk-reward ratios of 1:1.
2. Properly allocate their investment capital, adhering to strict rules to avoid undermining their statistical performance.
3. Adapt to volatility and know how to adjust their leverage accordingly.
4. Set a fixed stop-loss (SL) price and determine what percentage of losses they are willing to accept per trade.
5. Set a fixed price for taking profits from the trade and know what percentage of profits they will achieve.
Failing to meet these parameters will not only destroy traders’ profitability but also make it impossible for them to develop reliable investment systems and methods.
Incorrect Execution:
For example, if I see an entry opportunity in BTC/USDT, it would be a mistake to choose random leverage and plan to manually close when I think I’ve gained or lost enough. The volatility of the price chart itself may or may not require leverage, and that leverage must be adjusted to our risk management strategy. Trading in the manner described above is a recipe for failure, which is why it’s a lucrative business to allow inexperienced investors to access markets through online platforms.
Correct Execution:
Before explaining a practical case, let’s assume I use a $1,000 amount per trade and am willing to risk a 20% stop-loss (SL). These parameters are non-negotiable to avoid undermining my statistical performance.
A few days ago, I took the trade shown in the chart. To enter this long position in BTC/USDT, the first thing I did was identify the entry point and the exit points for my trade (SL and TP). The trade met a minimum risk-reward ratio of 1:1, so I considered whether leverage was necessary. A volatility of 9.07% from the entry point to my SL price offered low profit expectations relative to what I was willing to risk from my margin per trade (20% of $1,000). I needed leverage.
In the toolbar on the left, once you have a price chart open in TradingView, you can use the ruler to easily measure the percentage of volatility.
How can I ensure that 20% of the margin I’m investing is triggered when the price reaches my SL zone using leverage?
To calculate the exact leverage, we divide the SL percentage we’re willing to risk (20%) by the volatility percentage from the entry point to the SL price (9.07%).
For example, my entry point in BTC was $109,898, and the exit point or SL was $99,930. I measured the volatility between the entry price ($109,898) and the exit price ($99,930), resulting in 9.07%. Since the volatility was somewhat low and I wanted to risk 20% of my margin per trade when the price hit my SL, I calculated the required leverage. To do this, I divided 20% (the percentage I was willing to lose per SL) by 9.07% (the volatility percentage from the entry price to the SL price). The result was approximately 2x leverage when rounded.
In summary: At 2x leverage, we would lose approximately 20% of our capital if the price reached $99,930. Since I had a 1:1 risk-reward ratio before entering the trade, I assumed I would gain approximately 20% of the invested margin when the price reached $120,000.
The trade was a winner, reaching the TP price without issues and generating a 20% profit on the margin I invested ($1,000).
Use investment platforms that allow you to manually adjust leverage, such as 1x, 2x, 3x, 4x… 38x, 39x, 40x, and avoid platforms where leverage is set to default values like 1x, 5x, 10x, 20x, 50x… This seemingly minor detail for most small investors allows platforms to pocket large fortunes from failed trades.
Conclusions and Recommendations:
Risk management is the backbone of investors, and knowing how to execute entries with precision is rare among retail traders. Even so, I’ve only covered a small part of this topic. To complement this knowledge, I recommend searching on YouTube for the video by investor and educator Yuri Rabassa titled “The Secrets of Good Money Management.” This video will help you develop basic statistical skills that are vital for creating a trading system. Additionally, in the book *Forex Price Action Scalping* by renowned author Bob Volman, you’ll find a very insightful chapter titled “The Principle of Probability.”
Final Note:
If you’d like to take a look at my analysis log, you can find my profile in Spanish, where I transparently share well-defined market entries. Send your good vibes if you enjoyed this article, and may God bless you all.

BTC - BIG OPPORTUNITY COMING SOON AGAIN!IF BTC does not hold the current low, 95% probability we will go for the green box. biggest support is around $110.000 guys. Once/should backtested we could see massive opportunity again on altcoins!


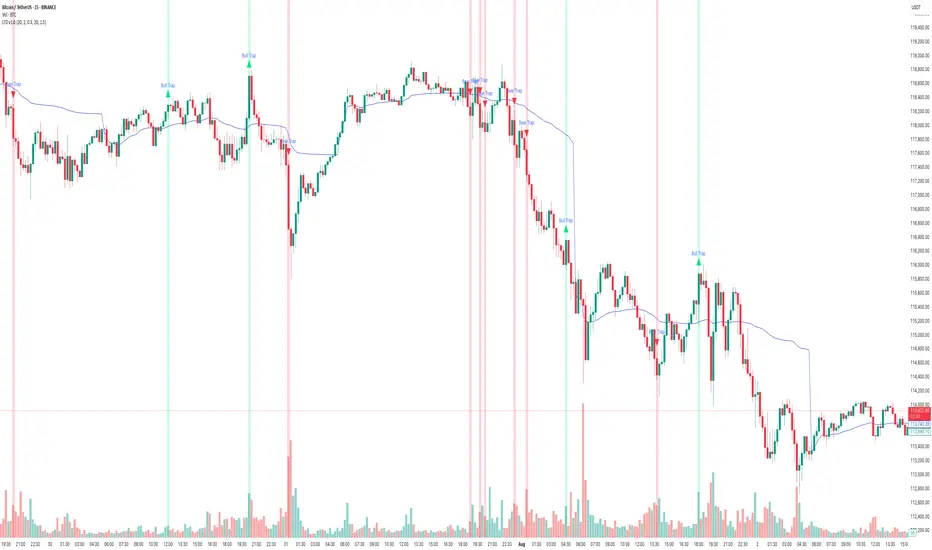
How to use Free TradingView Indicator to detect Liquidity TrapsPerformance on Shared BTC/USDT Chart
Indicator : Liquidity Trap Detector (LTD)
Timeframe: 15-sec (as per chart)
Observation Period: Full session visible in the screenshot
1. Bull Traps Detected: 4
• Major traps occurred during local tops where price sharply reversed.
• Example: ~19:15 and ~21:00 marked strong reversals after fake breakouts.
2. Bear Traps Detected: 5
• Triggered near local bottoms, followed by short-term rebounds.
• Example: ~22:15 and ~00:30 triggered after sudden downward sweeps.
3. Accuracy:
• Approx. 70–75% of traps correctly led to meaningful reversals.
• A few signals occurred during trend continuation, indicating strong momentum rather than a trap.
4. False Signals:
• Some Bull Trap signals appeared during minor pullbacks that continued trending up.
• Filtering with cooldown periods or trend filters (e.g., EMA alignment) can reduce noise.
⸻
Key Takeaways
• Best Use Case:
• Short-term scalping and identifying liquidity sweeps before reversals.
• Works well in ranging or high-volatility conditions.
Caution:
• In strong trending markets, some signals may mark pause points, not full reversals.
• Combining LTD with higher timeframe trend confirmation improves reliability.
Understanding ROI in Crypto: More Than Just a NumberHello, Traders! 👏
Return on Investment (ROI) is often the first metric new investors focus on when evaluating an asset, a strategy, or even their trading performance. It’s easy to see why. It's simple, intuitive, and widely used across both traditional finance and the cryptocurrency sector. One formula, and suddenly you have a "score" for your investment. Green is good. Red is bad. Right?
Well…Not quite.
In the crypto market, where price swings can be extreme, timelines are compressed, and risk profiles differ significantly from those in traditional markets, a simplistic ROI figure can be dangerously misleading.
A 50% ROI on a meme coin might look great, until you realize the token is illiquid, unbacked, and you're the last one holding the bag. Conversely, a 10% ROI on a blue-chip crypto asset with strong fundamentals might be significantly more meaningful in risk-adjusted terms.
In this article, we'll delve beyond the basic formula and break down what ROI really tells you, how to use it correctly, and where it falls short. Let's go!
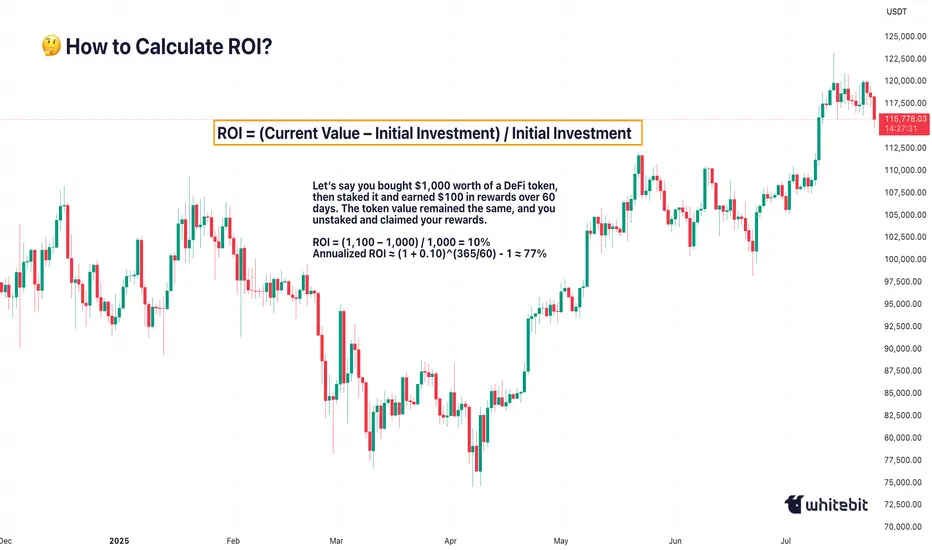
What Is ROI and How Do You Calculate It?
The Basic Formula for Return on Investment Is: ROI = (Current Value – Initial Investment) / Initial Investment.
Let’s say you bought ETH at $2,000 and sold it at $2,600: ROI = (2,600 – 2,000) / 2,000 = 0.3 → 30%. Seems straightforward. You made 30% profit. However, crypto is rarely straightforward.
What if you held it for 2 years? Or 2 days? What if gas fees, staking rewards, or exchange commissions altered your real costs or returns? Did you include opportunity cost and the profits missed by not holding another asset? ROI as a raw percentage is just the beginning. It’s a snapshot. However, in trading, we need motion pictures, full narratives that unfold over time and within context.
Why Time Matters (And ROI Ignores It)
One of the most dangerous omissions in ROI is time.
Imagine two trades: Trade A returns 20% in 6 months. Trade B returns 20% in 6 days.
Same ROI, very different implications. Time is capital. In crypto, it’s compressed capital — markets move fast, and holding a position longer often increases exposure to systemic or market risks.
That’s why serious traders consider Annualized ROI or utilize metrics like CAGR (Compound Annual Growth Rate) when comparing multi-asset strategies or evaluating long-term performance.
Example: Buying a Token, Earning a Yield
Let’s say you bought $1,000 worth of a DeFi token, then staked it and earned $100 in rewards over 60 days. The token value remained the same, and you unstaked and claimed your rewards.
ROI = (1,100 – 1,000) / 1,000 = 10%
Annualized ROI ≈ (1 + 0.10)^(365/60) - 1 ≈ 77%
Now that 10% looks very different when annualized. But is it sustainable? That brings us to the next point…
ROI Without Risk Analysis Is Useless
ROI is often treated like a performance badge. But without risk-adjusted context, it tells you nothing about how safe or smart the investment was. Would you rather: Gain 15% ROI on a stablecoin vault with low volatility, or Gain 30% ROI on a microcap meme token that could drop 90% tomorrow?
Traders use metrics such as the Sharpe Ratio (which measures returns versus volatility), Maximum Drawdown (the Peak-to-Trough Loss During a Trade), and Sortino Ratio (which measures returns versus downside risk). These offer a more complete picture of whether the return was worth the risk. ⚠️ High ROI isn’t impressive if your capital was at risk of total wipeout.
The Cost Side of the Equation
Beginners often ignore costs in their ROI math. But crypto isn’t free: Gas fees on Ethereum, trading commissions, slippage on low-liquidity assets, impermanent loss in LP tokens, maybe even tax obligations. Let’s say you made a 20% ROI on a trade, but you paid 3% in fees, 5% in taxes, and lost 2% in slippage. Your actual return is likely to be closer to 10% or less. Always subtract total costs from your gains before celebrating that ROI screenshot on X.
Final Thoughts: ROI Is a Tool, Not a Compass
ROI is beneficial, but not omniscient. It’s a speedometer, not a GPS. You can use it to reflect on past trades, model future ones, and communicate performance to others, but don’t treat it like gospel.
The real ROI of any strategy must also factor in time, risk, capital efficiency, emotional stability, and your long-term goals. Without those, you’re not investing. You’re gambling with better math. What do you think? 🤓
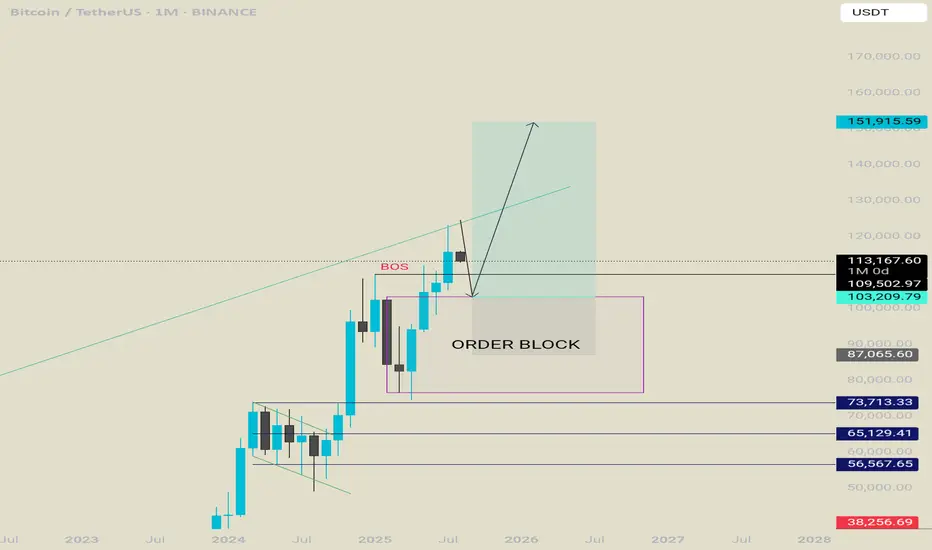
This is why I firmly believe we'll witness BTC reach 150K soon.No caption needed and every reasons are kept in the chart. Zoom In and analyze every single lines in the chart and hope you will see what I tend to see as far as my capabilities allows me. Let me know your comments on the idea. I am looking forward to witness $150K in the next 3 to 4 months time. I will be updating my confluences to say this on higher timeframes too.
With Regards. And stay Tuned.

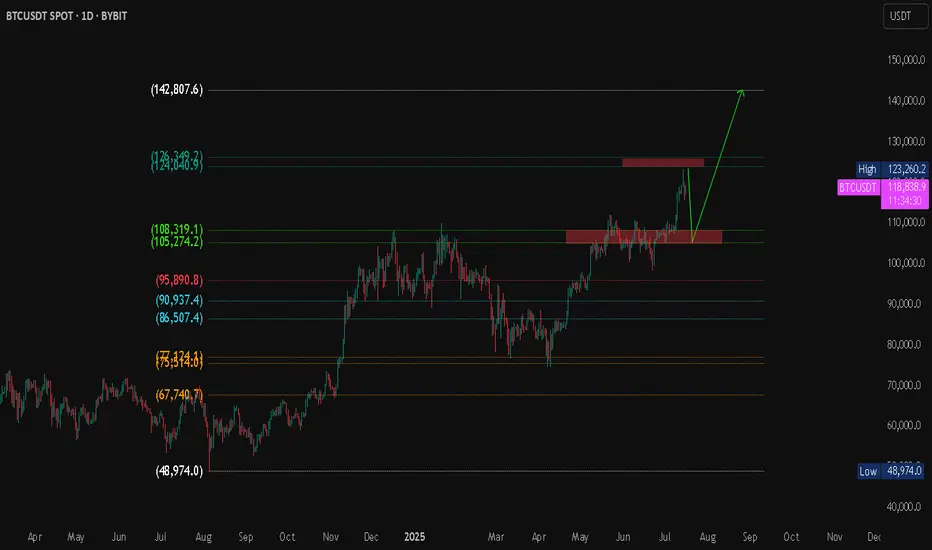
BTC/USDT Technical Analysis Market Overview
Bitcoin is currently trading at $118,788, with an intraday high of $119,311. The market has recently tested a major resistance zone and is showing signs of a potential pullback toward a key demand zone before a possible continuation to higher levels.
Projected Scenario (Bullish Bias)
Expected pullback to the support zone around $105K – $108K.
If price holds and shows a bullish reversal, a breakout above $124K is expected.
Primary upside target: $142,807 (Fibonacci projection / potential new high).
The trend is your friend...BTC is moving within a clear range on the daily timeframe. Since we are in an underlying uptrend, the current range is bullish. A downside fakeout would be typical and could potentially fill the CME gap, but we would remain bullish.

$BTC Daily OutlookBINANCE:BTCUSDT.P
Weekly Chart:
Bitcoin has now printed three consecutive weekly closes above the former higher-high threshold at $111 960. That series is enough to confirm a clean breakout of the prior HH-HL range and keeps the long-term bias pointed firmly higher.
That said, a near-term pullback is still on the table:
• First support — the breakout shelf at $111 960 (re-test of structure).
• Deeper support — the next V-level around $98 115.
Why the caution?
Last week’s candle left a small Failed Auction just above the new high, and Footprint data shows a cluster of aggressive buy-delta trapped in that wick. Those buyers may need to get washed out before the trend resumes.
Big picture: weekly structure is bullish; any dip into the levels above is a potential reload zone while the breakout holds.
Daily Chart:
Price action remains firmly bullish: multiple Failed-Auction rejections at the $116 860 higher-low vLevel keeps supply thin and reinforce the up-trend toward the prior ATH.
That said, remember Auction Market Theory rule #5: “When time or volume builds at the edge of balance, price often pushes through.”
• Each failed auction is absorbing resting bids.
• If sellers lean in again with size, the level can flip from support to resistance very quickly.
In practice that means:
•Base case – continuation to the highs while the Daily structure holds.
•Risk scenario – a clean break of $116 860 would open room for a deeper weekly pullback toward $107456.0
For now we treat the current weekly pullback as a fresh opportunity: scouting intraday longs as price reacts to the 1-Hourly zone.
From the footprint read-out, today’s bar finished with a neutral delta, but note where the profile is stacked: both the Value Area Low and the POC sit right at the bottom of the candle. That tells us the bulk of volume printed down at the session lows and it skewed negative, sellers were leaning hard, trying to extend the move lower.

BTC/USD) Bullish trend analysis Read The captionSMC Trading point update
Technical analysis of (BTC/USDT) on the 4-hour timeframe, using Smart Money Concepts and a falling channel breakout approach.
---
Technical Breakdown:
1. Market Structure:
Price has been moving within a descending channel, forming lower highs and lower lows.
BTC just bounced strongly from the Fair Value Gap (FVG) zone, marked in yellow, and the lower boundary of the channel, suggesting a potential trend reversal.
2. Key Levels:
FVG (Demand Zone): Between ~112,000–114,000 — price reacted from this zone with clear bullish momentum.
200 EMA (114,799.70): Price is currently below it, but if it reclaims this level, it will strengthen the bullish setup.
Target Point: ~123,287–123,327 — aligns with the upper boundary of the channel and previous resistance.
3. Projected Price Path:
Step 1: Price is expected to retest the mid-channel resistance and potentially break above.
Step 2: If confirmed, BTC may rally toward the 123k+ target zone, continuing the trend reversal.
4. RSI (14):
RSI is currently at 42.70, moving up from oversold territory (33.05 low), which supports a bullish reversal.
No bearish divergence seen, indicating room for upside.
Mr SMC Trading point
---
Trade Idea Summary:
Bias: Bullish
Entry Confirmation: Strong bounce from FVG and bullish candle close above 114,800 (EMA)
Target Zone:
TP1: 118,000 (channel midline)
TP2: 123,327.97 (channel top / resistance zone)
Invalidation: Close below 112,000 or breakdown of channel and FVG
Indicators: RSI recovery + strong volume bounce supports bullish scenario
plesse support boost this analysis)

Understanding Wedge Patterns - A Real Bitcoin Case Study🎓📊 Understanding Wedge Patterns - A Real Bitcoin Case Study 🧠📈
Hi everyone, FXPROFESSOR here 👨🏫
From this moment forward, I will no longer be posting targets or trade setups here on TradingView. Instead, I’ll be focusing 100% on education only for here in Tradinfview.
Why? Because over time I’ve learned that even when traders receive the right charts, most still struggle to trade them effectively. So, from now on, FX Professor Crypto content here will be strictly educational — designed to teach you how to read and react to the markets like a professional. Unfortunately I cannot be posting on Tradingview frequent updates like I do all day. Education is always better for you guys. And i am very happy to share here with you what matters the most.
🧩 In today’s post, we dive into one of the most misunderstood formations: the wedge pattern.
Most resources show wedges breaking cleanly up or down — but real price action is messier.
🎥 I recorded a video a few days ago showing exactly how BTC respected a wedge formation.
⚠️ Note: Unfortunately, TradingView doesn’t play the audio of that clip — apologies that you can’t hear the live commentary — but the visuals are clear enough to follow the logic. (there is no advertising of any kind on the video so i hope i don't get banned again - i did make a mistake the last time and will avoid it-the community here is awesome and needs to stay clean and within the rules of TV).
Here’s what happened:
🔸 A clean wedge formed over several days
🔸 We anticipated a fake move to the downside, grabbing liquidity
🔸 BTC rebounded off support around a level marked in advance
🔸 Then price re-entered the wedge, flipping support into resistance
The lesson?
📉 Often price will exit the wedge in the wrong direction first — trapping retail traders — before making the real move. This is a classic liquidity trap strategy, exercised by the 'market'.
💡 Remember:
Wedges often compress price until it "runs out of space"
The initial breakout is often a trap
The true move tends to come after liquidity is taken
The timing of the 'exit' has a lot to do with the direction. In the future we will cover more examples so pay attention.
I stayed long throughout this move because the overall market context remained bullish — and patience paid off.
Let this be a reminder: it’s not about guessing the direction — it’s about understanding the mechanics.
More educational breakdowns to come — keep learning, keep growing.
One Love,
The FX PROFESSOR 💙
Disclosure: I am happy to be part of the Trade Nation's Influencer program and receive a monthly fee for using their TradingView charts in my analysis. Awesome broker, where the trader really comes first! 🌟🤝📈

Bitcoin Next Leg Incoming? Targets $134K from Bullish WedgeBTCUSDT is consolidating within a descending wedge right above a critical demand zone, following a impulsive breakout from its prior range structure. This current setup suggests another potential bullish continuation, especially as price continues to respect both the wedge support and internal demand.
With the higher timeframe structure favoring bulls and previous demand zones holding firm, the projected breakout targets align with $123,218 and $134,446 respectively.
A clean invalidation would only be confirmed on a sustained break below the wedge and loss of the strong support area near $110K.
All eyes on the wedge apex as BTC prepares for its next major leg.
