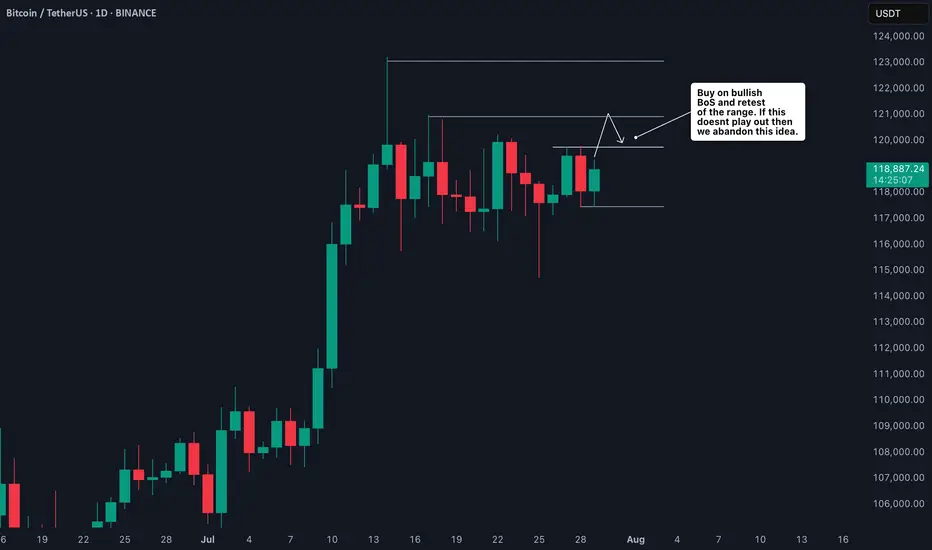
BTC Trade Plan: Watching for Break and Retest Above Daily Range🟠 Bitcoin (BTC) is currently trading range-bound on the daily timeframe ⏳📉📈. I’m monitoring price action for a bullish break and retest 🔓🔁 of the current range to confirm a potential long entry 🎯.
📍 Key levels are already marked on the chart 🗺️—
🛑 Stop-loss would sit just below the previous swing low,
🎯 Target aligns with the higher price zone marked out to the left of the chart 🔼👈.
This is a classic range breakout setup—patience and precision are key.
🧠 As always, this is not financial advice.
USDTBTC trade ideas
"BTC Moves Down — Scenario Confirmed"As expected, the market couldn’t sustain the overheating.
Over the past few days, Bitcoin has shown clear signs of weakness. The rally from $105K to $118K happened too quickly, without proper correction, and with noticeably declining volume toward the end of the move. In such situations, the market often loses footing — and that’s exactly what we’re seeing now: BTC has corrected down to $114,000.
If you've been following my analysis, you know I pointed out signs of overheating earlier: strong deviation from moving averages, weak reaction at key resistance levels, and upward wicks without volume confirmation. My indicator gave an early warning of trend weakening around the $117–$118K zone. That’s when it became clear momentum was fading.
This isn’t a crash or panic — it’s a normal, healthy market correction. Overleveraged long positions are getting flushed out, and late entries at the top are being shaken off. In such phases, it’s crucial not to react emotionally but to follow a clear system.
The key point: markets don’t reverse “suddenly.”
Everything happening now was visible in advance — if you were looking not just at price, but at the structure of the movement.

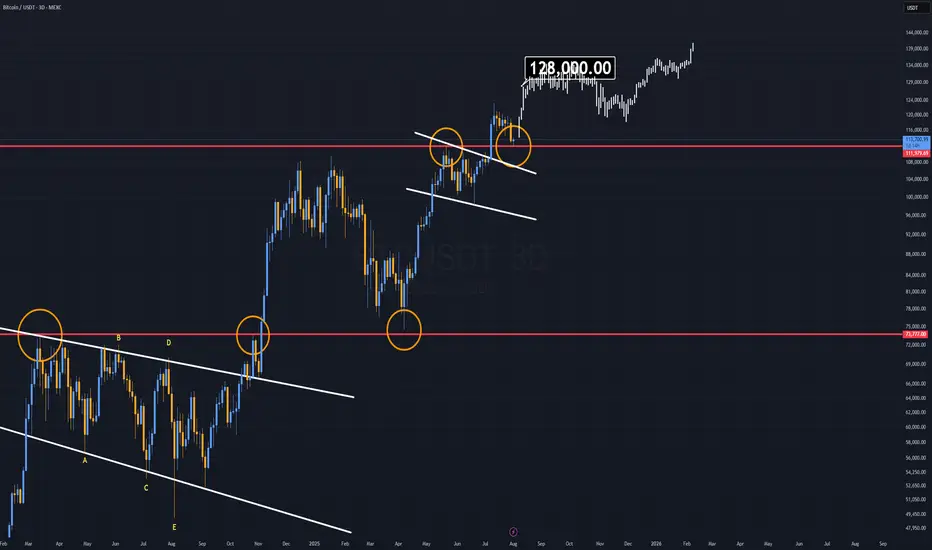
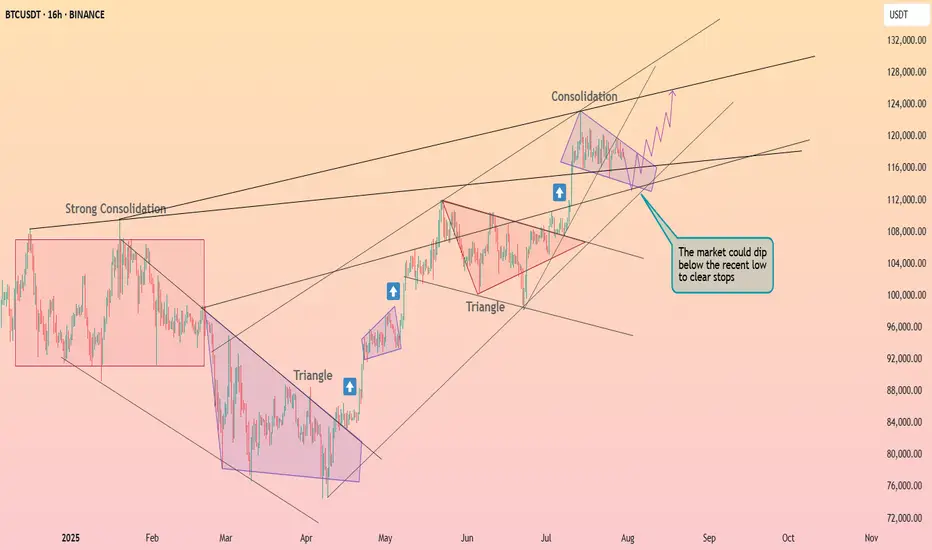
Bitcoin Analysis (3D)Bitcoin is currently trading in a very specific zone that resembles a classic bull flag continuation pattern, similar to the one we saw during last year’s rally.
Back then, a slow-forming bull flag broke to the upside, pushed to new all-time highs, and then retested the top of the same flag before continuing higher.
Now, we are witnessing a similar setup, but this time the formation has developed much faster.
The key difference:
While last year’s bull flag took a longer time to mature, the current one is more compressed, indicating a potentially sharper move if confirmed.
The $108K daily level is critical.
As long as Bitcoin remains above this level, the structure favors a new rally.
This could be the start of another impulsive leg, targeting the $128K Area.
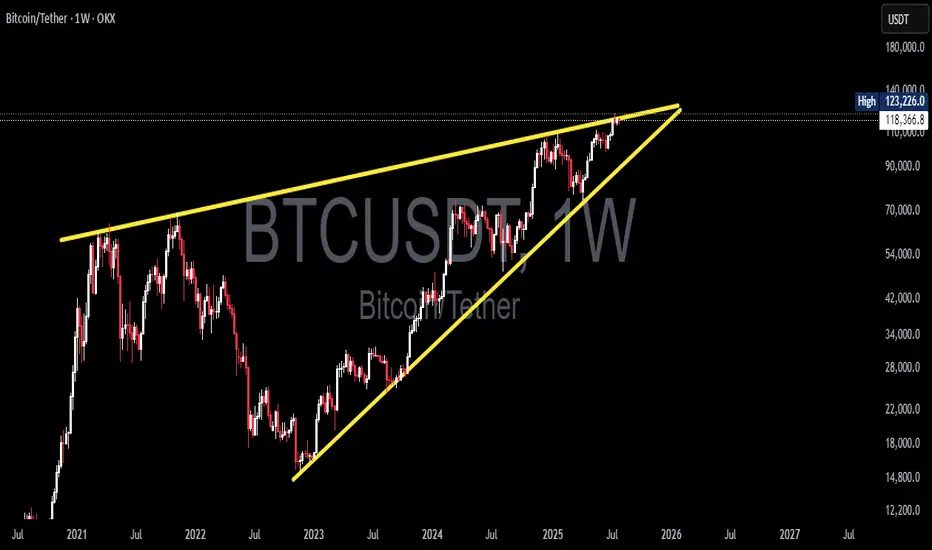
Bitcoin at a Decisive Moment! Rising Wedge Formed — Breakout?🧠 In-Depth Technical Analysis (BTCUSDT – Weekly Timeframe)
Bitcoin is currently trading within a large Rising Wedge pattern, formed over the long term from late 2022 to mid-2025. This structure is typically a bearish reversal formation, although it can also lead to a breakout in strong bull markets.
The wedge is defined by:
Consistently higher lows on the lower trendline
A gradually rising upper resistance line that currently caps price around $123K–$125K
Decreasing volume, indicating consolidation and energy buildup near the apex
This wedge reflects a period of euphoric price action post-2022 bear market accumulation, with price now testing the top of a historically significant resistance zone.
---
📊 Key Price Levels:
🔹 Current Price: ≈ $118,436
🔹 Recent Weekly High: $123,226
🔹 Critical Resistance (Wedge Top): $123,000–$125,000
🔹 Dynamic Support: Rising wedge base (~$90,000–$95,000)
---
🐂 Bullish Scenario: “Historic Breakout Incoming”
If BTC successfully breaks above the wedge’s upper resistance and closes a weekly candle above $125K with strong volume, it would signal a confirmed breakout from the long-term wedge structure.
📈 Upside Targets:
🎯 Target 1: $140,000
🎯 Target 2: $155,000+ (based on Fibonacci extension and macro targets)
🚀 A breakout of this magnitude may trigger a new parabolic rally, especially if accompanied by:
Increased institutional adoption
Spot ETF inflows
Favorable macroeconomic shifts (e.g., rate cuts)
---
🐻 Bearish Scenario: “False Breakout or Breakdown Risk”
If Bitcoin fails to break out and faces strong rejection from the resistance zone (possibly a false breakout), the rising wedge formation may break down — leading to a steep correction.
📉 A breakdown from this structure often leads to sharp drops due to:
Overextension of the current trend
Distribution phase by smart money
🎯 Downside Targets:
Support 1: $95,000–$90,000
Support 2: $76,000
Major Support: $54,000 (historical demand & EMA zones)
---
🔍 Optional Indicators for Chart Confirmation:
Weekly RSI: Watch for bearish divergence
Volume Profile: Can highlight distribution or accumulation zones
EMA 21/50: Ideal for identifying dynamic support levels in retracements
---
📌 Conclusion:
Bitcoin is at a crucial inflection point within this multi-year Rising Wedge. A confirmed breakout could lead to new all-time highs, while a breakdown may trigger a broad correction. Traders should prepare for high volatility, wait for clear confirmation signals, and manage risk wisely in this pivotal zone.
#Bitcoin #BTCUSDT #RisingWedge #BTCBreakout #TechnicalAnalysis #CryptoMarket #PriceAction #BearishReversal #CryptoSignal #ChartPattern #BitcoinAnalysis #Cryptocurrency
Okay, Let's Take a Live Look Into the Market 📺⚡ Okay, Let's Take a Live Look Into the Market 💹🔥
Important levels across S&P 500, Bitcoin, and XRP are all flashing 🔴 right now. Here's what I'm seeing in real-time:
📈 S&P 500 Futures – 6,351 Is Everything
The 6,351 level marks the midpoint of the rising channel.
On Friday, I flagged 6,430 as critical resistance — price rejected perfectly.
Now we’re attempting a rebound, but we’re stuck at mid-channel.
⚠️ A confirmed breakout above 6,351 could reignite upside momentum.
👉 Yes, this is a 1-minute chart, but precision matters when watching key structural levels — especially in legacy indices.
💥 BTC – 115,700: The Grandmaster Level
Zoom out and see the massive yellow horizontal on the chart: 115,700.
It’s not just any number — this is the ultimate resistance-turned-support battleground.
We’re currently under it, which keeps pressure to the downside.
A reclaim flips the structure bullish and opens room for trend continuation.
📌 Until we’re above it, this remains the dominant resistance across the entire crypto macro framework.
🧩 XRP – Still Facing Rejection
On the 2H/3H chart, XRP continues to flirt with resistance but fails to confirm strength.
This aligns with both the S&P 500 stalling at 6,351 and Bitcoin being capped at 115.7K.
📉 When multiple assets respect key levels in sync, it signals market-wide hesitation.
🔄 Cross-Market Confluence
It’s fascinating to watch:
A TradFi index (S&P)
A macro crypto asset (BTC)
A mid-tier alt (XRP)
...all pivoting around hyper-precise structural resistance at the same time.
✅ These aren’t coincidences. They’re systemic correlations.
🔮 What’s Next?
If S&P 500 breaks above 6,351, it could act as a risk-on signal.
That momentum could help BTC flip 115,700 — a massive deal.
And if that happens, XRP could finally follow with a stronger move.
Until then? We respect resistance and wait for confirmation. 📊🔍
One Love,
The FXPROFESSOR 💙
Disclosure: I am happy to be part of the Trade Nation's Influencer program and receive a monthly fee for using their TradingView charts in my analysis. Awesome broker, where the trader really comes first! 🌟🤝📈

BTC Roadmap Ahead: Ideal Entry, TP Zones & What to AvoidAs long as Bitcoin stays above the ~$98,200 zone on the daily timeframe, I believe the bullish trend remains intact.
No need to panic — what we need now is rational decision-making, not emotional reactions.
Since price has reached a key area around $118K–$120K, I’ve already taken partial profits at this level.
If no major fundamental changes occur and conditions remain stable, I see the maximum target for this leg somewhere between $134K and $140K, where I plan to secure additional profits.
Right now, my main objective is to increase my Bitcoin holdings.
The first buy zone I’m watching is around $110K, clearly marked with a red circle on the chart.
When price reaches this zone, I won’t enter immediately — I’ll wait for consolidation and confirmation, as a deeper correction is still possible.
There’s no need to rush — patience is power.
📌 All I’m trying to do is accumulate as much Bitcoin and sats as I can — because I know one day, I’ll be proud of it.
🔁 This analysis will be updated whenever necessary.
Disclaimer: This is not financial advice. Just my personal opinion.

TradeCityPro | Bitcoin Daily Analysis #137👋 Welcome to TradeCity Pro!
Let’s go over the Bitcoin analysis. I’m making a change to how I analyze Bitcoin — I will no longer include indicators like dominance charts.
🔍 From now on, I’ll be analyzing Bitcoin in daily, 4-hour, and 1-hour timeframes only.
📅 Daily Timeframe
On the daily timeframe, Bitcoin is in a strong uptrend that started from the 78,397 level and in two bullish legs has reached the 122,733 zone.
✅ This level, along with the 0.618 Fibonacci Extension, has created a strong resistance zone. Although price has attempted multiple times to break into or above this area, it has not yet succeeded in closing a candle above or inside the range.
🎲 We also have a curved trendline from higher timeframes, which the price is reacting to even on the daily chart. Currently, the price is near this trendline. There is a possibility that price consolidates over time until it reaches this trendline and then begins its next bullish leg.
📊 If that happens, breaking 122,733 or 120,140 would be triggers for opening a long position on the daily timeframe.
I do not recommend buying Bitcoin on spot right now, because I believe we’re close to the top of this bullish cycle, and this current leg might be the last one.
⭐ A breakout of 76.50 on the RSI would be a strong confirmation of bullish momentum, and would mark the continuation of the uptrend.
🔑 If we get a pullback, the price could correct to dynamic zones like SMA25 or SMA99. Important static support levels are at 110,183 and 100,763.
⏳ 4-Hour Timeframe
In the 4-hour chart, we can see more details of the bullish leg. After the sharp move to 122,733, a correction phase began, forming a range box.
💥 The bottom of the box is around 116,829, which I’ve marked as a zone. It also overlaps with the 0.382 Fibonacci, making it a very important PRZ (Potential Reversal Zone).
The top of the range is at 120,041.
🧩 Yesterday, price made a fakeout to the downside. As you can see, it dumped hard with heavy selling volume and hit the 0.5 Fibonacci level, but couldn’t hold there and quickly bounced back above 116,829.
🧲 Today, I think it's better not to go below the 4-hour timeframe and avoid getting caught up in small market noise.
A break above 120,041 can trigger a long entry.
Another breakdown from the box might trigger a deeper correction.
❌ Disclaimer ❌
Trading futures is highly risky and dangerous. If you're not an expert, these triggers may not be suitable for you. You should first learn risk and capital management. You can also use the educational content from this channel.
Finally, these triggers reflect my personal opinions on price action, and the market may move completely against this analysis. So, do your own research before opening any position.

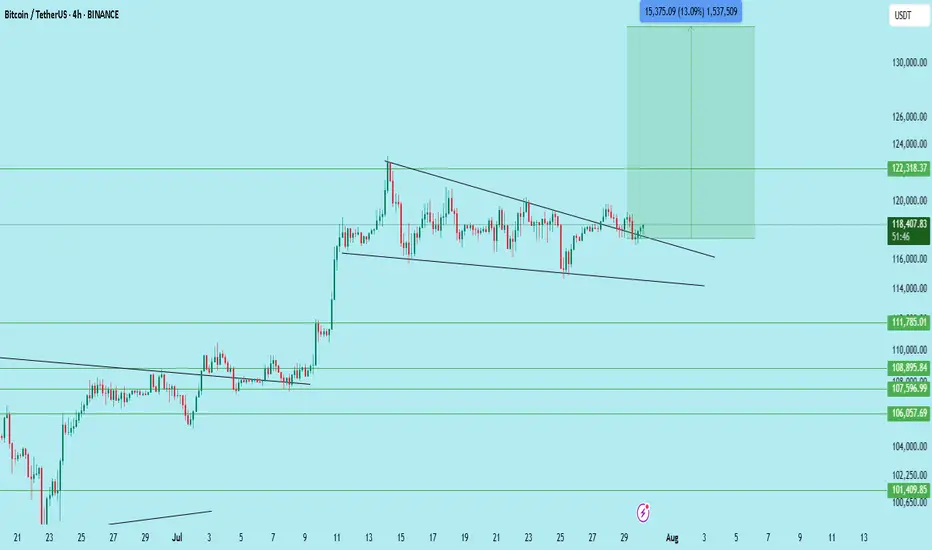
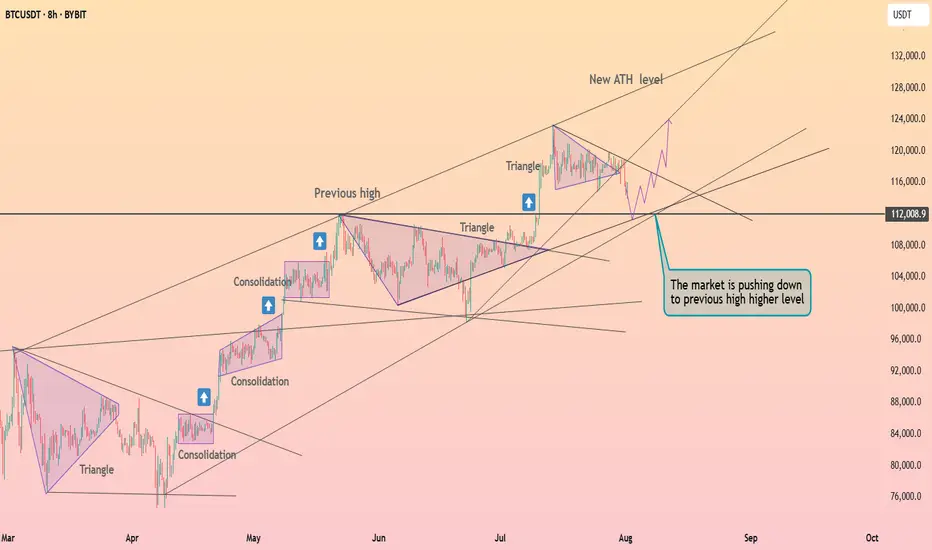
$BTC/USDT – Bull Flag Breakout on 4H | Targeting $133,700Bitcoin has just broken out of a well-defined bull flag structure on the 4H chart, signaling a potential continuation of the previous uptrend.
This breakout comes after a strong impulsive move upward, followed by a textbook flag consolidation with lower highs and lows forming a descending channel. The breakout above the flag resistance suggests a bullish continuation pattern is in play.
Technical Breakdown:
Pattern: Bull Flag (Continuation)
Flagpole base: ~106,700
Breakout zone: ~117,600
Retest Support: 116,000
Immediate Resistance: 122,300
Expected Target: 133,700 (based on flagpole projection)
Invalidation: Breakdown below 115,500
Expected Move:
Measured Move Target: ~13% upside from breakout
Confluence: Target aligns with past supply zone near 133K–135K
Price has also reclaimed the 50 EMA on the 4H chart, and the volume on the breakout shows bullish interest. Watching closely for a clean retest of the breakout zone for confirmation.
Conclusion:
BTC is showing bullish continuation after breaking out of a flag. A successful retest of 117.6K–116K range could offer further upside. Traders should manage risk accordingly.
DYOR | Not Financial Advice
Market StructureIf we look at the underlying market structure, Bitcoin's structure isn't fully formed yet. There are still unsolved puzzles around 135,000. I believe Bitcoin will finalize its final structure around 135,000, which will be its expansionary structure.
The final candle on this weekly timeframe will determine Bitcoin's direction. This August, Bitcoin will either continue its bullish structure or continue its minor retracement.
Disclamer: Any information provided is for educational and informational purposes only and does not constitute investment advice.

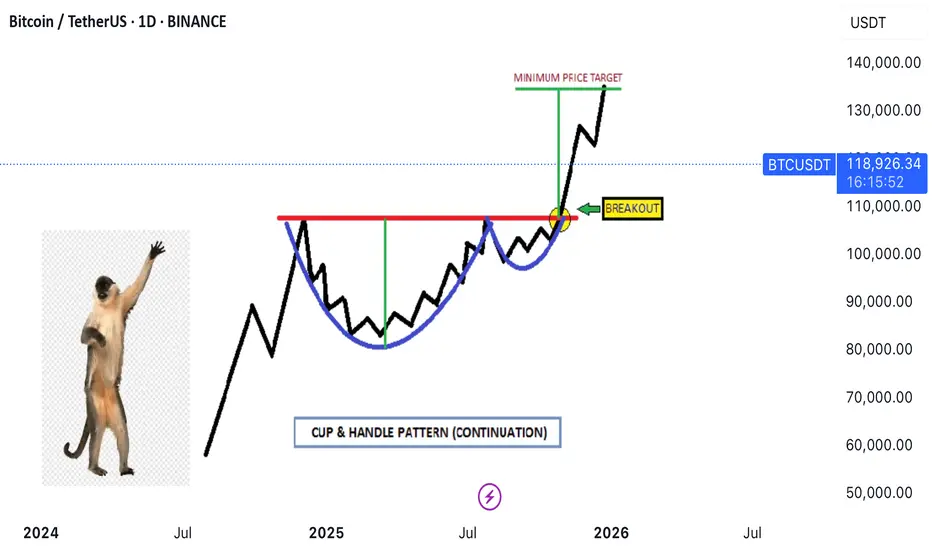
BTC DAILY - CUP & HANDLE BREAKOUT TARGETING $169KBitcoin just confirmed a macro Cup & Handle breakout with a strong push above the $112K neckline. The price is now consolidating above key moving averages – setting up for a potential explosive continuation. 🔥
🟢 Technical Highlights:
📈 Cup & Handle pattern – classic bullish continuation
💥 Breakout target: +32% move → $169,000
🟩 1D MA 50 / MA 200 acting as dynamic support
🔄 MACD bullish cross confirming momentum
🟦 Breakout above major resistance = new market structure zone
🧲 Psychological support near $99K and $112K
***********************************
🎯 Buy Signal Details:
Entry Zone (Pullback Valid): $112,000–$114,000
Take Profit: $169,000 🎯
Stop Loss: $99,000 🛡️
Buy Confidence: 95% ✅
📌 Not financial advice. This is pure chart-based technical analysis.

Thea **Cup and Handle** pattern✨ **Imagine the market serving profits in a teacup!**
Thea **Cup and Handle** pattern isn’t just a technical term—it’s the market whispering, *“Get ready for liftoff!”* Let’s break it down in an engaging way:
### ☕ The Cup
- Picture a graceful drop in price that curves back up, forming a U-shape.
- It’s like the market takes a sip, then refills—symbolizing recovery and building strength.
### 🛠️ The Handle
- After the cup fills, the price dips slightly again, forming a small slope downward.
- This is the “handle”—a moment of consolidation, often with lower trading volume.
- It’s the calm before the bullish storm.
### 💡 Bullish Signal
- When the price **breaks above the handle’s resistance**, it’s like the market pulls the trigger.
- This signals a potential buying opportunity as the trend resumes upward.
### 📆 Duration
- The cup can take weeks or even months to form, while the handle is shorter and more subtle.
- Patience pays off, as the breakout often leads to explosive momentum.
---
🏆 *Want proof?* Check the comments—one of our past trades using this exact pattern scored a massive win of **100,000 pips**! 🚀
Technical analysis isn’t just charts and numbers—it’s decoding the market’s rhythm.
longI think the pullback is complete and the beat can grow, but I'm still paying attention to the Dominance Beat. Thank you for your attention.

127k after small fall to 112k . buy altcoins in 112k
Hello. Wait for a small correction to the 112k range. There is still wave 5 left to end this bullish move, which I think will make a new record in the 127k range.

Bitcoin exited from the triangle ┆ HolderStatBINANCE:BTCUSDT is dipping to retest $112,000, the last breakout level. The price remains inside a large ascending triangle and may soon resume its uptrend. If this support holds, targets above $125,000 come back into play.
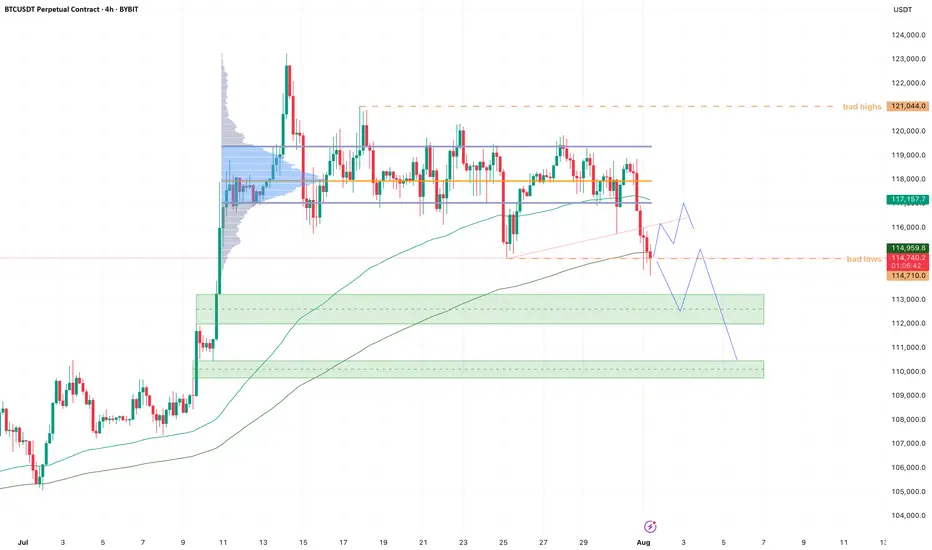
BTC - Cleaned up the lows!Bearish momentum is starting to stall here at the lows.
New month, and we started it by cleaning up the previous month's bad lows.
If we can hold here I'm looking for a trendline retest and VAL retest soon. Maybe we get one more sweep of the low, giving us a three drive pattern.
Reclaim VAL then it's back to VAH, maybe take out all the bad highs.
If we start bleeding into the lower demand zone (green box), I will start paying attention for a potential bearish retest into 110k, which we be our last area of imbalance to fill.
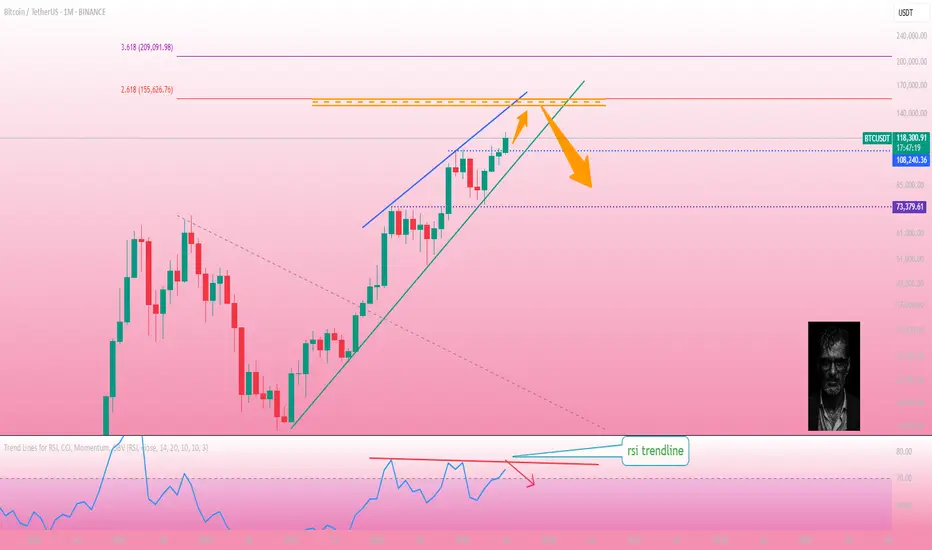
Bitcoin on a monthly time frameBitcoin on the monthly time frame.
If the monthly candle closes in this way, the price is expected to move to the 618 Fibonacci area. According to the trend line in RSI, we will enter a correction phase after the price rises.
BTC Long trade I'm taking a long position on BTC at 117,100, with a stop-loss at 116,800 and a target of 118,900. I'm taking this trade on the basis of technical analysis and price action.

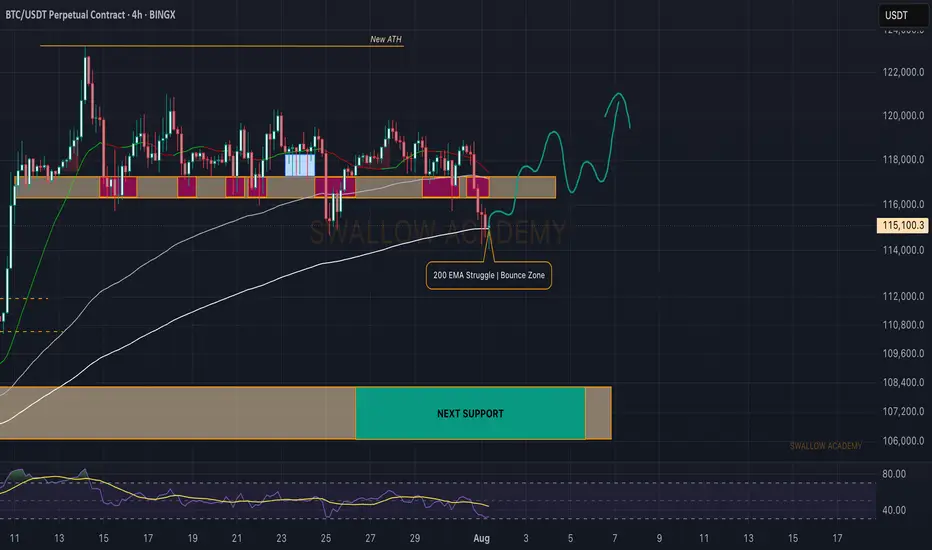
Bitcoin (BTC): 200EMA is Key Are Currently | Red Monthly OpeningBTC had a really sharp start to the month, and we are back near $115K, which was a key zone for us last time (due to huge orders sitting there).
Now, we see a similar struggle like last time but not quite the same, as the 200EMA has aligned with the $115K area. We are now looking for any signs of MSB, as we think we might get a recovery from here.
Now if we do not recover right now (by the end of today), we are going to see a really deep downside movement during the weekend most likely!
Swallow Academy
Bitcoin held the $115k level ┆ HolderStatBINANCE:BTCUSDT is currently in a triangle formation just above key support near 112,000. The price recently dipped below short-term support, likely triggering stop-losses, but still holds inside a bullish structure. If momentum builds, a push toward 125,000+ is likely. The trend remains intact above 110,000.
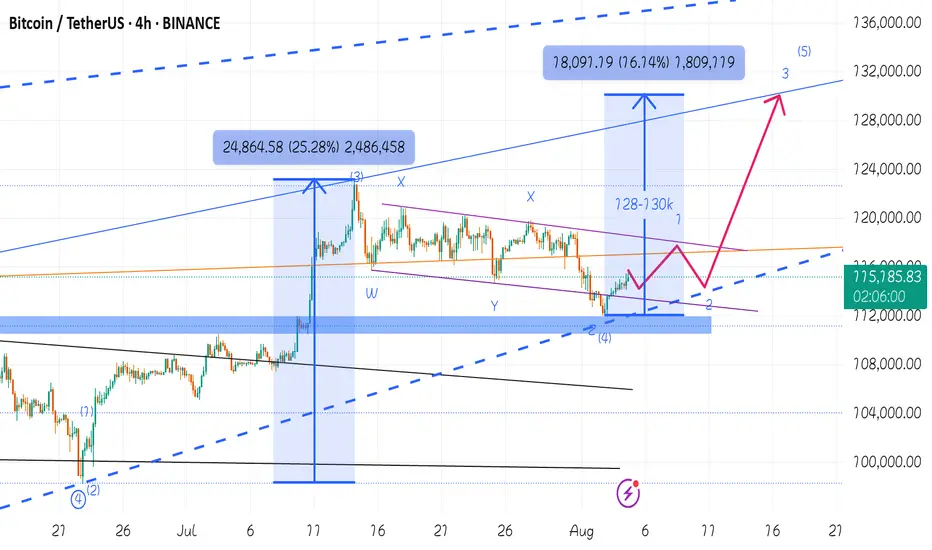
You don't know what's going on , 130K waiting for youI have shown in my previous post that Bitcoin is looking for a correction of wave 4 from wave 5 of the main wave 3 of Elliott waves, I said wait for 112k and then buy altcoins. It seems that the Elliott wave 4 micro-wave has completed its correction with the 50% Fibonacci percentage, I predict Bitcoin will touch the 128-130k levels at the end of Elliott wave 5. as I said before altcoins season is in the midway
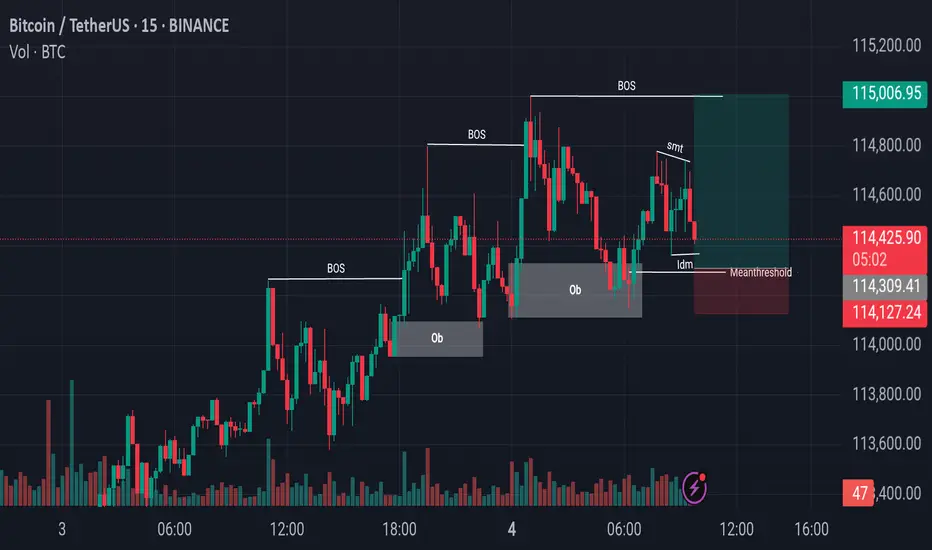
Bitcoin Price Flow From Liquidity Grabs to Structural BreakoutsBitcoin Price Action Analysis:
In recent sessions, Bitcoin has been consistently making Breaks of Structure (BoS) to the upside, indicating a strong bullish trend. Most recently, after forming another BoS, the market retraced downward and precisely tapped into a previously established Bullish Order Block (OB). This reaction led to a temporary upward movement; however, during this process, the market also created a zone of internal liquidity.
Currently, Bitcoin is showing signs of a downward move again, potentially aiming to capture Internal Drawdown Market (IDM) liquidity. Just below this level lies another key Order Block, which could serve as a strong support zone. If the price reacts positively from this region, we might see the market initiate another upward leg, potentially forming the next Break of Structure to continue the bullish narrative.
Note: Always perform your own research (DYOR) before making any trading decisions.
Daily Bitcoin AnalysisBitcoin is at support at $115,000. Personally, I think this support will not hold and it will reach the next level of 112,000. Why? Because the downward momentum of the price is high.
This is not financial advice

Bitcoin (BTC): Failed Dump | Buyers Still in Control Bitcoin recently had another wave of selling, where buyers once again showed their dominance near the local $116K zone and pushed the price of BTC back up.
We remain bullish, as we see the buyside dominance above the 116K area, so our target is still the current ATH; let's see.
Swallow Academy
