I'm now neutral...My apologies about the previous post.... i was wrong the trend in the short term was clearly downwards and needed to exhaust before a continuation or reversal to the upside...
USDTRY_TOD trade ideas


Waiting for reversal signal on strong supportWaiting for reversal signal. This was a strong support for sereval times.

USDTRY Long The price is at the support level. I look forward to growth to the nearest resistance. My target is 8.482
Traders, if you like this idea or have your own opinion about it, write in the comments. I will be glad👩💻

ShortIf we are looking in economy of turkey , they improved because of speed of vaccination , than tourist comes in this country again !!!

USDTRY LONG!!Beautiful Chart.
Please note that by tradition a descending triangle is bearish. Wrong, the context (point in chart) should never be overlooked. In that, if it's at a top it should be traded with extreme prejudice for going short and at bottom of a trend the opposite . Furthermore, even at bottom sometimes they fail.
Now this chart is showing strength with the quad bottom setup having bounced off this support area 3 other times this should be four.. Please see candle stick prediction (hot pink)

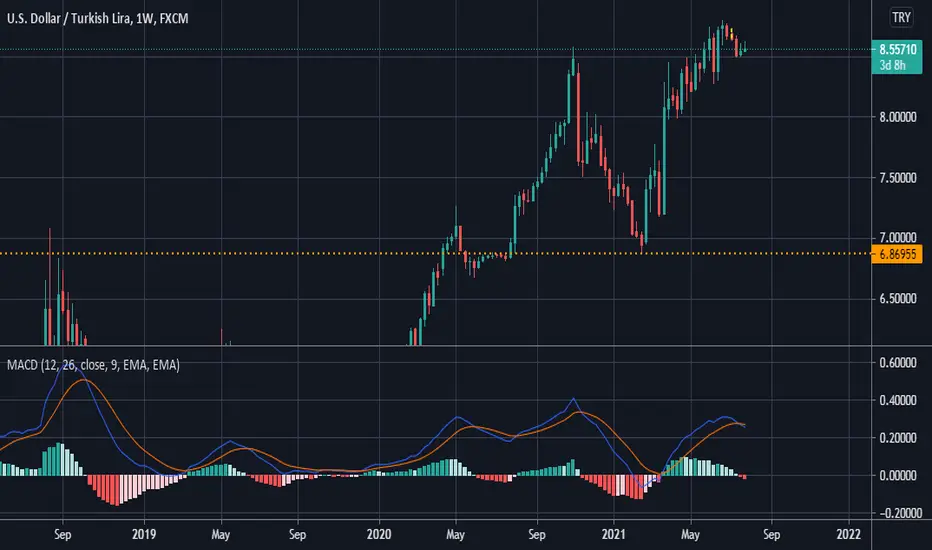
USD/TRY: the lira is strengtheningCurrent trend
For two months, the pair USD/TRY has been trading in a downtrend and is currently at 8.3984 (Murrey ).
This week, the lira was supported by officials’ statements. Turkish Vice President Fuat Oktay said the country's economy will continue to recover. In Q1, it already grew by 7%, and in the future, the pace will accelerate further due to an increase in exports, the volume of which should exceed $200 billion by the end of the year and may reach the government's goal ($210 billion). August data on Turkey's economic confidence index released today was positive. The indicator rose for the third consecutive month and reached 100.80 points.
Currently, the price has stabilized around 8.3984 as investors await a speech by US Fed Chairman Jerome Powell at a symposium in Jackson Hole. Experts believe that the head of the regulator will not comment on the timing of the start of monetary stimulus reduction and will declare the need to continue monitoring the economic situation. In this case, the dollar may again fall under pressure.
Support and resistance
The downtrend persists, as evidenced by the downward reversal of Bollinger Bands and growth of MACD histogram in the negative zone, but the upward reversal of Stochastic in the oversold zone does not exclude corrective growth. The level of 8.4960 (Murrey , the midline of Bollinger Bands) is the key for the "bulls". Its breakout will give the prospect of growth to 8.5937 (Murrey ) and 8.6914 (Murrey ). Otherwise, the decline may resume to 8.3007 (Murrey ) and 8.2031 (Murrey ).
Resistance levels: 8.3984, 8.4960, 8.5937, 8.6914.
Support levels: 8.3007, 8.2031.


USD/TRY Critical Band8.80-8.30 band has a critical head-Shoulders image.
If this is broken, a downward movement of 50kr may come.
Even if the dollar appreciates, there is a positive atmosphere in macroecnomy, that will provide this breakdown.


USDTRY growth from LEVELThe price returns to support for possible consolidation. The trend is upward. I expect the price to rise to resistance from support level 8.483
Traders, if you like this idea or have your own opinion about it, write in the comments. I will be glad👩💻

USDTRY Breakout of it's resistance* USDTRY was trading below it's resistance zone near 8.58000, now it breaks it's resistance and retesting the same level.
* The previous resistance for the price is now working as support. After a proper retest we can expect a healthy move till 8.77000.
* USDTRY is bearish below it's support zone.

USDTRY short to SUPPORTThe price closed above the resistance level. It seems to me that it will not be possible to break through the level the first time, so I expect a rollback from 8.615 to support 8.482
Traders, if you like this idea or have your own opinion about it, write in the comments. I will be glad👩💻

USDTRY, BUYA good week to buy USDTRY. As the tendency shows Dollar index has started again to rise, the result of this Turkish lira is going to cheapen.

USDTRYDow Theory applied on USDTRY pair for trend analysis. Strategy is to take long and wait for new high high formation.

USDTRY 4H AnalysisHi,
Wait while the price breakout the resistant line
This is my simple idea for USDTRY 4H time frame
I hope it is useful :)
Note 1 : It may take one or 2 weeks
Note 2 : DON'T FORGOT, STOPLOSS IS YOUR FRIEND :)
Best regards :)


USDTRY short after pullback The price at the end of last week broke through the support level 8.48, having broken the ascending price channel earlier downward. After a rollback to the level, I expect a fall down to the support of February 2021.
Traders, if you like this idea or have your own opinion about it, write in the comments. I will be glad👩💻


lets see the waymacd shows to downward but we're in the below of the channel still. lets watch where will we go.