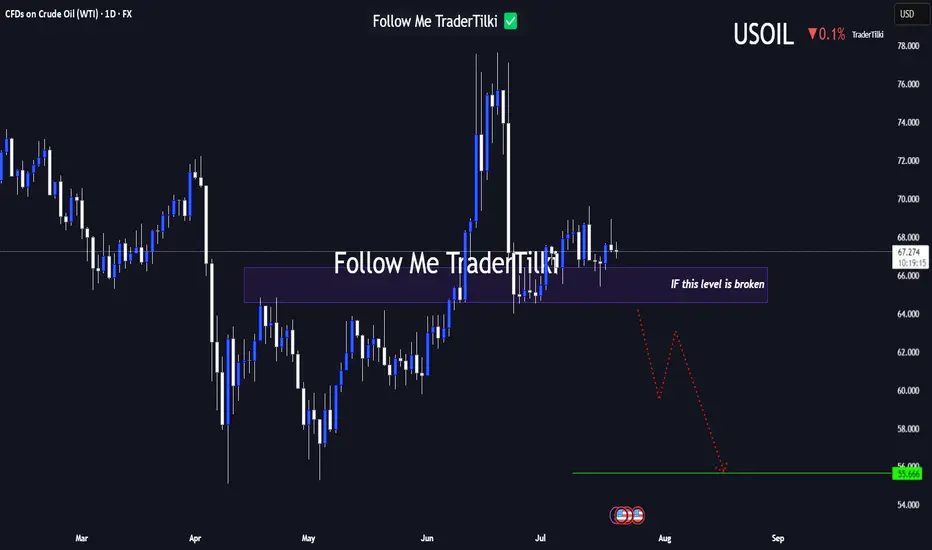
USOIL Under Technical Pressure: 1D Timeframe Breakdown Hey Guys,
The 66.584 level currently stands as the strongest support zone for USOIL. If this level breaks with a candle close, the next major target could drop to 55.666.
This setup is based on the 1-day timeframe. I highly recommend keeping a close watch on that key level.
Every like from you is
About U.S. DOLLAR / WTI CRUDE OIL
Crude Oil is a naturally occurring liquid fossil fuel resulting from plants and animals buried underground and exposed to extreme heat and pressure. Crude oil is one of the most demanded commodities and prices have significantly increased in recent times. Two major benchmarks for pricing crude oil are the United States' WTI (West Texas Intermediate) and United Kingdom's Brent. The differences between WTI and Brent include not only price but oil type as well, with WTI producing crude oil with a different density and sulfur content. The demand for crude oil is dependent on global economic conditions as well as market speculation. Crude oil prices are commonly measured in USD. Although there have been discussions of replacing the USD with another trade currency for crude oil, no definitive actions have been taken.
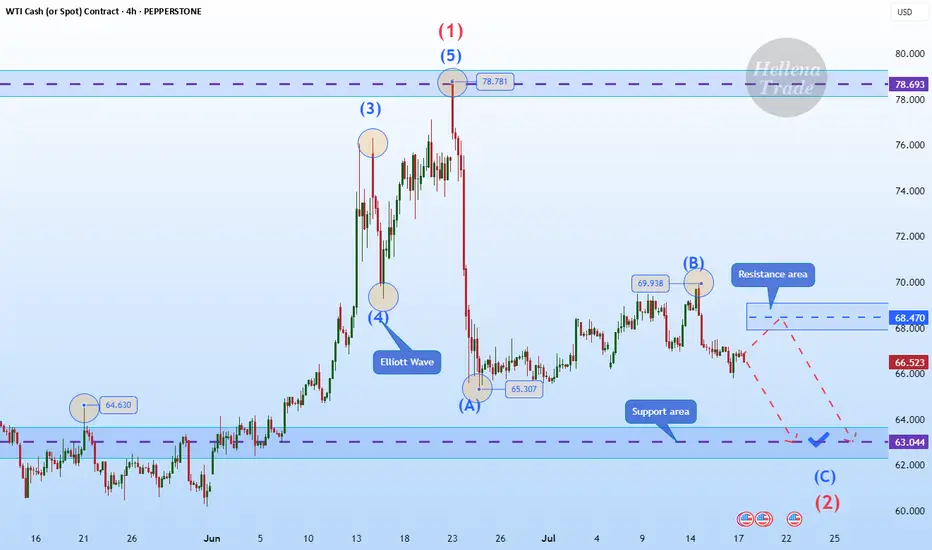
Hellena | Oil (4H): SHORT to support area of 63.000.Colleagues, I believe that wave “B” has formed at the level of 69.938, and now we expect the downward movement to continue with the aim of completing wave ‘C’ of the middle order and wave “2” of the higher order in the support area of 63,000.
It is quite possible that the price could reach the 60,0
Bullish bounce?WTI Oil (XTI/USD) has bounced off the pivot and could rise to the 1st resistance that is slightly below the 50% Fibonacci retracement.
Pivot: 65.64
1st Support: 60.22
1st Resistance: 71.20
Risk Warning:
Trading Forex and CFDs carries a high level of risk to your capital and you should only trade

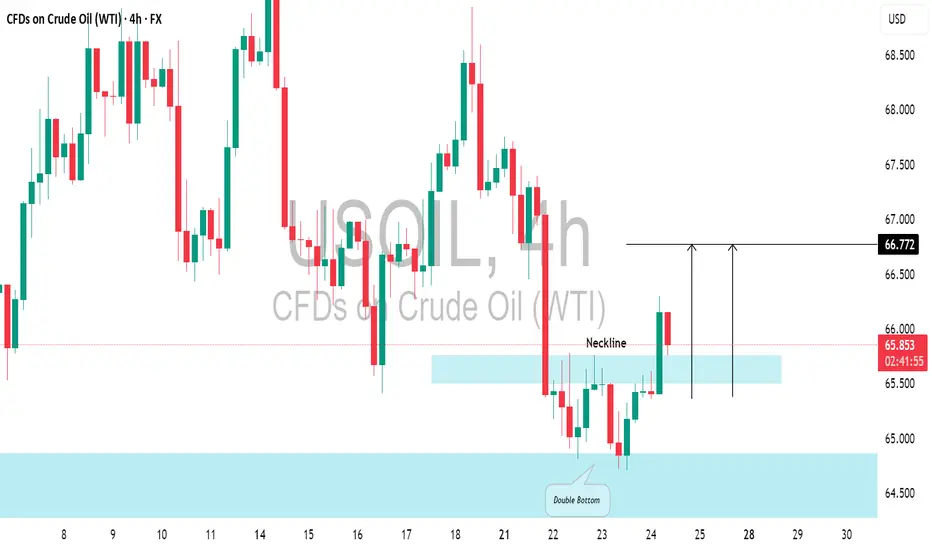
US CRUDE OIL (WTI): Pullback From Support📈USOIL responded well to the highlighted daily support level.
The price formed a double bottom pattern on that and broke above its neckline.
There's a strong likelihood that the price will continue to increase and reach 66.72 shortly.
LONG ON USOIL OIL has just completed a sweep of sell side liquidity, leaving behind lots of BUY side liquidity.
DXY is falling on top of economic news stating trump will possibly fire Jerome Powell.
All this with OPEC increase oil production.
I expect oil to make a $5-$10 move throughout the rest of the wee

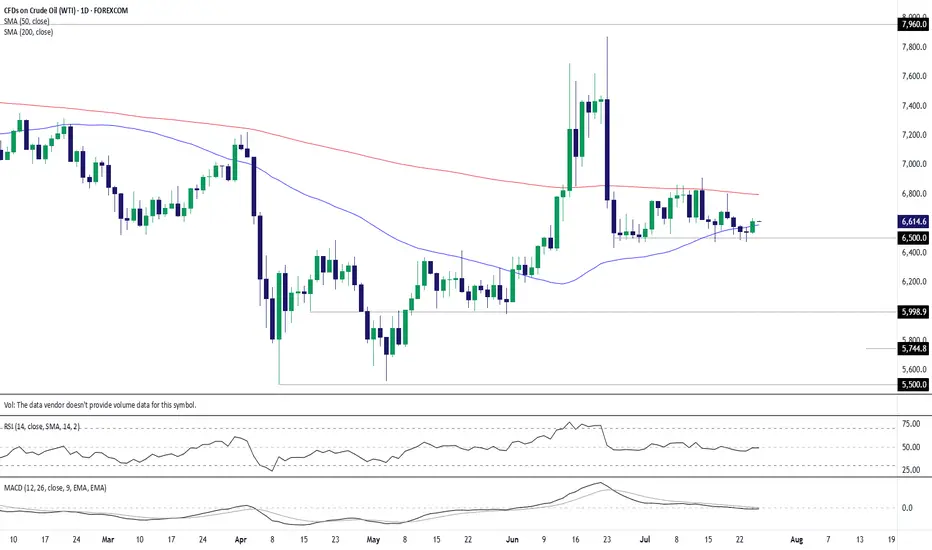
WTI OIL Extreme 1D MA50-200 squeeze to deliver break-out!WTI Oil (USOIL) has been consolidating for almost the past 30 days within the 1D MA50 (blue trend-line) and 1D MA200 (orange trend-line). The squeeze is now so tight that the trend will be revealed soon with a break-out.
Based on the 2-year Channel Down, that should be bearish, resembling the May 2

Oil Bearish for next weekOil will be bearish for next week. Toxic Sell and Calender spread shows the direction.

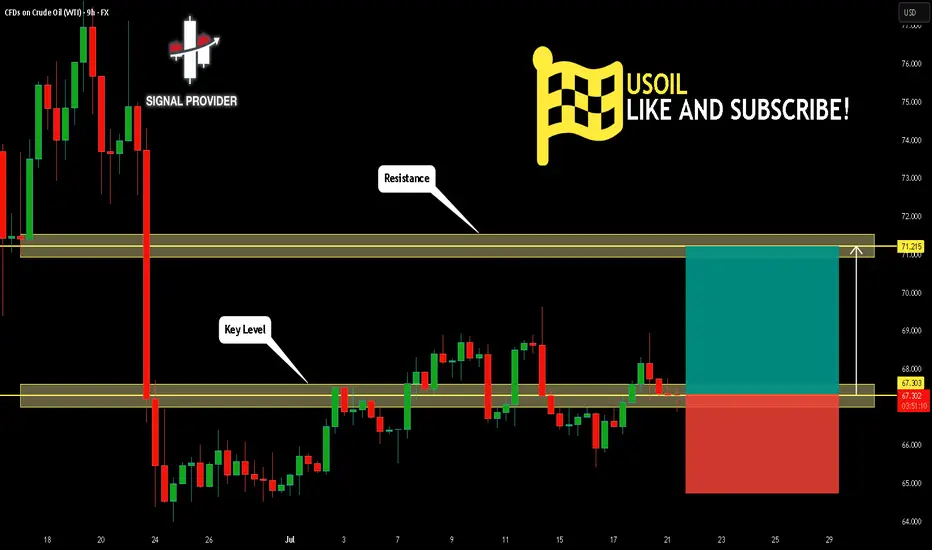
USOIL Will Go Higher! Buy!
Take a look at our analysis for USOIL.
Time Frame: 9h
Current Trend: Bullish
Sentiment: Oversold (based on 7-period RSI)
Forecast: Bullish
The market is approaching a key horizontal level 67.303.
Considering the today's price action, probabilities will be high to see a movement to 71.215.
P.S
One Last Dip Before the Pop?On the daily timeframe, we anticipate two possible scenarios for USOIL’s movement. In the red-labeled scenario, USOIL is expected to undergo a correction to test the 63.71–64.03 area. However, in the best-case scenario, if USOIL manages to hold above 64.03, it has the potential to strengthen toward

WTI crude: $65 floor holds again as bulls test 50-day MAAfter nine failures to break and close beneath $65 per barrel over the past month, you have to wonder how much longer bears will persist in attempting to take out the level. Following a nice pop higher on Thursday, completing a morning star pattern and closing above the 50-day moving average, it may
See all ideas
Displays a symbol's price movements over previous years to identify recurring trends.