USDWTI trade ideas

Crude Oil Analysis 16-May-2025Crude oil analysis and what are the possible scenarios we could see.
Disclaimer: easyMarkets Account on TradingView allows you to combine easyMarkets industry leading conditions, regulated trading and tight fixed spreads with TradingView's powerful social network for traders, advanced charting and analytics. Access no slippage on limit orders, tight fixed spreads, negative balance protection, no hidden fees or commission, and seamless integration.
Any opinions, news, research, analyses, prices, other information, or links to third-party sites contained on this website are provided on an "as-is" basis, are intended only to be informative, is not an advice nor a recommendation, nor research, or a record of our trading prices, or an offer of, or solicitation for a transaction in any financial instrument and thus should not be treated as such. The information provided does not involve any specific investment objectives, financial situation and needs of any specific person who may receive it. Please be aware, that past performance is not a reliable indicator of future performance and/or results. Past Performance or Forward-looking scenarios based upon the reasonable beliefs of the third-party provider are not a guarantee of future performance. Actual results may differ materially from those anticipated in forward-looking or past performance statements. easyMarkets makes no representation or warranty and assumes no liability as to the accuracy or completeness of the information provided, nor any loss arising from any investment based on a recommendation, forecast or any information supplied by any third-party.

Bullish bounce?WTI Oil (XTI/USD) has bounced off the pivot, which acts as an overlap support that is slightly above the 50% Fibonacci retracement and could rise to the 1st resistance.
Pivot: 60.07
1st Support: 57.67
1st Resistance: 64.55
Risk Warning:
Trading Forex and CFDs carries a high level of risk to your capital and you should only trade with money you can afford to lose. Trading Forex and CFDs may not be suitable for all investors, so please ensure that you fully understand the risks involved and seek independent advice if necessary.
Disclaimer:
The above opinions given constitute general market commentary, and do not constitute the opinion or advice of IC Markets or any form of personal or investment advice.
Any opinions, news, research, analyses, prices, other information, or links to third-party sites contained on this website are provided on an "as-is" basis, are intended only to be informative, is not an advice nor a recommendation, nor research, or a record of our trading prices, or an offer of, or solicitation for a transaction in any financial instrument and thus should not be treated as such. The information provided does not involve any specific investment objectives, financial situation and needs of any specific person who may receive it. Please be aware, that past performance is not a reliable indicator of future performance and/or results. Past Performance or Forward-looking scenarios based upon the reasonable beliefs of the third-party provider are not a guarantee of future performance. Actual results may differ materially from those anticipated in forward-looking or past performance statements. IC Markets makes no representation or warranty and assumes no liability as to the accuracy or completeness of the information provided, nor any loss arising from any investment based on a recommendation, forecast or any information supplied by any third-party.

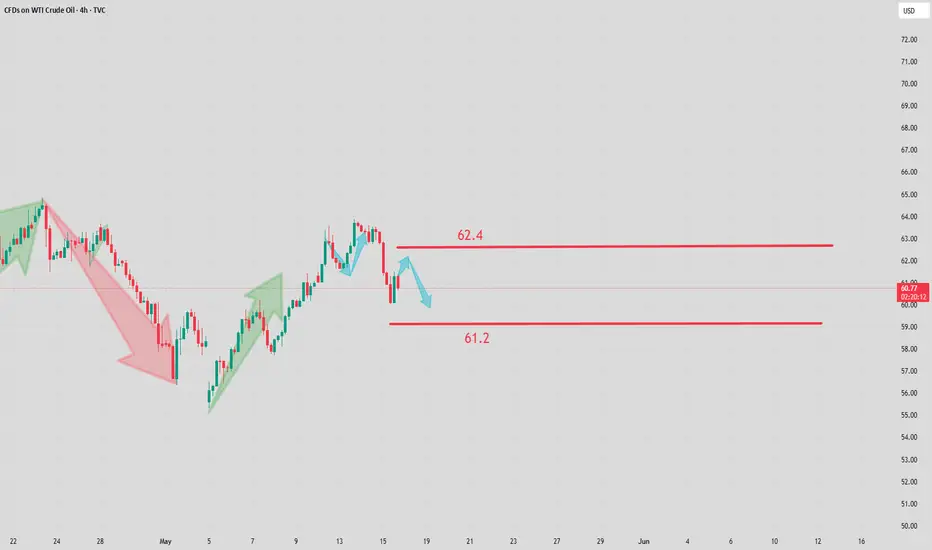
USOIL RISKY SHORT|
✅CRUDE OIL is going up to retest
A horizontal resistance of 62.00$
Which makes me locally bearish biased
And I think that we will see a pullback
And a move down from the level
Towards the target below at 60.62$
SHORT🔥
✅Like and subscribe to never miss a new idea!✅
Disclosure: I am part of Trade Nation's Influencer program and receive a monthly fee for using their TradingView charts in my analysis.

WTI Crude Returns to the $60 ZoneWTI crude oil has posted a drop of more than 4% in recent sessions as the market digests new announcements from OPEC+. The organization stated that current economic conditions could support growth in oil demand throughout 2025 and 2026. However, it remains firm in its decision to increase production starting in May and June, with monthly increments of 411,000 barrels per day, and has also announced another increase in July.
This stance has sparked concerns in the market about a potential short-term oversupply. If this strategy persists, selling pressure could return to WTI price action in the coming sessions.
Bearish Trend
Since January 20, a clear bearish trend has been forming, pushing the barrel’s price below the $60 mark. While a notable upward move is currently underway, it remains insufficient to break the prevailing bearish formation, which continues to be the dominant technical structure in the short term.
ADX
The ADX line was previously hovering around the 40 level, reflecting high volatility in price movements. However, it has begun to flatten, and if this continues, it could suggest a loss of directional strength, paving the way for a more neutral price behavior.
RSI
The behavior of the RSI mirrors that of the ADX. It is currently oscillating around the 50 level, indicating a balance between buying and selling pressure, and reinforcing the potential for a neutral phase in the short term.
Key Levels:
$65 – Current Resistance: Aligns with the 38.2% Fibonacci retracement and acts as a key psychological level. A breakout above this level could extend the current bullish bias over the coming sessions.
$67 – Distant Resistance: Matches the 50% Fibonacci retracement and a sideways zone observed in March. Sustained moves above this area could challenge the existing bearish structure on the chart.
$60 – Crucial Support: Represents a consistent area of indecision in recent months. If the price returns to this level, the previous bearish structure could regain strength in the short term.
Written by Julian Pineda, CFA – Market Analyst

Potential bullish bounce?USO/USD has bounced off the support level which is an overlap support that lines up with the 38.2% Fibonacci retracement and could potentially rise from this level to our take profit.
Entry: 60.39
Why we like it:
There is an overlap support level that aligns with the 38.2% Fibonacci retracement.
Stop loss: 57.93
Why we like it:
There is a pullback support level that lines up with the 71% Fibonacci retracement.
Take profit: 64.14
Why we like it:
There is a pullback resistance level.
Enjoying your TradingView experience? Review us!
Please be advised that the information presented on TradingView is provided to Vantage (‘Vantage Global Limited’, ‘we’) by a third-party provider (‘Everest Fortune Group’). Please be reminded that you are solely responsible for the trading decisions on your account. There is a very high degree of risk involved in trading. Any information and/or content is intended entirely for research, educational and informational purposes only and does not constitute investment or consultation advice or investment strategy. The information is not tailored to the investment needs of any specific person and therefore does not involve a consideration of any of the investment objectives, financial situation or needs of any viewer that may receive it. Kindly also note that past performance is not a reliable indicator of future results. Actual results may differ materially from those anticipated in forward-looking or past performance statements. We assume no liability as to the accuracy or completeness of any of the information and/or content provided herein and the Company cannot be held responsible for any omission, mistake nor for any loss or damage including without limitation to any loss of profit which may arise from reliance on any information supplied by Everest Fortune Group.

USOIL Temporary Drop seems inevitableOn Thursday, WTI crude oil futures prices fell approximately 3.5% during the session, extending losses after failing to test technical resistance levels. The decline was jointly driven by heightened expectations of a U.S.-Iran nuclear agreement and unexpected increases in crude oil inventories, both of which exerted heavy pressure on supply outlooks. Nevertheless, market analysis suggests the downside for the U.S. dollar may be limited. Improved global trade sentiment has reduced recession fears, leading markets to scale back expectations for aggressive Federal Reserve rate cuts. Data shows the probability of a 25-basis-point rate cut by the Fed in September is now 74%, down from earlier predictions of a July cut.
Crude oil continued to decline today, breaking the previous upward pattern, with a high probability that prices will trade in a broad range going forward. Overall, the magnitude of the decline has increased, suggesting a higher likelihood of further downside. Today's trading strategy considers shorting on rebounds as the primary approach, while waiting for long opportunities at lower levels. Resistance is focused on the $62.0–63.0 area, with support at $60.0–59.0.
you are currently struggling with losses, or are unsure which of the numerous trading strategies to follow, at this moment, you can choose to observe the operations within our channel.
TP REACHED ON USOILEarlier I posted to buy on USOIL, now the price reached our target to leave us with he first profitable trade of the day!
Follow for more!

CRUDE OIL Local Long! Buy!
Hello,Traders!
USOIL has retested a
Nice round horizontal
Support level of 60$
And we are predictably
Seeing a bullish reaction
From the level which we
Believe will take the price
A bit higher still
Buy!
Comment and subscribe to help us grow!
Check out other forecasts below too!
Disclosure: I am part of Trade Nation's Influencer program and receive a monthly fee for using their TradingView charts in my analysis.

BUY USOILBeen a while since I last posted about American Market,
I'm sharing with you a trade I caught on OIl that you still can take with the same SL and TP as mine.
Follow for more!

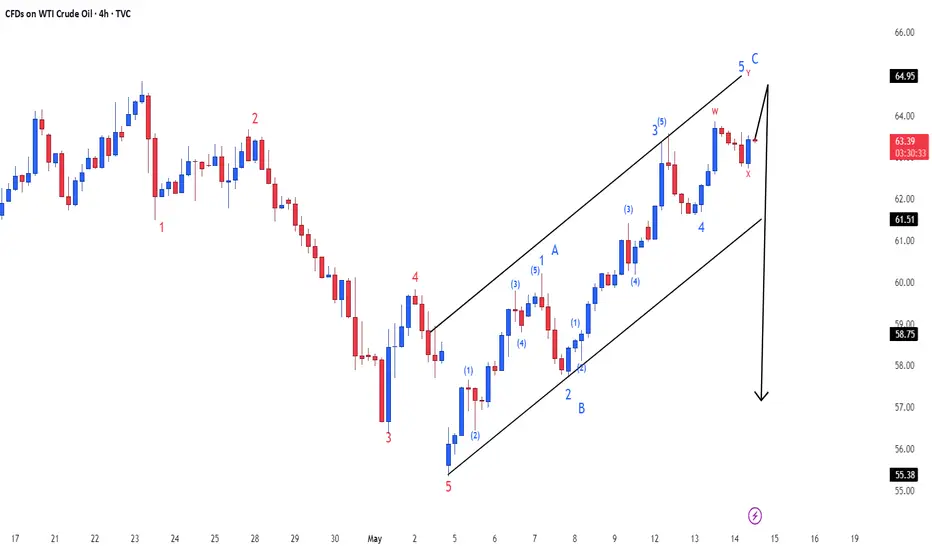
Oil could resume its uptrend.Oil could resume its uptrend. The wave 5 is ready to complete this up up jurney on oil. My tp is 65.

WTI Oil H4 | Falling toward an overlap supportWTI oil (USOIL) is falling towards an overlap support and could potentially bounce off this level to climb higher.
Buy entry is at 60.44 which is an overlap support that aligns with the 38.2% Fibonacci retracement.
Stop loss is at 57.60 which is a level that lies underneath a swing-low support and the 61.8% Fibonacci retracement.
Take profit is at 63.68 which is a multi-swing-high resistance.
High Risk Investment Warning
Trading Forex/CFDs on margin carries a high level of risk and may not be suitable for all investors. Leverage can work against you.
Stratos Markets Limited (tradu.com):
CFDs are complex instruments and come with a high risk of losing money rapidly due to leverage. 63% of retail investor accounts lose money when trading CFDs with this provider. You should consider whether you understand how CFDs work and whether you can afford to take the high risk of losing your money.
Stratos Europe Ltd (tradu.com):
CFDs are complex instruments and come with a high risk of losing money rapidly due to leverage. 63% of retail investor accounts lose money when trading CFDs with this provider. You should consider whether you understand how CFDs work and whether you can afford to take the high risk of losing your money.
Stratos Global LLC (tradu.com):
Losses can exceed deposits.
Please be advised that the information presented on TradingView is provided to Tradu (‘Company’, ‘we’) by a third-party provider (‘TFA Global Pte Ltd’). Please be reminded that you are solely responsible for the trading decisions on your account. There is a very high degree of risk involved in trading. Any information and/or content is intended entirely for research, educational and informational purposes only and does not constitute investment or consultation advice or investment strategy. The information is not tailored to the investment needs of any specific person and therefore does not involve a consideration of any of the investment objectives, financial situation or needs of any viewer that may receive it. Kindly also note that past performance is not a reliable indicator of future results. Actual results may differ materially from those anticipated in forward-looking or past performance statements. We assume no liability as to the accuracy or completeness of any of the information and/or content provided herein and the Company cannot be held responsible for any omission, mistake nor for any loss or damage including without limitation to any loss of profit which may arise from reliance on any information supplied by TFA Global Pte Ltd.
The speaker(s) is neither an employee, agent nor representative of Tradu and is therefore acting independently. The opinions given are their own, constitute general market commentary, and do not constitute the opinion or advice of Tradu or any form of personal or investment advice. Tradu neither endorses nor guarantees offerings of third-party speakers, nor is Tradu responsible for the content, veracity or opinions of third-party speakers, presenters or participants.

Bullish bounce off overlap support?WTI Oil (XTI/USD) is falling towards the pivot and could bounce to the 1st resistance, which is a pullback resistance.
Pivot: 59.97
1st Support: 57.60
1st Resistance: 63.27
Risk Warning:
Trading Forex and CFDs carries a high level of risk to your capital and you should only trade with money you can afford to lose. Trading Forex and CFDs may not be suitable for all investors, so please ensure that you fully understand the risks involved and seek independent advice if necessary.
Disclaimer:
The above opinions given constitute general market commentary, and do not constitute the opinion or advice of IC Markets or any form of personal or investment advice.
Any opinions, news, research, analyses, prices, other information, or links to third-party sites contained on this website are provided on an "as-is" basis, are intended only to be informative, is not an advice nor a recommendation, nor research, or a record of our trading prices, or an offer of, or solicitation for a transaction in any financial instrument and thus should not be treated as such. The information provided does not involve any specific investment objectives, financial situation and needs of any specific person who may receive it. Please be aware, that past performance is not a reliable indicator of future performance and/or results. Past Performance or Forward-looking scenarios based upon the reasonable beliefs of the third-party provider are not a guarantee of future performance. Actual results may differ materially from those anticipated in forward-looking or past performance statements. IC Markets makes no representation or warranty and assumes no liability as to the accuracy or completeness of the information provided, nor any loss arising from any investment based on a recommendation, forecast or any information supplied by any third-party.

WTI Crude Slips as Inventory Build Fuels Bearish MomentumWest Texas Intermediate (WTI) crude edged lower overnight, extending its recent pullback following the latest U.S. Energy Information Administration (EIA) weekly report for the week ending May 9. The data revealed an unexpected build of 3.45 million barrels in U.S. crude inventories, contrasting sharply with the prior week's 2.03 million-barrel draw and defying market expectations of a 1 million-barrel decline.
This surprise uptick in stockpiles signaled softening demand, compounding existing bearish sentiment and sparking a fresh wave of selling. WTI has since declined approximately 2% from the May 13 high of $63.68, suggesting growing downside pressure.
Technically, the price action appears poised to retest the key intermediate support at $60.00, a psychologically significant level. A decisive break below this area could expose the next major support at $55.12, a pivotal zone that aligns with the prevailing 7th March 2022 long-term downtrend. A breach of this support zone would likely confirm a broader bearish reversal, marking a critical milestone for oil markets.
On the contrary, oil prices may consolidate around the $60.00–$61.50 range before moving higher. If buying interest increases, prices could rise toward the key $63.71–$65.70 cluster zone. A decisive break above $66.00 could further interest near-term gains and short to medium term uptrend.
Traders will be closely watching upcoming macroeconomic indicators and geopolitical developments for further cues, with sentiment likely to remain fragile in the near term.

USOIL: Profit againThe shorting strategy of crude oil at $64-64.5 that I sent out has made a profit again. You can short again after the rise
Accurate signals are sent every day, all profitable and free. Account management services are also provided.
usoil sell@63.5-64
tp:62-61

WTIUSD Building a Base – Bullish Reversal Setup Above $58?# WTIUSD
**Instrument:** WTIUSD
**Current Price:** Around $60
**Bias:** Bullish (Reversal)
---
**Analysis:**
WTI is showing signs of a potential **trend reversal** after forming a solid base near the $53.8 level, marked as the **invalidation zone**. Price has reclaimed the $58.3 support level and appears to be preparing for a bullish continuation, especially if it forms a higher low near this level.
A sustained move above $58.3 followed by bullish structure could open the door toward **$70.0** and possibly even **$75.0** in the medium term.
---
**Key Levels:**
- **Support:** $58.292
- **Invalidation:** $53.828 (price closing below would negate the setup)
- **Bullish Targets:** $70.0 – $75.0
---
**Trade Idea (Not Financial Advice):**
Look for confirmation of support holding above $58.3 and potential bullish momentum for entries. Invalid if price breaks and closes below $53.8.
---
> **Disclaimer:**
> This analysis is for educational purposes only and should not be taken as financial advice. Trading commodities involves significant risk. Always do your own research and use proper risk management.

USOIL UPDATEweek hit its largest since the week of March 7, 2025. The EIA crude oil inventory for the week stood at 3.454 million barrels, contrasting with the expected -1.078 million barrels and the previous figure of -2.032 million barrels.
On Wednesday, crude oil exhibited a high-range oscillatory pattern: it stabilized and rebounded near $62.7, then pulled back after reaching $63.6, maintaining volatility within a narrow upper range. Influenced by the large bullish candlestick on the daily chart, oil prices still carry an upward probability.
Overall, crude oil remains in a bullish consolidation phase. For trading strategies, a "buy low, sell high" approach is recommended, with resistance levels to watch at $63.6–64.5 and support levels at $62.7–61.2.
you are currently struggling with losses, or are unsure which of the numerous trading strategies to follow, at this moment, you can choose to observe the operations within our channel.

US OILUS Oil Index
- Bullish Channel as an corrective pattern in Short Time Frame
- Break of Structure
- RSI - Divergence
- Completed " 12345 " Impulsive Waves
- Resistance Level
WTI Crude Oil INTRADAY corrective pullback supported at $62.00
WTI crude oil prices are slightly lower in early European trade, down about 1.00% on the day to around $63.00. This pullback ends a four-day winning streak that had pushed prices to over a two-week high.
The decline so far lacks strong bearish momentum, suggesting traders may be taking profits or pausing ahead of key data.
Relevance for Trading:
Price dip appears corrective, not a reversal — no strong selling pressure yet.
Market focus now shifts to upcoming weekly US inventory data, which could drive the next move.
A bullish inventory report could help WTI resume its uptrend; a bearish one may deepen the pullback.
Trading Bias:
Cautiously bullish while holding above $62. Support and inventory reaction will be key for near-term direction.
Key Support and Resistance Levels
Resistance Level 1: 6420
Resistance Level 2: 6560
Resistance Level 3: 6670
Support Level 1: 6170
Support Level 2: 6050
Support Level 3: 5950
This communication is for informational purposes only and should not be viewed as any form of recommendation as to a particular course of action or as investment advice. It is not intended as an offer or solicitation for the purchase or sale of any financial instrument or as an official confirmation of any transaction. Opinions, estimates and assumptions expressed herein are made as of the date of this communication and are subject to change without notice. This communication has been prepared based upon information, including market prices, data and other information, believed to be reliable; however, Trade Nation does not warrant its completeness or accuracy. All market prices and market data contained in or attached to this communication are indicative and subject to change without notice.

USOIL Long Term OutlookUntil a pattern is broken this is what is predicted.
2033 - retests pandemic lows
What could happen in 2033? :O
Not financial advice

USOIL UPDATEHello friends
Given the recent growth in oil prices, it is natural for the price to correct. Now we have obtained the most important price support areas for you and we have also specified the target. If you are willing to enter the transaction, be sure to observe capital management.
*Trade safely with us*

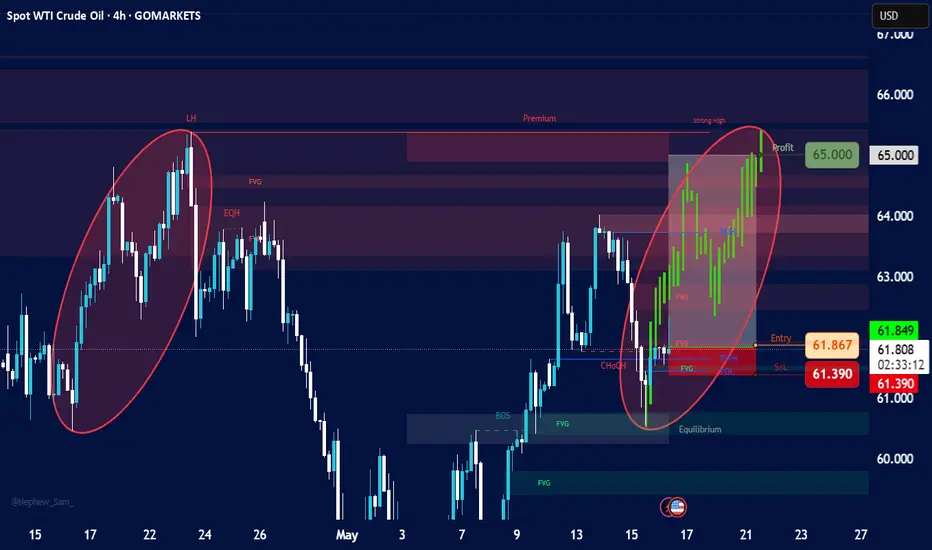
WTI Crude Oil (USOIL) Bullish Pullback Setup – Targeting $66.70 Entry Point: Around $62.30 - $62.26
Stop Loss: Set below the entry zone at $61.65, with a potential lower buffer at $60.90
Target Zone (EA TARGET POINT): Between $66.62 and $67.00
A projected gain of 4.22 points (~6.77%)
📈 Price Action & Indicators:
The price had a strong bullish run recently and is now consolidating or pulling back slightly.
The red and blue moving averages (likely short-term and medium-term MAs) show a bullish crossover and trend.
There's a potential bullish setup if the price pulls back to the entry zone and finds support.
The blue curved arrow indicates a projected bounce from the $62.30 support region back up toward the $66.70 target.
🛠️ Strategy Implied:
Wait for pullback to the entry zone (~$62.30).
Enter long at or around that level.
Set Stop Loss at $61.65 to limit downside risk.
Take Profit at $66.70 for a solid risk-reward ratio.
⚠️ Risks:
If support at $62.30 fails, price may head toward $61.65 or lower.
Market volatility (especially with crude oil) can invalidate setups quickly.
Economic events (e.g., U.S. inventory reports, OPEC news) can disrupt technical patterns.
