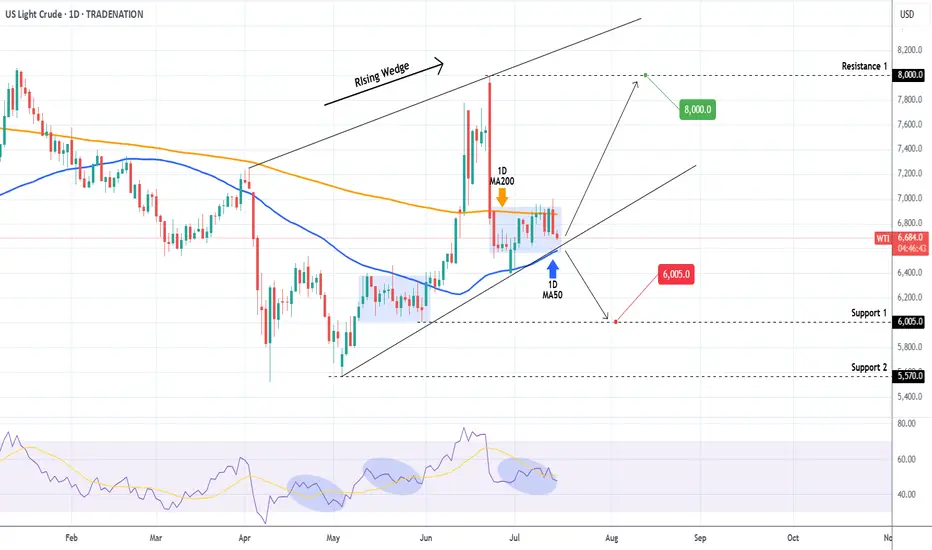
WTI OIL Is it forming a bottom?WTI Oil (USOIL) Has been trading within a Rising Wedge pattern and since June 02, it has turned its 1D MA50 as a Support. Technically the recent 2-week consolidation within the 1D MA50 (blue trend-line) and 1D MA200 (orange trend-line) is a bottom formation on the Higher Lows trend-line of the Rising Wedge.
As long as the 1D MA50 holds, we remain bullish, targeting $80.00 (Resistance 1). If the 1D MA50 breaks (closes a 1D candle below it), we will take the loss, and turn bearish instead, targeting $60.05 (Support 1).
-------------------------------------------------------------------------------
** Please LIKE 👍, FOLLOW ✅, SHARE 🙌 and COMMENT ✍ if you enjoy this idea! Also share your ideas and charts in the comments section below! This is best way to keep it relevant, support us, keep the content here free and allow the idea to reach as many people as possible. **
-------------------------------------------------------------------------------
Disclosure: I am part of Trade Nation's Influencer program and receive a monthly fee for using their TradingView charts in my analysis.
💸💸💸💸💸💸
👇 👇 👇 👇 👇 👇
USDWTI trade ideas
CRUDE OIL Bearish Flag Breakout! Sell!
Hello,Traders!
CRUDE OIL is trading in a local
Downtrend and formed a bearish
Flag pattern and now we are
Seeing a bearish breakout
So we are bearish biased
And we will be expecting
A further bearish move down
Sell!
Comment and subscribe to help us grow!
Check out other forecasts below too!
Disclosure: I am part of Trade Nation's Influencer program and receive a monthly fee for using their TradingView charts in my analysis.

Crude Oil Short Setup
Entry: 66.40
SL: 67.20
TP: 64.85
Risk to Reward: 1.93
Bias: Bearish
I expect mid-term downside pressure on crude oil prices, mainly due to the following reasons:
The U.S. is mitigating the impact of energy tariffs by increasing domestic supply.
Pressure on OPEC to boost production is rising.
Global demand growth remains uncertain.
These factors may keep energy prices capped in the medium term and support bearish scenarios.

WTI Crude Oil ShortWTI Crude Oil – Technical & Macro Outlook
🔻 1. Supply Zone Rejection Expected (66.50–68.00 Range)
Price is currently approaching a newly established supply zone between $66.50 and $68.00, which coincides with a prior consolidation area that preceded the recent sharp sell-off. This confluence enhances the zone’s relevance, especially given its position just below the 0.5 Fibonacci retracement level (~$69.47), derived from the swing high at $75.79 to the swing low.
📌 Outlook:
This region is expected to act as a high-probability rejection zone, likely attracting institutional sell-side interest. Price action within this zone should be monitored for signs of weakness or distribution.
📉 2. Downside Target: $61.50–$63.00 Demand Cluster
Should the supply zone hold, downside momentum could drive WTI toward the $61.50–$63.00 demand range. This area is technically significant, supported by the following factors:
Previous Change of Character (ChoCH) at $63.49, which marked the beginning of the recent bullish correction and represents a key structural pivot.
Presence of stacked demand zones below $64, increasing the likelihood of a meaningful reaction from buyers.
📌 Outlook:
This zone is expected to attract strong buying interest, making it a short-term profit-taking region for bears and a potential entry point for swing long setups, depending on confirmation.
🌍 Geopolitical Risk Landscape & Supply Dynamics
Recent geopolitical developments continue to influence crude oil pricing dynamics:
Middle East instability (e.g., Iraqi disruptions and ceasefire delays) has led to tightened supply conditions, pushing WTI above $67.
Persistent uncertainty stemming from Iranian nuclear negotiations, ongoing U.S.–China tariff risks, and regional tensions contributes to a sustained risk premium.
While OPEC+ is incrementally increasing production, this is offset by rising Saudi exports and weakening demand forecasts, which may result in inventory builds by late 2025.
Russia’s export resilience—bolstered by strategic redirection toward Asia—suggests that any anticipated supply contraction could be less severe than expected.
🛢 WTI at $62 – Technical and Macro Implications
A decline to $62 would place WTI at a major technical support level, closely watched by institutional participants. If tested, the market could react in the following ways:
Bargain hunting and value-based buying may emerge, especially if macroeconomic data aligns with a recovery narrative.
Heightened volatility is likely, driven by sensitivity to any shifts in global risk sentiment—particularly those tied to trade policy, OPEC+ production surprises, or further geopolitical escalations.
📌 Summary
Resistance: $66.50–$68.00 (pre-breakdown supply + 0.5 Fib)
Support / Target: $61.50–$63.00 (demand + structural ChoCH)
Bias: Short-term bearish toward demand, with high reactivity expected near $62
Risk Factors: Elevated geopolitical uncertainty and diverging supply dynamics across OPEC+, Russia, and the U.S.

CRUDE OIL BEARISH BREAKOUT|SHORT|
✅CRUDE OIL broke the rising
Support line which is now a resistance
And the price made a retest an a pullback
So we we are bearish biased and we
Will be expecting a further
Bearish move down
SHORT🔥
✅Like and subscribe to never miss a new idea!✅
Disclosure: I am part of Trade Nation's Influencer program and receive a monthly fee for using their TradingView charts in my analysis.

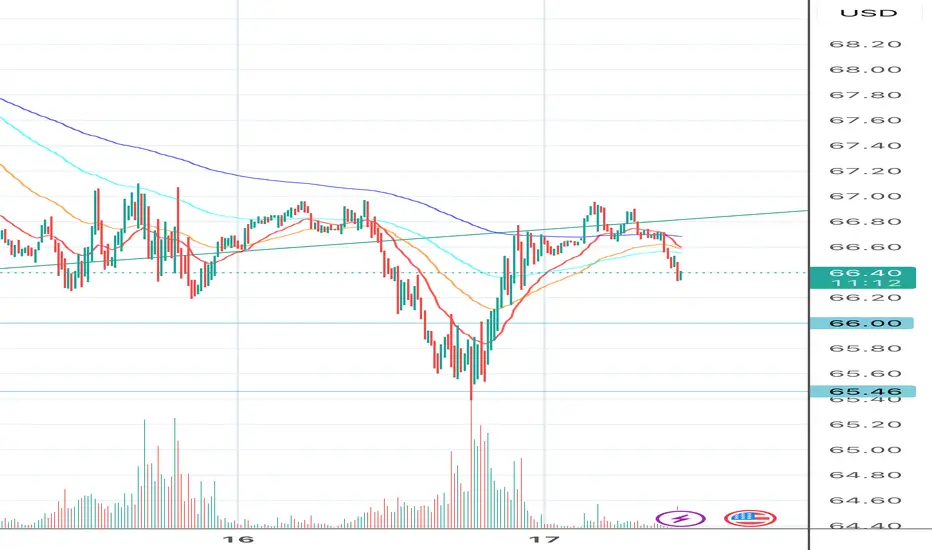
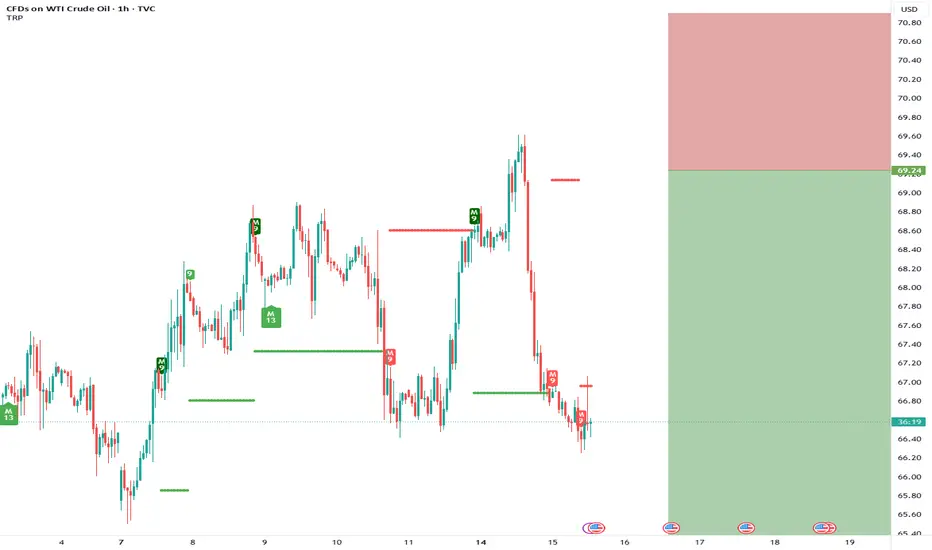
CRUDE OIL (WTI): Your Trading Plan Explained
Do not forget that today we expect Crude Oil Inventories data
release - it will be 10:30 am NY time.
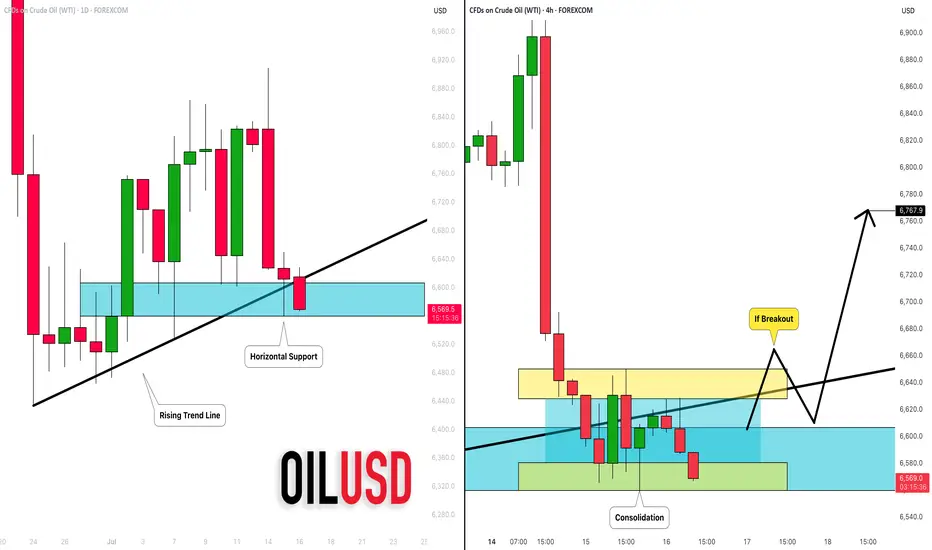
Ahead of this news, the market is testing a significant daily support cluster
that is based on a rising trend line and a horizontal structure.
You signal to buy will be a bullish breakout of a minor intraday
horizontal resistance on a 4H.
4H candle close above 66,5 will be your confirmation.
A bullish continuation will be expected to 67.6 then.
I suggest waiting for the news release first and then check how
the market prices in the news. If our technicals align with fundamentals,
it will provide an accurate setup.
Alternatively, a bearish violation of a blue support will push the prices lower.
❤️Please, support my work with like, thank you!❤️
USOIL Will Go Lower! Sell!
Take a look at our analysis for USOIL.
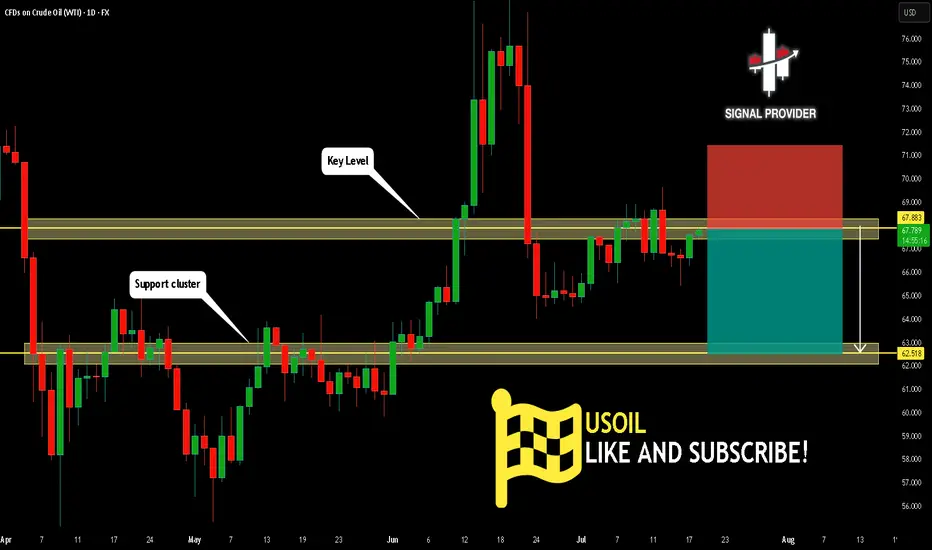
Time Frame: 1D
Current Trend: Bearish
Sentiment: Overbought (based on 7-period RSI)
Forecast: Bearish
The price is testing a key resistance 67.883.
The above-mentioned technicals clearly indicate the dominance of sellers on the market. I recommend shorting the instrument, aiming at 62.518 level.
P.S
Overbought describes a period of time where there has been a significant and consistent upward move in price over a period of time without much pullback.
Disclosure: I am part of Trade Nation's Influencer program and receive a monthly fee for using their TradingView charts in my analysis.
Like and subscribe and comment my ideas if you enjoy them!
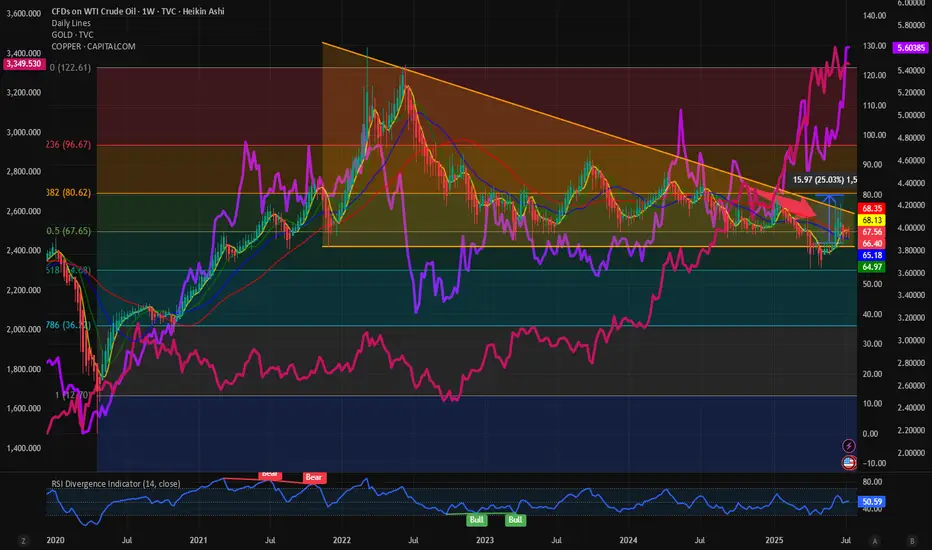
$USOIL: Will we see breakout or breakdown from this wedge? I have been watching the Commodity markets recently keenly to get direction or for market indications. AMEX:GLD , Copper and TVC:USOIL are the big 3 which determines the direction of commodity markets and hence the inflation. Inflation dictates direction of TVC:US10Y , TVC:DXY and hence the Equity markets. So, what are commodity markets telling us? With AMEX:GLD and OANDA:XCUUSD at ATH what does this mean for TVC:USOIL : TVC:USOIL Is in a bearish pattern and no sign of concrete bullish reversal on the commodity. Recently it has shown some signs of strength but still below its 0.5 Fib retracement level which is at 68 and we have time and again said that 0.318 Fib level at 80 $ might prove to be an upper resistance which will be difficult to breakout.
In the recent months whenever TVC:USOIL tries to break out of the 60 RSI sellers came back and pushed the prices down. Currently with RSI at 50 we might have some room for upside. Oil bulls can have a 20% upside in the RSI taking it to 60 which has historically proved to be a resistance. And a 20% upside in price is also possible with price hitting our 0.318 resistance level of 80%. Above that there is limited upside for $USOIL. The downward slopping wedge shown below indicates a breakout might be imminent which might take TVC:USOIL to 80 $ which is our highest target in this range bound market.
In contrast the bull run in other important commodities like AMEX:GLD and COPPER might have some legs as they are showing strength by breaking above the previous ATH. It is always a good idea to buy strength and ATH.
Verdict: TVC:USOIL remains range bound with 55 $ on lower bound and 80 on the upper bound. Commodity bulls can look at AMEX:GLD and OANDA:XCUUSD for better returns.
Retest fails on USOILOil dropped Wednesday on expectation of poor WTI stockpile data. Data confirmed bearish bias although retest of trend line proceeded. Retest has failed.
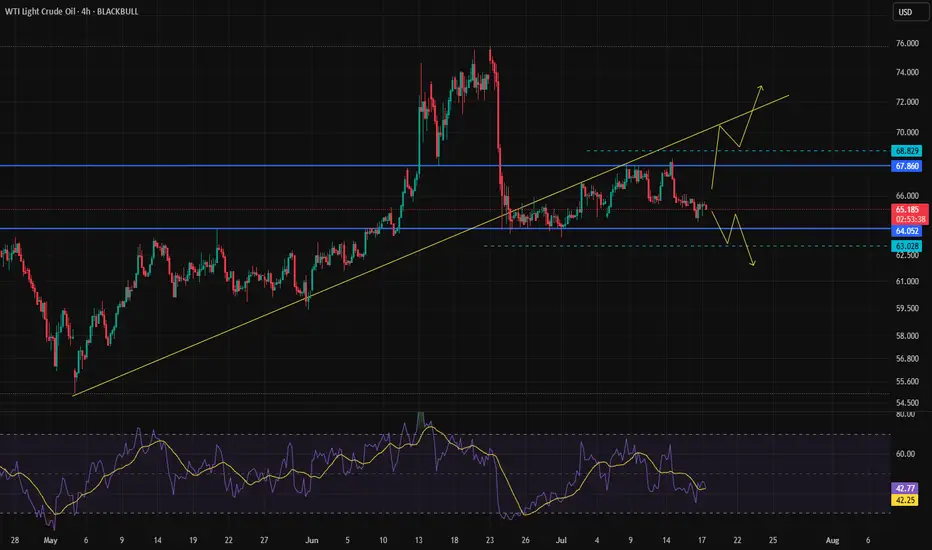
Crude Oil – Range Getting Too Long to Ignore
Oil has been stuck in a prolonged range, and a breakout in either direction is becoming increasingly likely.
The overall trend remains bullish, as there’s been no confirmed trend reversal yet.
📌 Key Scenarios:
A break to the upside would signal continuation of the bullish trend.
A break below the range could confirm a potential trend reversal.
📈📉 To avoid missing the next move, this setup can be traded with Buy Stop above the range and Sell Stop below it, allowing you to catch the momentum regardless of the direction.
⚠️ Wait for confirmation on higher timeframes if you prefer less risk
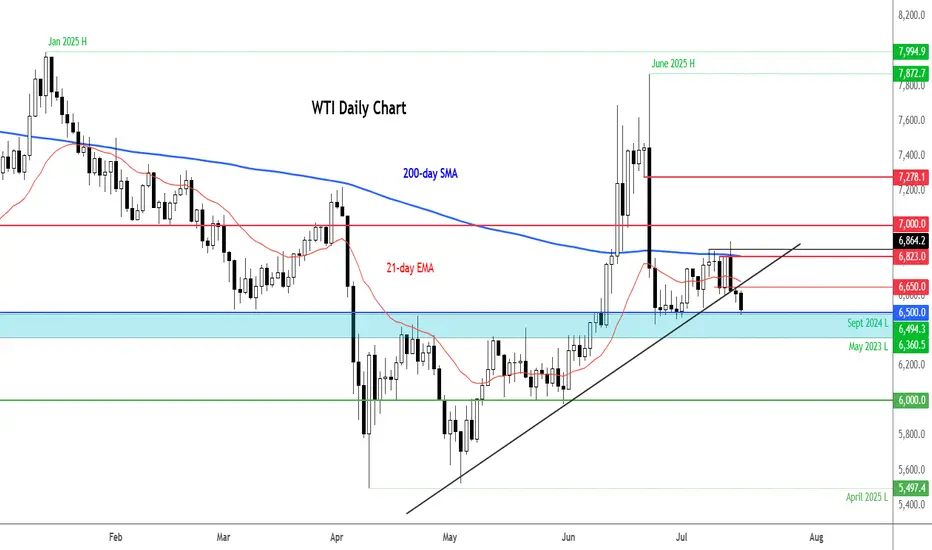
WTI Crude corrective pullback testing support at 6500Trade Tensions & Inflation Impact on WTI Crude
Tariff Announcement: The US has imposed reciprocal tariffs on 22 nations, including major trade partners such as the EU, Japan, Canada, Mexico, and South Korea, after a failed trade agreement during the 90-day negotiation window.
EU Response: The EU is preparing retaliatory tariffs unless a deal is reached before the August 1 deadline, raising the risk of a trade war escalation.
Trump's Warning: The US President has threatened additional tariffs if retaliatory measures are enacted, compounding uncertainty in global trade flows.
Inflation Spike: US June CPI rose to 2.7% YoY, in line with expectations. The increase was driven by higher prices of imported goods, as tariffs begin affecting consumer costs.
Fed Policy Impact: Rising inflation weakens the case for a Fed rate cut in September, dampening liquidity expectations and investor risk sentiment.
Conclusion for WTI Crude Trading
The combination of rising inflation, tariff-driven cost pressures, and a potential stall in Fed easing is bearish for WTI crude in the near term.
Additionally, intensifying trade tensions threaten global demand outlooks, which may further weigh on oil prices.
Traders should expect near-term downside pressure on WTI crude unless there is a clear de-escalation in trade rhetoric or a surprise dovish pivot from the Fed.
Bias: Cautiously Bearish on WTI Crude near term.
Key Support and Resistance Levels
Resistance Level 1: 6830
Resistance Level 2: 6940
Resistance Level 3: 7045
Support Level 1: 6500
Support Level 2: 6435
Support Level 3: 6370
This communication is for informational purposes only and should not be viewed as any form of recommendation as to a particular course of action or as investment advice. It is not intended as an offer or solicitation for the purchase or sale of any financial instrument or as an official confirmation of any transaction. Opinions, estimates and assumptions expressed herein are made as of the date of this communication and are subject to change without notice. This communication has been prepared based upon information, including market prices, data and other information, believed to be reliable; however, Trade Nation does not warrant its completeness or accuracy. All market prices and market data contained in or attached to this communication are indicative and subject to change without notice.


US oil for short Price is bearish on the monthly TF, price touched the trend line and formed bearish candlestick pattern on the weekly timeframe, price retested a resistance zone and broke the counter trend line.
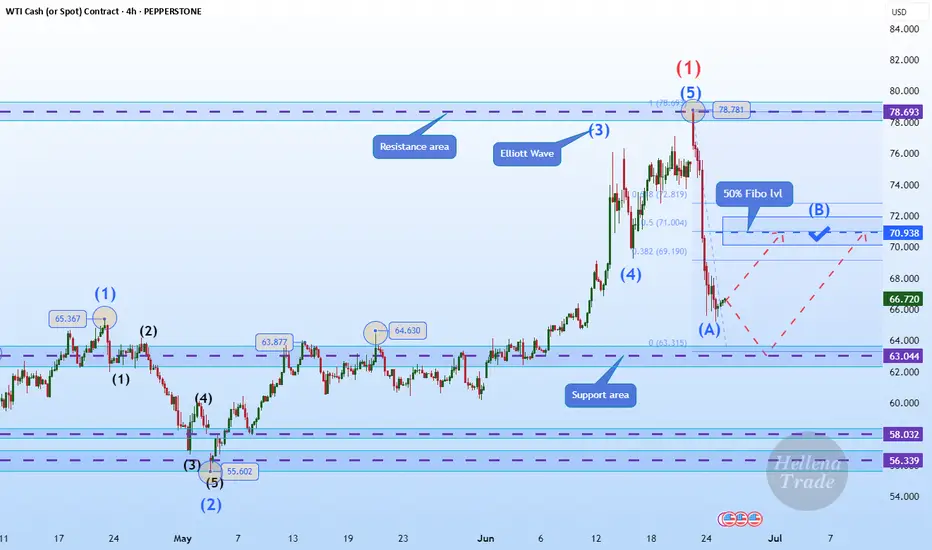
Hellena | Oil (4H): LONG to 50% lvl Fibo area of 70.00.Colleagues, after a long break, I think it is worth returning to oil forecasts. The situation is stabilizing a bit and now I think that the price is in a strong correction (ABC) at the moment I see wave “B”, which may reach the area of 50% Fibonacci 70 level.
It is possible that wave “A” will continue to develop towards the 62-63 area, but I still hope for an upward movement.
Manage your capital correctly and competently! Only enter trades based on reliable patterns!
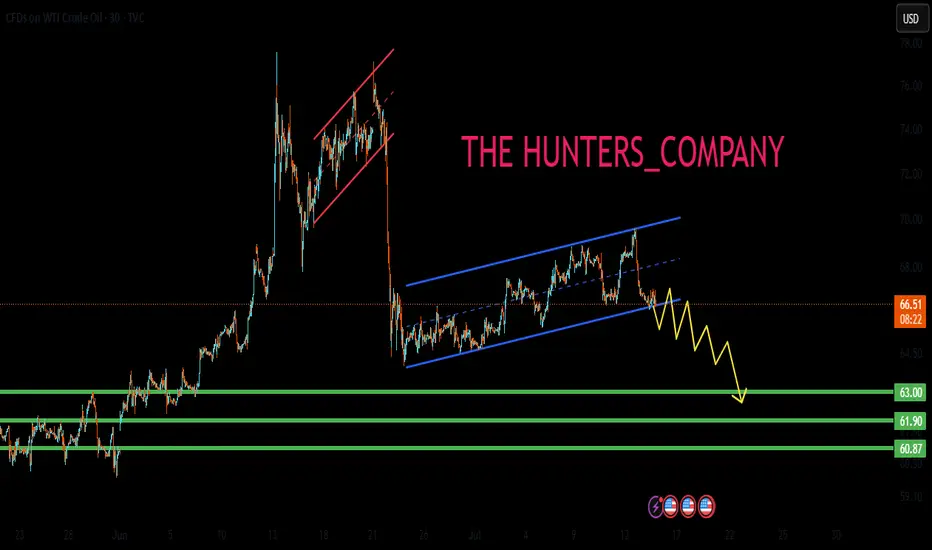
US OIL SELL...Hello friends🙌
🔊As you can see, this chart works well in forming a channel, and now that
we have witnessed a price drop, the price has reached the bottom of the channel, and given the previous heavy drop, the channel shows that the power is currently in the hands of sellers and it is likely that the specified targets will move.
🔥Follow us for more signals🔥
Trade safely with us
Crude oil extends fallsThe crude oil market has entered a fragile and uncertain phase, with prices retreating from recent highs. While WTI crude is still holding above the critical $65 mark on a closing basis, it was below this handle at the time of writing. So, the overall tone remains cautious, with a bearish tilt expected to persist in the near term.
Technical Outlook: WTI Breaks Key Support
The WTI crude chart shows a breakdown of a short-term bullish trend line, and lower lows. The price failed to reclaim the 200-day moving average and found strong resistance since. Currently, it is testing support around $65.00. A daily close below this level could trigger further bearish momentum, with the next support zones seen at $64, and then the next round handles below that. $60 per barrel could be reached if the macro backdrop doesn't improve.
Geopolitical Factors: Trump’s Tariff Threats Dismissed
Donald Trump’s threats of 100% tariffs on countries buying Russian oil sparked initial concern but were ultimately shrugged off by the market. Traders interpreted the 50-day delay in enforcement and Trump’s historical pattern of backing off such threats as signs that immediate supply disruptions were unlikely.
OPEC+ Strategy: Supply Returning to the Market
OPEC+ has announced a larger-than-expected production increase of 548,000 bpd for August, with another 550,000 bpd potentially coming in September. This roll-back of earlier voluntary cuts aims to recapture market share, especially as U.S. shale production slows. However, the added supply may cap price gains, particularly as demand is expected to ease after the peak U.S. driving season.
By Fawad Razaqzada, Market Analyst with FOREX.com
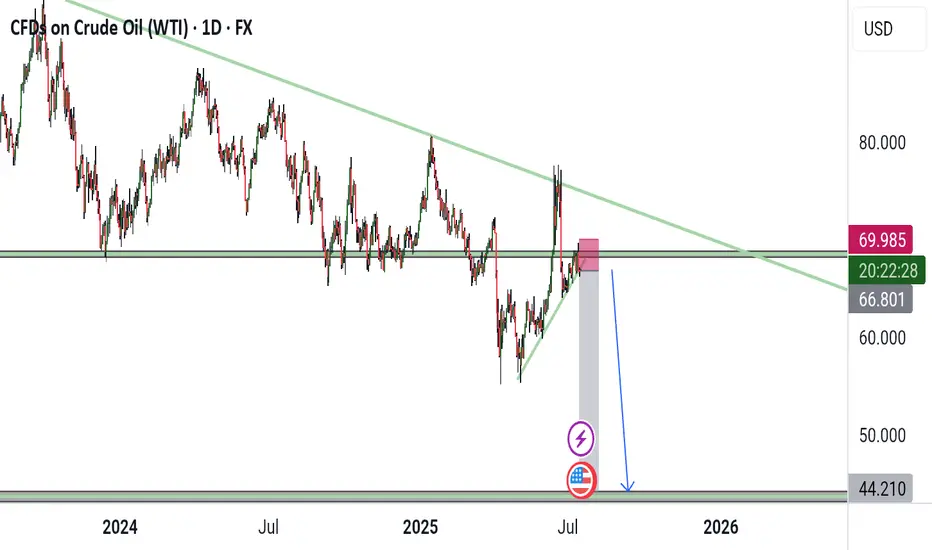
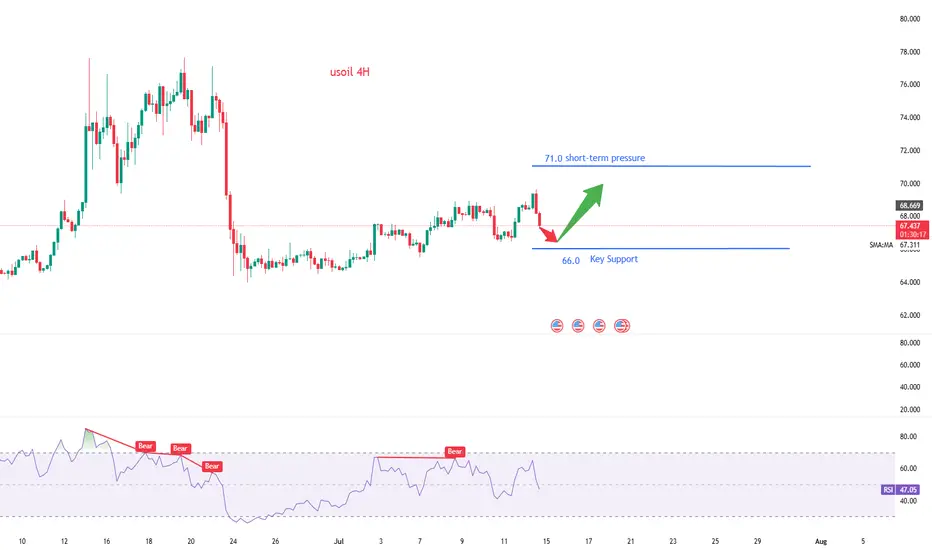
WTI Crude Oil Analysis – July 15, 2025Following recent Middle East tensions, WTI crude oil briefly surged to around $77.
However, the price quickly retraced back to its previous range and seems to have resumed its prior downward trajectory — characterized by a gradual bearish slope.
🔍 It’s important to remember that before the geopolitical events, analysts were eyeing the $52 level as a potential target.
Now, with liquidity being absorbed around the $70 area, that bearish scenario remains valid.
📉 Unless oil decisively breaks above key resistance levels, the outlook continues to favor a slow, downward trend.
I’m short USOIL🛢️ USOIL is WTI Crude Oil, the oil that powers our world.
I’m short USOIL 📉
Too much oil is flooding the market while demand slows down.
Would you take this trade? 🤔
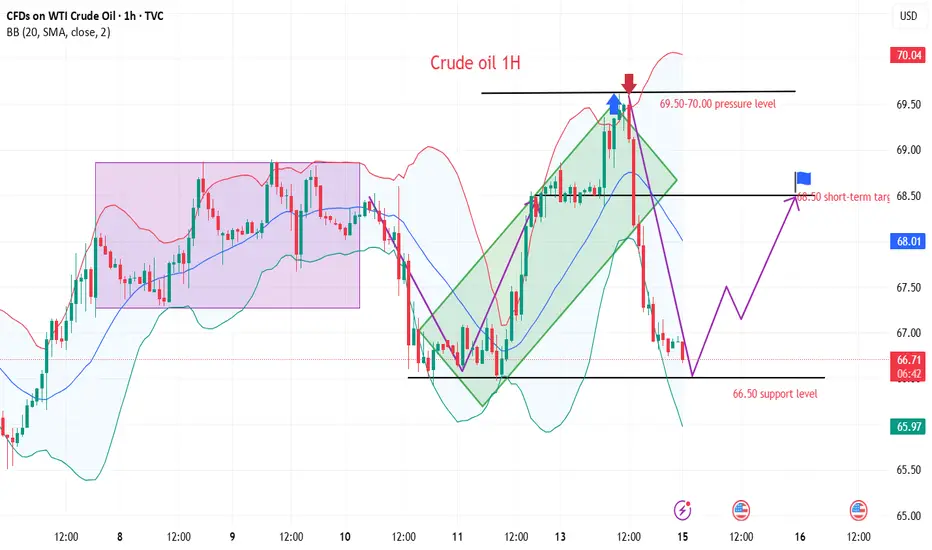
Crude oil rises slowly but falls quickly?
💡Message Strategy
International oil prices continued to climb on Monday, but the gains were limited. Brent crude futures rose 8 cents to $70.44 a barrel, continuing Friday's 2.51% rise. U.S. WTI crude rose 5 cents to $68.50, having surged 2.82% the previous trading day.
The main driving force behind this round of gains came from the market's expectation that the United States would further increase sanctions on Russia. U.S. President Trump said on Sunday that he would provide Ukraine with the Patriot air defense missile system and would make a "major statement" on the Russian issue on Monday.
The contradiction between supply and demand is also intensifying. According to market surveys, Brent crude oil rose by 3% last week and WTI rose by 2.2%. The International Energy Agency (IEA) pointed out that although the market supply and demand appear to be balanced on the surface, the actual global oil supply may be tighter than expected due to the summer refining peak and rising electricity demand.
📊Technical aspects
WTI crude oil continued its rebound from last week's low on the daily chart, and the current price is running at the downward support of $66.70, indicating that the short-term bullish power has increased. The MACD indicator shows a golden cross and initial volume, and the momentum column begins to turn positive, indicating that the price is expected to challenge the previous high area (69.50-70.20 US dollars).
The short-term (1H) trend of crude oil is highly repetitive, and the oil price is supported at the lower edge of the wide range and rises again. The short-term objective trend direction is upward within the range. The bullish momentum is sufficient.
💰Strategy Package
Long Position:65.50-66.50,SL:64.00,Target:69.00-70.00
Crude oil rebounds after a correction!International oil prices continued to climb on Monday, though the gains were limited. Brent crude futures rose 8 cents to $70.44 per barrel, extending Friday's 2.51% rally. U.S. WTI crude edged up 5 cents to $68.50 per barrel, after surging 2.82% in the previous trading session.
The primary driver behind the current upward move stems from market expectations of further escalation in U.S. sanctions against Russia. U.S. President Trump stated on Sunday that he would provide Ukraine with the "Patriot" air defense missile system and deliver a "major announcement" on Russia-related issues on Monday. "Trump is dissatisfied with the Russian President's failure to advance the peace process, a stance exacerbated by Russia's continued bombing of Ukrainian cities in recent days.
In the short term (1-hour timeframe), crude oil has shown high volatility, with prices finding support at the lower edge of the wide trading range and moving higher again. The objective short-term trend direction is upward within the range, with sufficient bullish momentum. However, given the high probability of recent erratic price swings, there is a greater likelihood that intraday crude oil prices will encounter resistance at the upper edge of the range and pull back.
you are currently struggling with losses,or are unsure which of the numerous trading strategies to follow,You have the option to join our VIP program. I will assist you and provide you with accurate trading signals, enabling you to navigate the financial markets with greater confidence and potentially achieve optimal trading results.
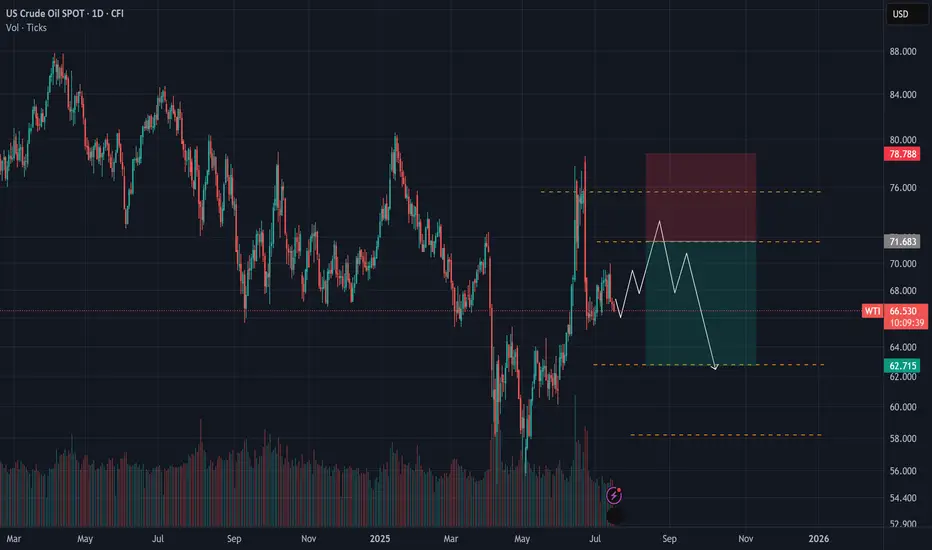
USOIL SELLERS WILL DOMINATE THE MARKET|SHORT
USOIL SIGNAL
Trade Direction: short
Entry Level: 69.08
Target Level: 62.06
Stop Loss: 73.74
RISK PROFILE
Risk level: medium
Suggested risk: 1%
Timeframe: 1D
Disclosure: I am part of Trade Nation's Influencer program and receive a monthly fee for using their TradingView charts in my analysis.
✅LIKE AND COMMENT MY IDEAS✅

WTI Oil – From Conflict to StrategyBack on April 24, I marked a short zone. On June 11, price broke above that level, giving a long opportunity — which I took.
Unfortunately, it coincided with the tragic military strike by Israel on Iran, pushing oil sharply higher. I’ve pinned that analysis.
Following the ceasefire, price dropped again — just a reminder that geopolitics can shake the charts.
As traders, we stay prepared to act, even while acknowledging the deep sadness of lives lost.
Now I wait for price to reach my marked level again. If I get a valid signal, I’ll short.
But if price breaks and holds above, I’ll buy the pullback — with no bias, just pure execution.
Risk-managed. Emotion-neutral. Opportunity-focused.
