Rand looks like is about to fallThe Rand has been range bound against the USD dollar Between
the R18 – R17.90 support zone and R19.30 – 19.60 resistance zone.
In the last couple weeks, the Rand printed two inverse hammer
candles.
Those inverse hammer candle to me signal that the Rand buying
that brought the price back to the R18-R17.90 support zone. Is
slowing down and losing some strength.
Couple with that a bullish divergence pattern. Signal to me that the
Rand is about to turn against the Dollar. Back to the R19.30
resistance
USDZAR trade ideas

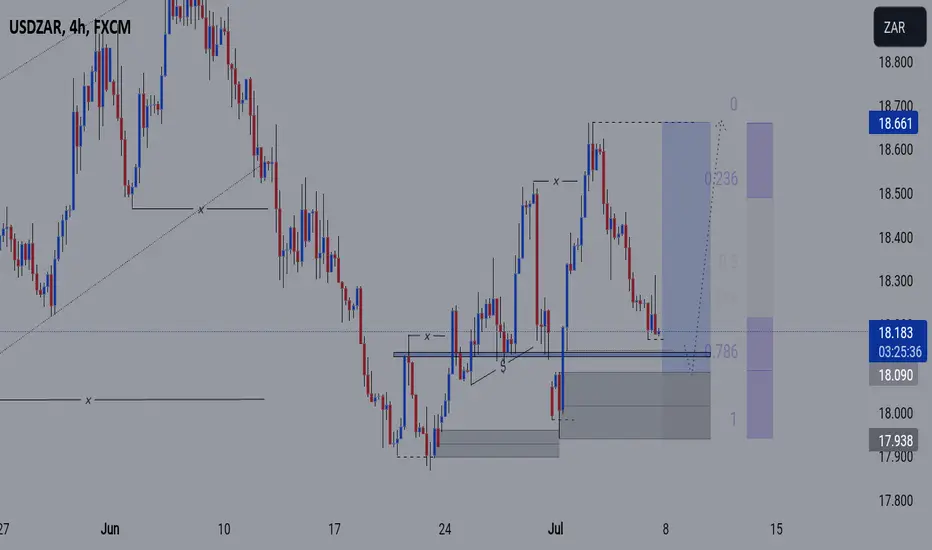
ZAR optimismThe rand is enjoying its post-election optimism and the broad-based decline in the dollar is adding strength to the currents. A break below the 18.12 support will confirm the move lower towards 17.86. The fact that the pair tested, but couldn’t hold, levels above the 61.8% Fibo at 18.56 and the 50-day MA at 18.38 is rand positive coupled with the fact that precious metal and copper prices are holding firm.
Locally, the markets have the latest SA mining and manufacturing results for the month of May to look forward to which are expected to come in strong off the back of another month free of loadshedding!

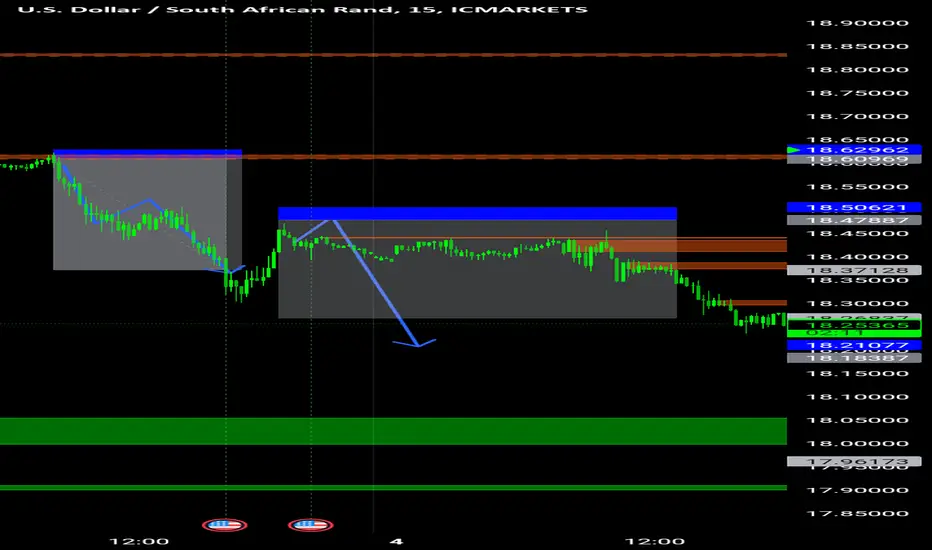
USD/ZAR LONG(BUY) TRADE IDEALooking to take potential Long positions seeing as the previously formed H1 Supply zone has been retested which also confluences with the inner M45 & M30 Supply zone which further confirms the strong Bullish momentum still at bay.

USDZAR Continuations ShortLooing for a pullback into key supply zone to short lower. Inflation data may come in flat or higher and cause a pullback into key level. HTF structure shows successful distribution of price.

USDZAR-BUY strategy 4-hourly chartThe previous update worked well, but not reaching the expected objective. Now we have stilol some pressure, since we have not been able to establish above 18.2350. The stochastic is low but still negative.
Strategy BUY @ 18.0650 - 18.0850 and place SL below 17.9750 and take profit @ 18.2350.

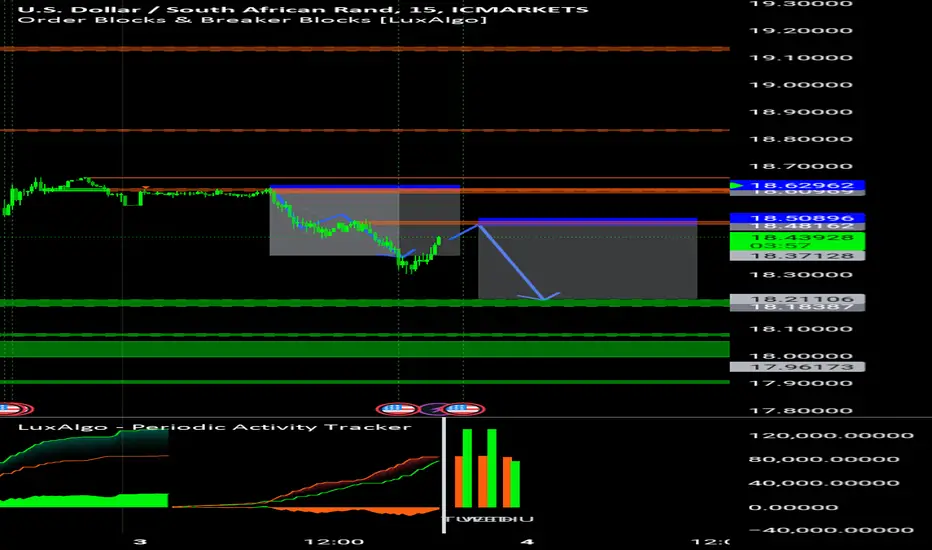
Usdzar Possible Long position entryAbove is 4hr BULLISH ORDER FLOW. Key factors:
1. 4hr fair value gap present
2. 4hr Demand zone (Liquidity sweep✓)
3. Price made new high (Strong low✓)
4. Inducement zone (Clearly visible on 1hr)
Note: Price is only bullish on 4hr timeframe. Daily and weekly are both bearish and price is searching for a premium price level to sell. Please comment your view on this one. 🌟📈
USD/ZAR HIT THE TARGET PRICE TOOThis was week was a success although we took one loss but it's fine because we hit four targets successful week it was
USD/ZAR HIT THE TARGET PRICE TOOThis was week was a success although we took one loss but it's fine because we hit four targets successful week it was

USDZAR Bullish IdeaUSDZAR is looking bullish and it just tapped the fib level 61.8 and it has a bullish divergence

USDZAR-BUY strategy 4-hourlyThe pair still had more downward pressure due to GOLD holding up and moving higher. Of course, it makes it difficult to catch the movements at times, but as long we keep tight SL we should be fine.
Strategy BUY @ 18.2000-18.2350 and place SL near 18.1750 and take profit @ 18.4150. Please note that the daily chart has downside potential overall.

Bullish bounce?USD/ZAR is falling towards the pivot and could bounce to the 1st resistance.
Pivot: 18.1317
1st Support: 17.9290
1st Resistance: 18.4709
Risk Warning:
Trading Forex and CFDs carries a high level of risk to your capital and you should only trade with money you can afford to lose. Trading Forex and CFDs may not be suitable for all investors, so please ensure that you fully understand the risks involved and seek independent advice if necessary.
Disclaimer:
The above opinions given constitute general market commentary, and do not constitute the opinion or advice of IC Markets or any form of personal or investment advice.
Any opinions, news, research, analyses, prices, other information, or links to third-party sites contained on this website are provided on an "as-is" basis, are intended only to be informative, is not an advice nor a recommendation, nor research, or a record of our trading prices, or an offer of, or solicitation for a transaction in any financial instrument and thus should not be treated as such. The information provided does not involve any specific investment objectives, financial situation and needs of any specific person who may receive it. Please be aware, that past performance is not a reliable indicator of future performance and/or results. Past Performance or Forward-looking scenarios based upon the reasonable beliefs of the third-party provider are not a guarantee of future performance. Actual results may differ materially from those anticipated in forward-looking or past performance statements. IC Markets makes no representation or warranty and assumes no liability as to the accuracy or completeness of the information provided, nor any loss arising from any investment based on a recommendation, forecast or any information supplied by any third-party.

USDZAR Long Side Entry PlansUSDZAR has fallen significantly in trend, especially after FED comments yesterday feeding into USD Weakness.
Price arrives at key long zones, with more risk averse areas available below. LZ2 preferred as lower inherent risk.
Entry size will depend on Sentiment at this time.

USDZAR-BUY strategy 4-hourlyThe pair has moved lower as expected, and now settling in 18.40s area. GOLD seems over done, and likely will move south again, hence our pair may have room upwards again short-term.
Strategy BUY 18.3500-18.4000 and place SL below 18.2750 and take profit @ 18.6150 for now.

USD/ZAR BEARISH PULLBACK?Services PMI shows that the economy is weak so a pullback it is necessary we are still bearish on USD/ZAR
Long USDZAR (short-term)The recent political events have proven to bring back some confidence in SA. However, it needs to coincide with the financial data. Look to add another position if it goes to the R17.50 level.

USDZAR There are chances according to my view that this pair will continue to rise upside. for that case might have a chance to buy the pullback if we retrace to 0.50 - 0.618 fib lavels, if however the break below the zone. then might look for option 2 zone.


USD/ZAR BEARISH TODAY?This is a market looks like it's going to be buried today to retrace yesterday bullish rally

Usd/Zar Sell IdeaUsd/Zar is in a confirmed down trend on the day chart.
Usd/Zar is making lower highs and lower lows on the day chart.
The trend is down and we are looking to sell usd/zar for a new swing low.
This sell could take many days to play out.
So your selling in a downtrend here.
Please use risk management with this trade.

USDZAR-SELL strategy 3-hourly chartThe market still feels the uncertainty, and that makes it a difficult task to get the direction right. Wwe have had SL executed, but overall, we still should see lower levels. There is no confirmation as yet that we see lower, but the run up from the 17.90s low, shouyld still need some corrective action. The stochastic is high, and turning. so we try again.
Strategy SELL @ 18.5850-18.6350 and place SL above 18.7350 for now and profit let's say @ 18.4350.

USDZAR Year Ahead 2024Here we are looking at the Pivot Point and the price is trading right at this important level. There are up coming elections in South Africa later this year and this will have a major impact on the value of this currency pair.
Do your year ahead analysis to get an idea of possible turning points. We make use of a weekly timeframe to analyze the year ahead, breaking 2024 up in to 4 quarters. From here we move down to lower timeframe for microscopic analysis and trade entries on lower timeframe. Higher timeframe trendline, speedlines, Fibonacci or Pivot Points remain longer in play. To learn more get our website link on our main profile.

USDZAR-SELL strategy 4-hourly chartIts good to be neutral sometimes, especially lot's of uncertainties due to the cabinet formations. The market trades erratic, and it does not have a clear view on where to go.
For now, we see we have move sharply upwards, and feel this may be running out of steam again. the mid-point is somewhere 18.1300-18.1500 I think.
Strategy SELL @ 18.3500-18.4150 and place SL tight above 18.5150 and profit order let's say near 18.1950.

Heading into overlap resistance, could it reverse from here?USD/ZAR is rising towards the pivot which acts as an overlap resistance and could potentially reverse to the 1st support.
Pivot: 18.4787
1st Support: 18.1270
1st Resistance: 18.6895
Risk Warning:
Trading Forex and CFDs carries a high level of risk to your capital and you should only trade with money you can afford to lose. Trading Forex and CFDs may not be suitable for all investors, so please ensure that you fully understand the risks involved and seek independent advice if necessary.
Disclaimer:
The above opinions given constitute general market commentary, and do not constitute the opinion or advice of IC Markets or any form of personal or investment advice.
Any opinions, news, research, analyses, prices, other information, or links to third-party sites contained on this website are provided on an "as-is" basis, are intended only to be informative, is not an advice nor a recommendation, nor research, or a record of our trading prices, or an offer of, or solicitation for a transaction in any financial instrument and thus should not be treated as such. The information provided does not involve any specific investment objectives, financial situation and needs of any specific person who may receive it. Please be aware, that past performance is not a reliable indicator of future performance and/or results. Past Performance or Forward-looking scenarios based upon the reasonable beliefs of the third-party provider are not a guarantee of future performance. Actual results may differ materially from those anticipated in forward-looking or past performance statements. IC Markets makes no representation or warranty and assumes no liability as to the accuracy or completeness of the information provided, nor any loss arising from any investment based on a recommendation, forecast or any information supplied by any third-party.
