USDZAR BUY ( SA GOV UNITY EFFECT )Stability vs. Uncertainty: A unity government formed by multiple parties may initially be perceived positively by investors if it is seen as a move towards political stability and consensus-building. This could lead to increased confidence in the country's economic prospects, potentially supporting the currency.
Policy Clarity: A coalition government might face challenges in implementing policies due to divergent interests among the participating parties. However, if the coalition can provide clarity on economic policies and reforms, it could bolster investor confidence and have a positive impact on the currency.
USDZAR trade ideas

When in doubt zoom outThe volatility of the rand is forcing us to “when in doubt zoom out.” Last week the rand managed to pull the pair to a low of 18.47 but the blue support range held its ground. The two critical rates to watch now is the 200-day MA support at 18.78 and the 61.8% Fibo resistance rate of 18.87. A break above 18.87 will allow the pair to test levels above the blue downward trend line and move into the red resistance range between 19.16 and 19.28. A break below 18.78 will however allow the rand to re-test the support range around the 18.50 mark. The rand is currently at the whims of global investor sentiment around SA’s new government of national unity but as the dust settles SA will be able to attract investors back into the SA bond market which is rand positive. The recent performance of the SA economy and the cooling of global commodity prices are however rand negative. Range bound movement between 19.00 and 18.70 can be expected as the pair looks likely to fall into a corrective pattern. A break below 18.50 will however invalidate the expected 5-wave impulse in the chart.

USDZAR-BUY strategy 4-hourly chartI have under estimated the move down to be much further, but it does not change my overall strategic view of the pair. the stochastic remains low, and we have executed our SL in the 18.4350 area, and now we aim to buy lower down again. We will see recovery for the coming sessions is my personal view. the daily chart worked well, but got out to early.
Strategy BUY @ 18.3650-18.4000 and place SL below 18.2950 for now and profit order @ 18.5850.

USDZAR-BUY strategy 4-hourly chartTe daily chart did well, and profit taken. The 4-hourly suggestion went beyond the 18.6150 and we have broken below GANN levels as well. Under normal circumstances, I would suggest selling now, but since stochastic LOW and also being below regression channel, a pullback usually takes place. GOLD seems to recover higher is my view, but since the pair already declined, we may see recovery first before down.
Strategy BUY @ 18.5350-18.5650 and place SL below 18.4350 and take profit @ 18.8150 for now.

USDZAR So far so good…
USDZAR moving in the right direction.
So far we deep in the right place.
Now we just have to be patient.
Usually I will take 70% of profits off the table and leave 30% to role over into my take profit zones.

USDZAR-BUY strategy 4-hourly chartOf course, each time frame has its own analysis, and farther away objectives. the daily chart is SELL strategy, but the 4-hourly has BUY potential.
Strategy BUY @ 18.7150-18.7500 for a profit objective to 18.9150 again. SL below 18.6150 for now.

USDZAR 10/06/2024Weekly:
-Sellside liquidity taken.
-OB.
-FVG is acting as support.
Daily:
-Bullish M pattern.
4H:
-Bullish M pattern.
-Inverse H&S pattern.
-IC.

USDZAR-SELL strategy Daily ChartThe pair has reached close enough the 2-hourly chart objective, and after reaching 18.9200 area, we move lower sharply to low 18.70s. This price action is likely the forming of a larger move lower. The stochastic is near negative, and GANN-wise, we have potential to reach 18.60s in the week to come or sooner, is my personal opinion.
Strategy SELL 18.7800-18.8300 and place SL above 18.9650 and take profit @ 18.6250.

USDZAR Short positions triggered My short position has been triggered.
Firstly my confluence is a lower high on the 4H timeframe.
Price failed to created a new high.
Secondly price action has broken my box zone.
Which indicates we are receiving a strong push to the downside because of the bears.
Thirdly we have seen a break of the major bullish trend.
Let’s see how this plays out…

USDZAR-BUY strategy 2-Hourly chartLooking at the short-term time frames, it appears we may see a move back to test 18.9500-19.0000 again. Stochastic is positive, and GOLD lower, therefore a higher probability for moving back up again.
Strategy BUY @ 18.8000-18.8350 and place SL below 18.6850 and take profit @ 18.9475.

USDZAR rise to 2020 highThe rand has lost ground to the dollar, rising above moving averages. Weaker US data and lower inflation affect the situation. Both South African and US GDP missed estimates. The 19.35 marker is resistance, while the 200 SMA and swing low of 18.044 are support levels.

USDZAR-SELL strategy 4-hourly chartIt feels more confirmed for a down move from here. We attempted higher, and also the increase of precious metal prices, should support this view for the coming sessions.
Strategy SELL @ 18.9150-18.9850 and SL around 19.0750. Profit order @ 18.6350 for now.
unclearsince SA doesn't have a goverment the investors are panicing therefore the zar will lose some weight. let's continue to monitor it for the next 10days

USDZAR long/buyHello
Focus of the day is the USDZAR pair. I am looking for a buy in this pair
* Ending diagonal (structure)
* Expanding flat formed
* Liquidity ( equal lows and some gaps taken)
* MACD DIVERGENCE
* Impulsive move expected
Entry :18.00 (ORDER BLOCK ZONE)
Stop Loss: 17.42
TP1 : 19.00 (GAP)
TP2 : 19.69 (GAP + BREAK OF TOP TO COMPLETE STRUCTURE)

Buy USDZAR @18.70HH and HLforming for a Buy setup. It has formed an Elliot wave setup which can also be looked at as a Higher High and Higher Low

USDZAR-SELL strategy 4-hourly chartThe pair starts showing a possible decline again, supported by other indicators suggesting move south again.
Strategy SELL @ 18.8875-18.9500 and place SL above 19.0750 for now. Profit order suggested above 18.6575.

USDZAR Approaching Key Demand Zone: Election Insights and MarketAs the South African elections draw near, there's heightened anticipation about potential political shifts. However, substantial changes are necessary for the current government to be unseated. In this context, the USDZAR is approaching a critical demand area between 17.42-17.88, where buyers previously stepped in. This zone could be a pivotal point for bullish reversals, aiming for the equal highs at 19.40. 📈💬
Key Demand Area and Potential Bullish Reversals
The demand zone around 17.42-17.88 is significant because it represents a region where buying pressure has previously outstripped selling pressure, leading to a price increase. When price approaches this zone again, it often acts as a support, attracting buyers and potentially sparking a bullish reversal. 🔄💵
Targeting Equal Highs at 19.40
Equal highs at 19.40 serve as an important target for several reasons:
Liquidity: Equal highs often attract liquidity as stop orders tend to accumulate above these levels. Market makers and large traders might push the price towards these highs to capture this liquidity.
Psychological Resistance: These levels are psychologically significant for traders, often acting as a magnet for price.
Previous Rejection: This area has historically seen price rejection, making it a critical level to watch for potential reversals or breakouts.
Post-Election Outlook and Eskom Challenges
It's expected that load shedding will resume post-elections, with Eskom working tirelessly to manage the energy crisis. This return to reality could weigh heavily on the South African economy and, by extension, the ZAR. Thus, a bullish USDZAR scenario remains plausible as these fundamental issues resurface. ⚡🏢
🔍 Disclaimer: This post reflects my personal views and analysis. Trading involves risk, and it's crucial to conduct your own research before making any trading decisions.
Happy Trading! 🚀📉📈

USD/ZAR movement June 2024Resistance levels continue to rise as support is shown at 18.20s around mid may and now we have bounced off 18.48. I believe we are being forced up before ultimately going back down to low 18.00s as per my previous post on May 30.

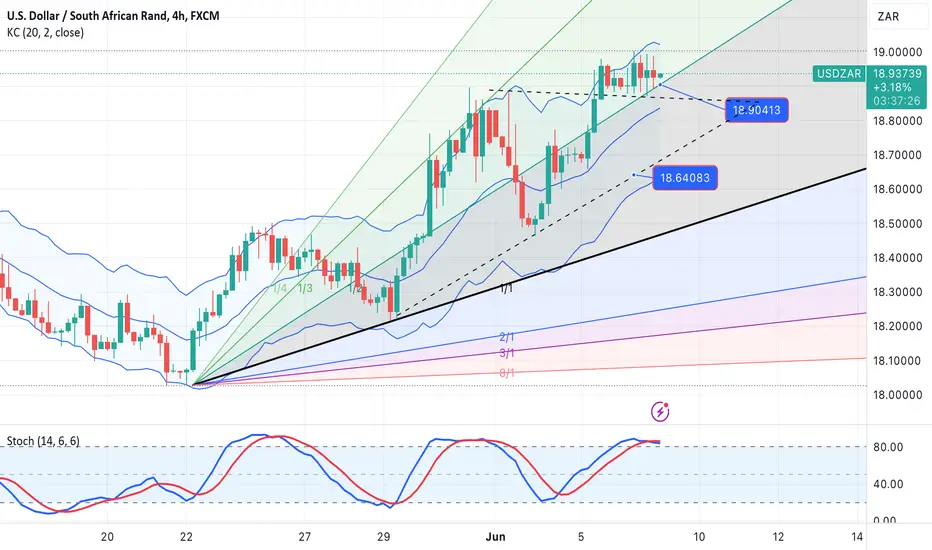
USDZAR-NEUTRAL BUY strategy 4-hourly chartThe pair may attempt higher levels before SELL strategy is suggested. I feel we have positive movement for coming sessions, even though it feels neutral range. It depends to risk appetite, and personally would remain neutral, but with BUYING bias.
Strategy BUY @ 18.6075 - 18.6350 and place SL below 18.5350 and take profit @ 18.8875.

consolidationnow that elections are over, zar remains undecisive. we will monitor it and hope it favours a certain coalition goverment

USDZAR-BUY strategy 4-hourly chartWe have reached our objective lower, and we have respected the GANN support currently near 18.4500, and move higher from there. It feels we range trade for some sessions, before we ultimately move back lower.
Strategy BUY @ 18.4750-18.5200 and place SL below 18.4150 and take profit near 18.7150.

USDZAR Morning Setup USDZAR Setup we are expecting price to bounce back from our POI because it's been respecting it

USDZAR-SELL strategy (cautious) 4-hourlyThe pair is election results driven and also awaiting developments to coalition etc. However, the run up was strong, and the GANN resistances are also playing part and including stochastic, for movement back towards 18.5000 area again.
Strategy SELL @ 18.7500-18.8000 area and place SL @ 18.8850 for now. Profit order @ 18.5150.
