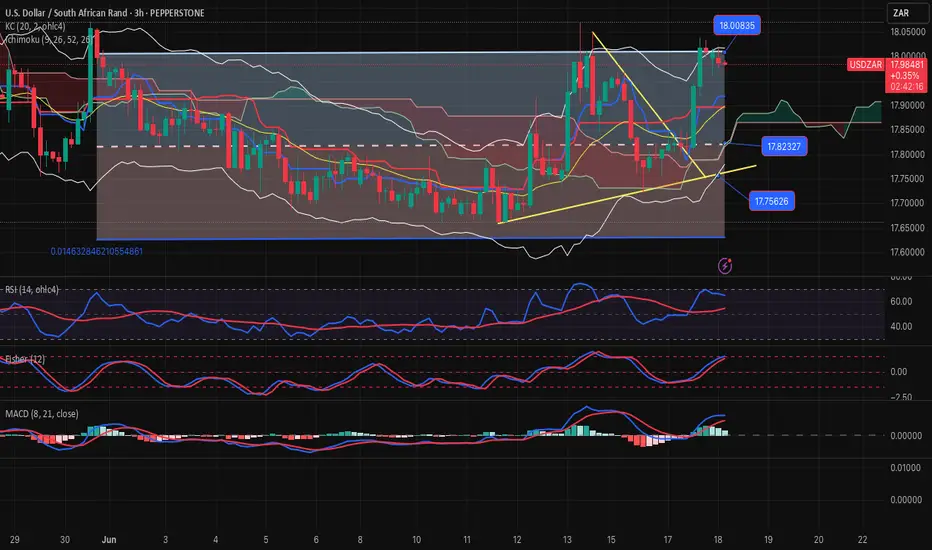
USDZAR-BY strategy 3 hourly chrt GANNW are observing a breakaway gap (possibility), and this means we will move higher over time, which is in line with 3D chart posted some days back. The market is uncertain, and any escelation or threath, should keep USD firm, and the chart merely reflect this situation. Crypto has come under pressure, meaning asset are shifting.
Strategy BUY @ 18.0150-18.0300 (or slightly higher) and take profit near 18.2450 for now.
USDZAR trade ideas

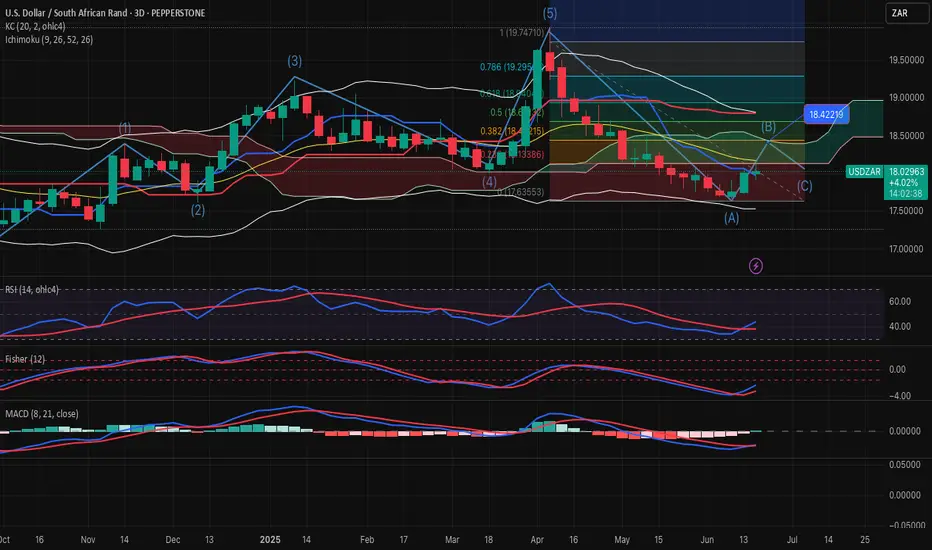
USDZAR-BUY strategy 3D chart The pair is still on the BY side, even though short-term charts may suggest slightly lower. The issue is, that any involvement by US may cause a spike of US dollar, and technically the pair has a chance to correct to 18.4200 FIB before we see recovery. So be careful, and perhaps the BUY side may help in this case, and I feel it starts looking this way as I had written some week back on the same chart settings.
Strategy BUY @ 17.9650-18.0150 and take profit near 18.3750 for now.

USDZAR-SELL strategy 3 hourly chart Reg. ChannelThe pair reached first near 18.1350 and thereafter corrected to 17.9200 area. This was a minor correction, and now we are still slightly positive, and we may see back 18.1300-18.500 before a move lower again. One should consider, when US involves themselves, the USD will initially strengthen, but in the sessio0ns to come we should observe weakness
Strategy SELL @ 18.1150-18.1650 and take profit near 17.9250 for now.

USDZAR Bull ideaWe have a dollar that is potentially looking to have a long term bull run and USDZAR is an exotic pair that is part on the immerging markets and it can sometimes lead the move before the Major pairs.

USDZAR-SELL strategy 3 hourly Reg. ChannelThe pair spiked and the "cautious" SELL idea did not pan out as we never had the break of 17.7500 support area. Right now, we are at the top of the channel, and even though it may spike above it, gravitational forces may likely drag it down again, as we are slightly overbought as well and a return towards 17.80s is possible. The USDX moved higher as well, but similarly it is slightly overdone.
Strategy SELL @ 17.9650-18.0500 and take profit near 17.7800-18.8050 area.
Medium-term still am seeing higher (see my 3D chart few days ago).
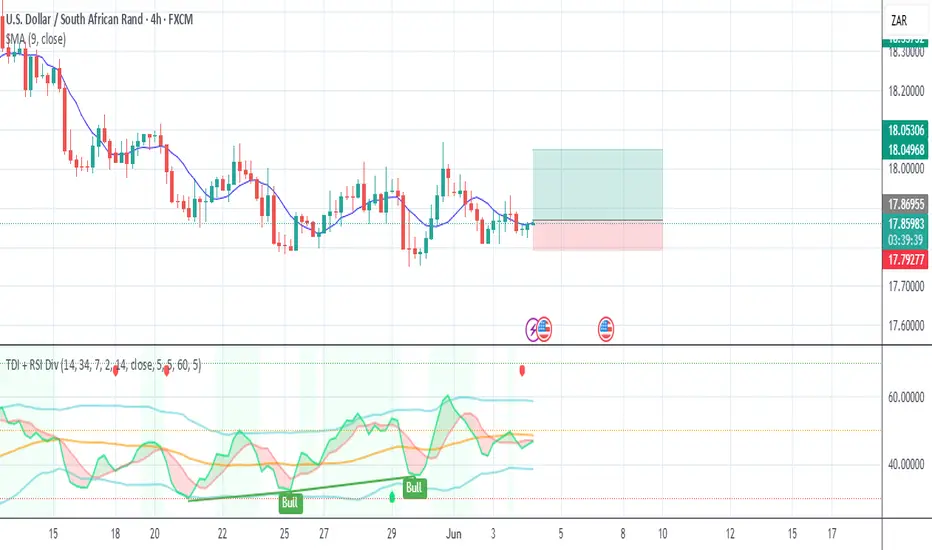
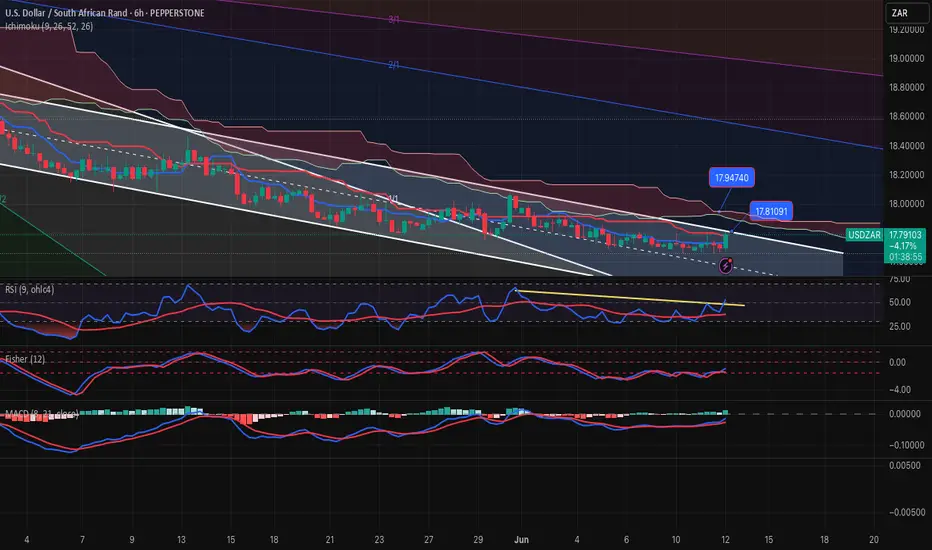
USDZARLooking for buying opportunities for the USDZAR herewith the breakout on the resistance being confirmed by the RSI Divergence as well as the trendline breakout entry approach, entry to buy on breakout retesting. Looks simple but tricky.

USDZAR-CAUTIOUS SELL strategy 6 hourly chart GANNthe pair is drifting lower in silent mode :) it feels we may have an attempt to break 17.7500 area and if successful on close, the possible should-head-shoulder top may be something to think about. Medium term i see still see higher, however, short-term we are not out of the woods as yet, and the USDX is under pressure as well, so like we will embark lower.
Strategy SELL @ 17.8150-17.8500 and take profit near 17.5750 for now.


USDZARi THINK now USDZAR touch in ob or fvg and going up because in daily price its break maret structur and 4h its break marekt structur and moment its tu the buy in he zone and riskreward it 1:4.8 and i think its end of the daily bearish and now bullish and thankyou

USDZAR-SELL strategy 3 Hourly chart Reg.ChannelThe pair has first moved higher due to the fundamental pressures, but seems to trade side ways to lower. Indicators tend to suggest lower levels again, and feel that 17.7500 area could be seen short-term.
Strategy SELL @ 17.9000-17.9500 and take profit near 17.7650 for now.

USDZAR-BUY strategy 2D CHART GANN The pair looks a BUY from a medium-term perspective. we have lower RSI area and also a positive MACD and Fisher form, and others. There are some short-term pressures downside, but overall picture feels we may see movement back towards 18.40s in the medium-term.
Strategy BUY @ 17.7500-17.8150 area and take profit near 18.3750 for now.

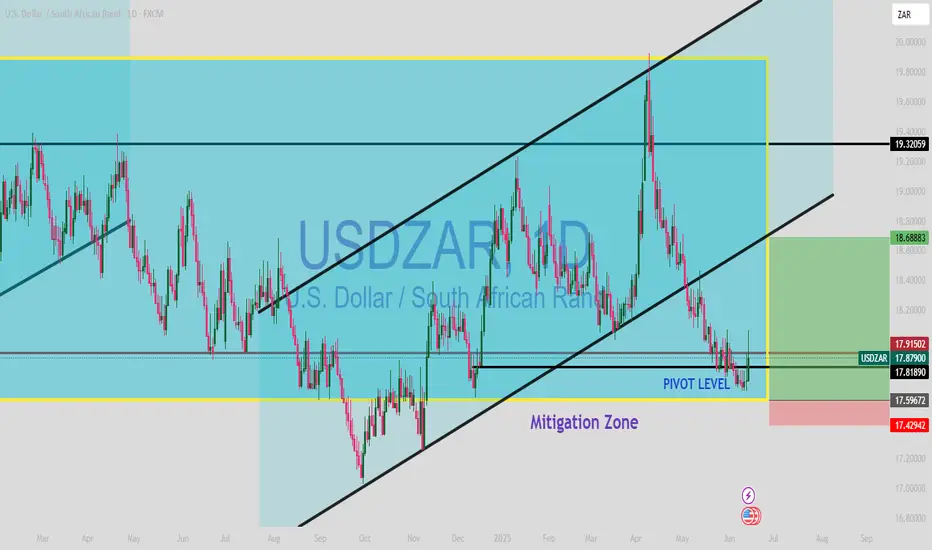
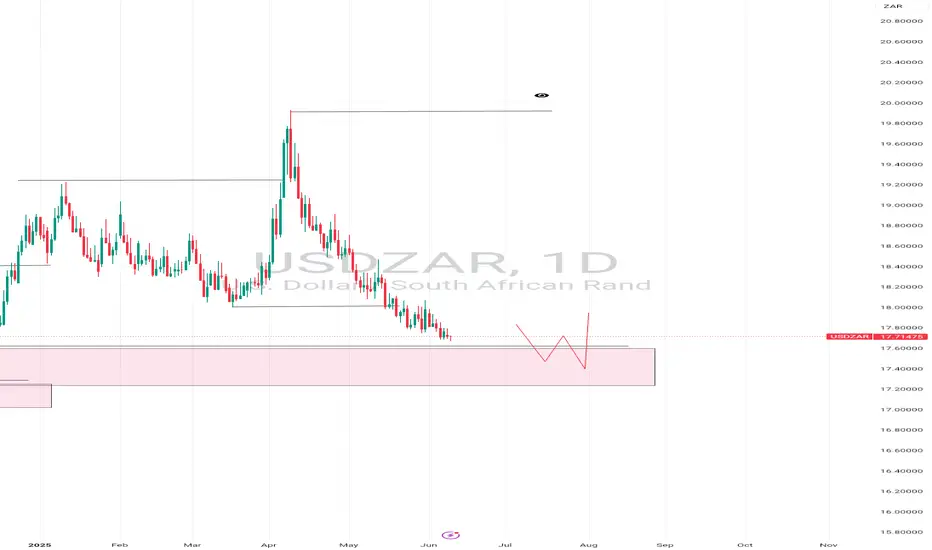
USDZAR (LONG)
Price broke out of trendline
and its time for it to come retest the breakout.
We are at D1 support level
USDZAR-NEUTRAL BUY strategy 6 Hourly chart GANNThe pair made a sudden rush upwards, whilst we have negative USDX and other currencies and stronger GOLD. This places caution on BU*Y side, however noting we are improving on the pair its USD value stance. The resistance 17.8150-18.8500 and 18.9500 are the areas to watch.
Strategy BUY @ 17.7350-17.7650 and take profit near 17.9350 for now.
USDZAR LONG TERM SELLUSDZAR has been respecting levels .. I think we will have a great opportunity if we sell at this point.

USDZARUSD/ZAR – Bearish Outlook Supported by COT Data 🐻
USD/ZAR is under pressure as emerging market currencies gain strength and the dollar softens amid shifting Fed expectations. Recent price action shows clear lower highs and rejection at key resistance levels. Conclusion: USD/ZAR remains vulnerable to further downside as both technicals and COT positioning confirm a shift in sentiment. Look to sell rallies toward resistance levels.

USDZAR-SELL strategy 12 Hourly chart GANNThe pair remains under pressure, even though we are oversold (not extreme, but getting to become). I am cautiously suggesting SELL strategy due to the reason we are on the verge breaking down through the major support level, whilst we are protected 17.7150-17.7450 area.
Strategy SELL @ 17.6950-17.7350 and take profit near 17.5875 for now.


Price action Usdzar swept liquidity positioned upward broke the lower high came back for restet expecting more upward movement

Bullish outlook Structurally usdzar looks to e in a bullish environment, I would be watching algorithm take out early bus and also use that medium to trigger the bullish banks into the market
USDZAR-SELL strategy 3 hourly chart GANNThe pair has not been doing much last few sessions, but certainly it has weakness embedded into the price action.
Strategy SELL @ 17.7350 - 17.7650 and take profit near 17.6175 for now.

USDZAR-BUY strategy 3-Daily chart Reg. ChannelThe pair has after all moved little lower, and I became hesitant bailing out of the SELL. Now that we have moved lower, and considering its oversold status (reasonable), we should start considering the BUY strategy for a medium-term basis.
Strategy BUY @ 17.6675 - 17.7350 and take profit near 17.9750 for now.

usdzar buy tradeThe Relative Strength Index (RSI) is showing an upward trend, indicating increasing momentum. Additionally, the Moving Average Convergence Divergence (MACD) is showing a bullish crossover, further supporting the potential for an upward move.