USDZAR-BUY strategy 3 Hurly chart HEIKIN ASHIThe pair went down as expected, and now settling in at the lower levels. GOLD is moving lower again, and likely will go south below $ 3,100 I feel. The pair has room to correct to near 18.2750 or slightly higher before lower again.
Strategy BUY @ 18.0350-18.0750 and take profit near 18.2475 for now.
USDZAR trade ideas

USDZAR-NEUTRAL SELL strategy 6-hourly chart GANNThe pair is indecisive to say the least. I feel over time we should see higher levels, but short-term its a bit cloudy. Right now resting support area 18.2100-18.2350 and a few negative indicators. One I use (not shown) is negative, and carries some credibility when combined with others. For now I see 17.9500 possible, before we return higher.
Strategy SELL @ 18.2350-18.2650 and take profit near 18.0350 for now.

USDZAR Bullish Setup Developing Near Key Support🕰 Weekly Overview:
Price held firm at a key weekly support zone last week, suggesting buyers are stepping in to defend the level.
📉 Daily Chart Explanation:
Sellers have lost momentum, and recent candles show signs of bullish pressure beginning to emerge. This could indicate a potential shift in market sentiment.
⏱ 4H Chart Explanation:
Price has clearly broken above the descending trendline and reclaimed the 50EMA with strong momentum. If price retraces into the discounted zone, it may offer a favorable long opportunity.
📌 Plan:
Bias: Bullish
Entry: Wait for retracement to discounted zone (near broken trendline or 50EMA) and look for price action confirmation
Targets:
TP1: Recent high in 4h
TP2: Next resistance in weekly
Invalidation: Break below 4H structure and EMA50

USDZAR-SELL strategy 3 hourly chart - Regression channelThe pair has reached it objective near 18.4650 and from there fell sharply again. it was due to the fact we have a peak above the channel, and indicators are slightly negative due to the pullback, which means there are plenty of sellers out there.
Strategy SELL @ 18.3450 - 18.3850 and take profit near 18.1875 - 18.2250 area.

USDZAR-BUY Strategy 12 hourly - FIB The pair has moved from the lower 18.10s and had some recovery to 18.3200 area and then settled lower. we are in a wider range, but considering the distance from cloud support breal and where we are at, this seems a little large. If we consider the view that we have bottomed qhich it feels to be the case, we should have a recovery 18.4950 again.
Strategy BUY @ 18.1750-18.2350 and take profit near 18.4650.

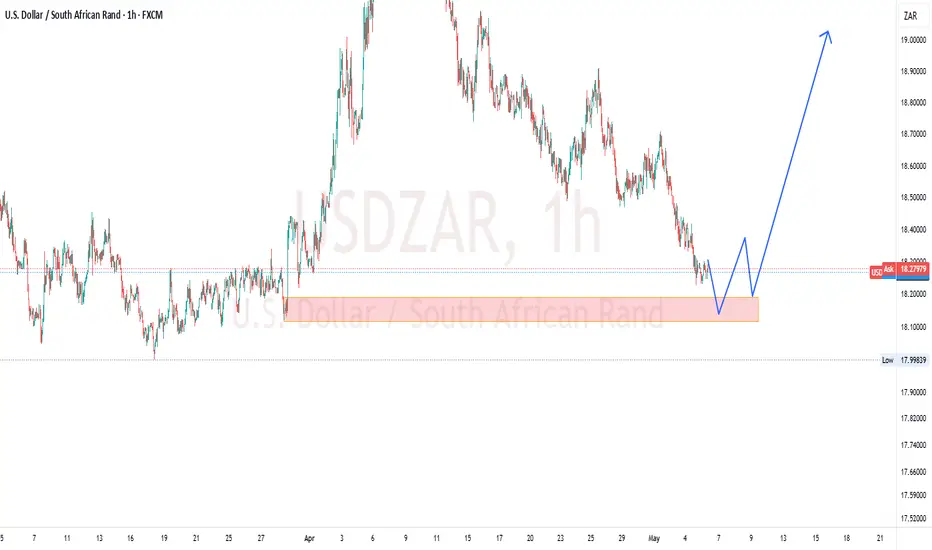
LONG USDZARThere seems to be huge demand for USD especially on the USDZAR pair.
The pair has printed the lowest prices it will reach during the month of May 2025, and probably June 2025 as well.
As such, we will be trading upwards from hereon.

USDZAR | 09.05.2025BUY 18.1600 | STOP 17.9500 | TAKE 18.5100 | The price has been declining smoothly and evenly for the previous 2 weeks towards the medium-term strong support range. At these levels we consider buying of this pair and corrective price reversal towards the nearest values of local resistance 18.5100 - 18.6800.

USDZAR-NEUTRAL BUY strategy 6 hourly chart GANNThe pair is a bit under pressure still, but considering overall view, we will turn the tide from the lower levels I feel.
Strategy BUY @ 18.1350-18.1650 and take profit near 18.3750 for now.

Bullish Look for potential Reversal bullish candlestick pattern formation upon the retest of daily demand zone

USDZAR-BUY strategy 12 hourly chart - Regression channelThe pair has moved little lower, but looking with a longer view point, we are approaching oversold levels (not extreme), but below channel. It is difficult to guess how far below the channel we may go, but with a careful approach we should start buying into the weakness slowly.
Strategy BUY @ 18.0000-18.0850 range and take profit near 18.4375.

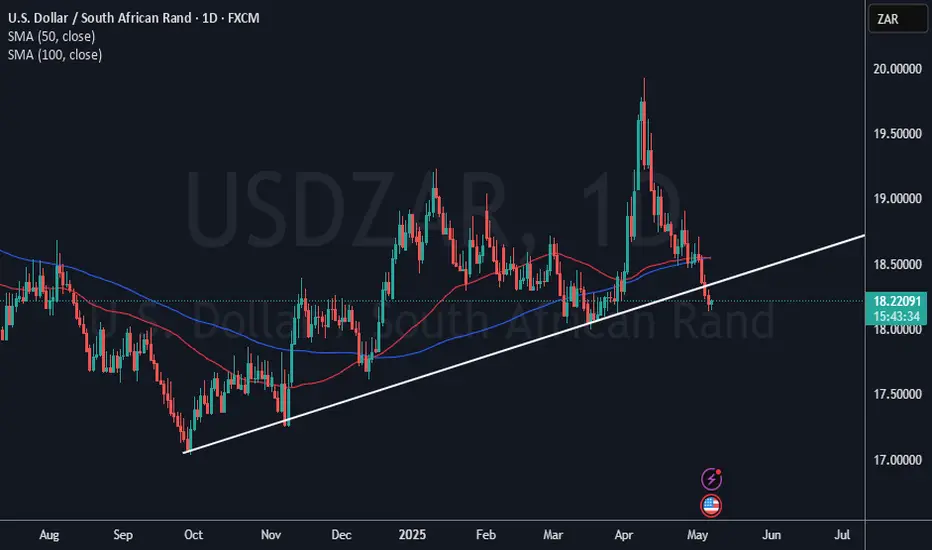
USD ZAR SELLBroke the Ascending Channel just like how it Broke the Descending one when starting the recent bullish move
We now looking for USDZAR Sell Opportunities for the next few months
I believe DXY will continue falling in order to relieve emerging markets from High Inflation levels

USDZAR-NEUTRAL BUY strategy 3 hourly chartWe managed first to move towards 18.3300 area after the BUY signal, but we fell short of objective.
Now we are under pressure, and it feels we may see a little lower. However, I prefer BUY strategy still due to the fact some indicators still provide some upwards possibilities.
Strategy BUY @ 18.1500-18.1750 and take profit near 18.3375 for now.

USDZAR LONGI am looking for entry LONG. The main trend is up,
i had an earlier post on idea of going long.
This is the zone now. Although there is a trendline that looks broken, I WILL LOOK AT PRICE ACTION.
USDZAR-BUY strategy 6 hourly chart - GANN The pair has reached near 18.1400 and form there we having moving gradually higher. We are oversold, and I suspect we will see a test if 18.4100 GANN resistance.
Strategy BUY @ 18.1950-18.2200 and take profit near 18.3750 for now.

USDZAR-BUY strategy 6 hourly chart Regression channelThe pair has kind of reached its potential I think, and from here I prefer BUY into weakness.. We are oversold and even though indicators are negative, I am worried of a spike upwards. I think it is realistic to say, when GOLD loses again its shine, it can suddenly become a reversal day for the pair.
Strategy BUY @ 18.2050-18.2575 and take profit below 18.4750 resistance.

usdzarlooking for perfect entry to go long. as the bear has been happining for the past months, the moment price react to key level, i will only enter buy on confirmation
USD/ZAR LongThe South African Government released a press statement late today promising to mitigate and reduce Load-shedding for the foreseeable future past the winter season. In contrast, the US Federal Reserve has yet to release its interest rate decision which we assume will remain the same. These contrasting forces are typical of a trend reversal, especially considering that the US is heading to summer in May, which is a good time to do business. Also, President Trump's birthday is on the 14 of June why not invest in the dollar for the good times to come? The Rand apart from appreciating Gold prices lacks any attraction. I believe that investors are positioning themselves to acquire liquidity to stake in America for the long run

USDZAR-SELL strategy 9 hourly chart GANN SQThe pair is oversold, and for those willing to go long for correction, the move upwards will be likely stalling near 18.4750 (double bottom area.
In terms of the break and the GANN SQ it is likely better to sell into rally.
Strategy SELL @ 18.4150-18.4450 and take profit near 18.2750 for now.

USDZAR | 02.05.2025BUY 18.4400 | STOP 18.3300 | TAKE 18.5900 | Technically, the picture of the price movement disposes to a slight growth to the levels of previous resistances inside the medium-term descending channel. We also expect today data on the US labour market and the possible impact of indicators on the dollar. A slight growth is likely.

USDZAR to break R20 barrier, and beyondWith a short retracement to 17.50/17.75.
My RSI shows a possible double support at 50. Always a sign for Bull movement ,
See how the Price structure is on the lower buy zone in the parallel structure
Plus horizontal and trend line confluence, shows me the USDZAR - WEEKLY
It is on its way to weakness, and break a massive psychological move up, into the
20s.

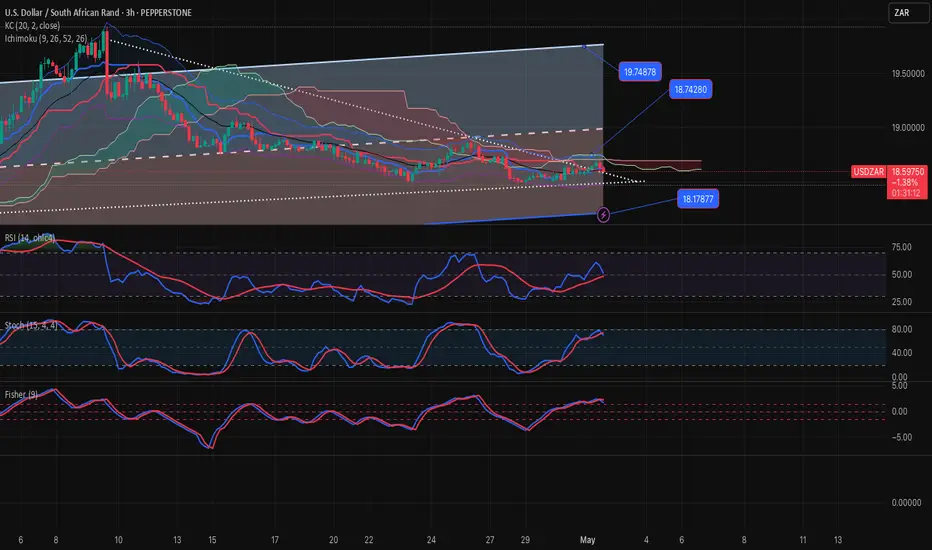
USDZAR-BUY stragegy 3 hourly Regression channelThe push lower was slightly more than expected, but the 18.7400 refusal and GOLD stabilizing caused the sharper down turn. From here, and current pricing we are oversold, and we should see a pullback to 18.4850-18.5200 again, is my viewpoint.
Strategy BUY @ 18.3500-18.3950 and take profit near 18.5025 for now.

USDZAR 15MIN BUY(1) A bullish rising wedge pattern expected to give a BUY at : 18.69855 (2) StopLoss : 18.57438 (5) TakeProfit : 18.80105

USDZAR-SELL strategy 3 hourly chart Regression channelThe pair has touched 18.70s and considering the resistance 18.7400 and moving back sharply lower 18.60s, it feels we have started another attempt lower once again. Overall we are caught between a larger range, and short term movements are difficult to grasp.
Strategy SELL @ 18.6000-18.6400 and take profit near 18.4750.