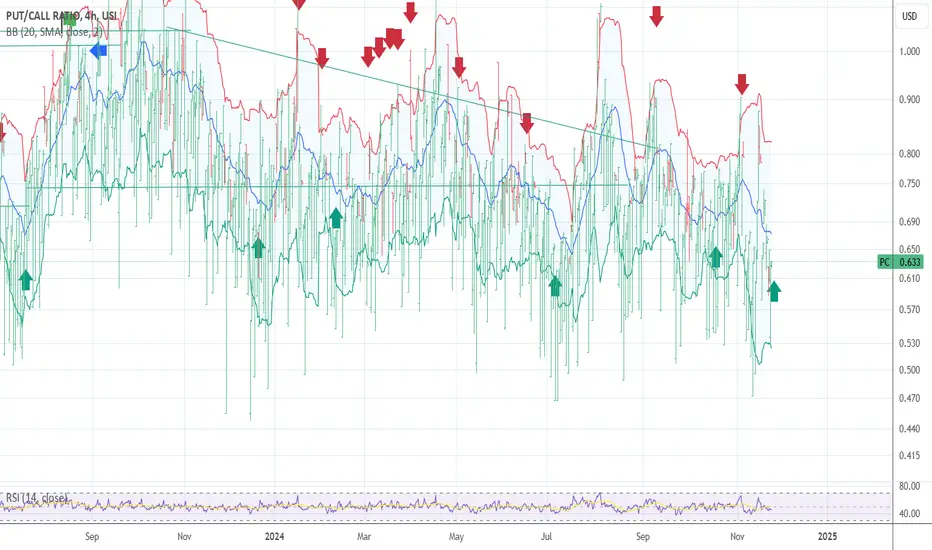
PUT /CALL SELL SIGNAL IS CONFIRMED The chart posted is my PUT/CALL model based on a 4 hr system I have used in the past to trigger buy and sell signals . I am now stating for the record IT IS NOW SET for and I.T. and long term SELL into the SPIRALS and VIX and BB Bands and we under GANN work I stated time n price july 5 to the 10th week 6183 to 6331 ideal target 6310 I am now 75 % long puts like i did 11/29 12/6 spiral and feb 18th I will move to 100 and 125 % long 2027 deep in the money puts . I am as bearish as I can get to put it in Perspective Like I said at 4835 the BOTTOM is IN TOPS take Time Bottoms are easy . Best of Trades WAVETIMER !
PC trade ideas

PUT CALL GAVE A BUY SIGNAL TODAY I am looking for 6177/6183 The put/call model has given a buy signal that gives me a New record highsp500 and qqq how it has formed I am long calls at 50 % and 75 short OIL today best of trades WAVETIMER

PUT/CALL MODEL is setup see trend line REACTION TIME I have posted this chart a few times for a reason now based on DSI in QQQ and NDX at record highs the last three TD I thought some may want to learn > best of trades WAVETIMER

PUT CALL MODEL SELL SIGNAL is Been given The chart is my own model Take notice of the green arrows and that trend line Notice anything ??? I do hope so . The trend is your friend till the End Time to hold my Beer ! best of trades WAVETIMER 85 % long puts waiting and hoping for a final POP .

PUT CALL SELL SIGNAL IS NOW IN PLACE I am 100% short The chart posted is the put/call model We popped thru the bb bands I have now moved to a 100 % puts in the money dec 26 on qqq and spy I will add if the qqq can print 494 or the Spy can print and new high The cycle top was due 5/12 is a minor n MAJOR Best of trades Wavetimer

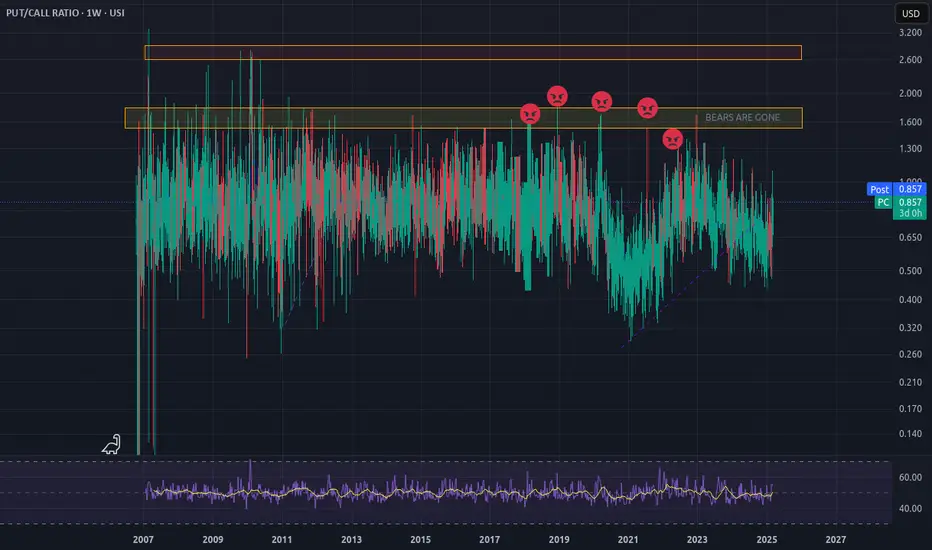
Bears are in oblivionThis chart shows that bears have literally been obliterated off the face of this market over the past 5 years. I'm talking about bears who actually take action, not the ones just sitting on the sidelines, blabbing. Even the 2022 bear leg barely pushed up the p/c ratio. Compare to market behaviour prior to 2020, even the entire average line was much higher. (Real sell-offs are marked by the unhappy face).
What does this mean? Well, I once thought bears were the truth speakers, the ones to speak of distortions from reality and prepare others for periods of "reconnection". Does it matter though if the distortion remains as reality?
I also read once that bears form the market bottom during significant downside events. Does this matter if the market never falls?
I suppose, we shall see.
PUTCALL IS STILL IN A BUY SIGNAL for the next 3 weeks We are seeing traders buying up PUTS into the rally This is rather BULLISH event for the market NOT bearish I said I am looking for a major short Squeeze It is very near . best of trades WAVETIMER

PUTCALL BELL RINGING BUY SIGNAL I am 90 % long callsData back to 1902 All CRASHES have been 8 to 12td days long today is day 9 I have moved to a 90 % long today and will move to 100 at 5718 mit and 110 % at 5644 plus or minus 11 We are ending wave 4 and will see a 610 pt rally in the sp 500 to a final BLOWOFF TOP from the march 10 to 13th Low it maybe early .So time to move 90 % long see the double red arrow signal . best of trades WAVETIMER

PUT CALL 4 HR BUY SIGNAL IS BEEN GIVEN I AM LONG CALLS 60% The chart is my put /call model and based on My rules in the 4 hr model I saw an end of th decline to mark wave C down in wave 4 .We are now started final wave 5 in the cycle I am looking for a new and FINAL HIGH for the BULL MARKET TO END from Oct 13 2022 low and MARCH 23 th 2020 super cycle wave 4 low Best of trades I am now 60% long CALLS WAVETIMER

SELL SIGNAL IS BEEN GIVEN put/callThe chart is my put /call model please take time to notice All signals Have a great weekend best of trades WAVETIMER I am now moved to a 100 % long deep in the money PUTS in QQQ and SPY for June 2026

Second Buy signal in my PUT/CALL model For the next 8 TD from this morning we have 7 more up days in this signal I would NOT be short or Long PUTS in RSP IWM QQQ SPY Best of trades WAVETIMER

PUT CALL BUY SIGNAL IS NOW GIVEN The chart of my model of put/call is giving a Buy this morning I have taken a 50 % long calls for 2026 in the money look for a new high is possible now target 6235

PUT/CALL NEW LOW NO ONE IS SHORT MAJOR TOP IN STOCK INDEXESThe chart posted has hit a new low on the 20 moving avg put/call .To top it off The one day closed at the low for the year at .58 More traders are betting on Santa then in the last 2 years !!! I have taken a 95 % long in the money puts .The first quarter of 2025 We could see something Very Big to the downside well over 600 to 1300 SP 500 points Cycles point to march 10th to the 20th for the first leg down . And looking at Europe markets as well and The top I called in the nifty 50 looks like it is also ready to roll over once again . .The gold ratio cycles aka the 6 spiral due on 11/29 to 12/5 came The DJI and DJT and XLU as well as the NYA all topped that window and has fallen everyday since . BEST of TRADES WAVETIMER

ALL PUT/CALL MODELS are in SELL SIGNAL notice the TRENDLINE The chart posted in one of 3 put/call model I use for a signal ALL three gave an OUTRIGHT SELL Notice the trendline 7/23 - 7/24 - 12/24 I am back to a 95 % long in the money puts 2026 jan and june in QQQ SPY we are topping in wave 3 of five now

PUT CALL GIVING A SELL EXIT NOW The put call model just gave a sell as we fail to break Above 5981/5984 in fact we keep failing at the A x 1618 at 5972 The risk is now HIGH of a C wave decline down to .618 or 786 that is 5820 to 5760 I will NOT SHORT based on the alt MOVE TO CASH
PUT/CALL BUY SELL SIGNALS WE HAVE A SIGNALThe chart poste is my model in put call I now have heavy puts buying and is outside the bands A signal is now setting up my signal for a turn 10/10 to 10/18 came right on time I have another signal . best of trades WAVETIMER

PC Ration & Gold = Mixed market sentimentThe Put Call Ratio is dropping fast suggesting that investors have a bullish sentiment in the market. Gold is shooting up suggesting that some investors are seeking a flight to safety. This points to a mixed sentiment in the market. Trade safely.

PUT/CALL BUY SIGNAL 2nd one Record high coming The put/call model see RED arrows Has given a second buy signal . As I have said for sometime to review 2007 july to oct charts . I look for a labored final leg up in wave C in the diagonal wave C up can be as short as .618 328 pts =5731 and on avg travel .786 418 pts =5810 of the last up leg . best of trades WAVETIMER

PUT CALL BUY SIGNAL MAJOR SP 5760/5880 The chart posted is my 20 day put/call . We have now reach a .50 % of the drop in QQQ and we have broke above .618 and 50 % of the drop in the sp 500 cash . We are alos forming clean 5 waves up patterns based on this chart in the put /call alone I must view the correction as OVER I had saw a chance to drop into 8/12 but the structure has turned up . Once we break above todays high n on a closing basis I will look for the min of a .786 to re think . Wavetimer
I.T. Put/call BUY in place The chart posted is that of my Put/Call model today is the second time we saw this happen in 2024 the last time was JAN /!7 th Low. . Risk now is being SHORT or in PUTS . Next turn date is 4/8/2024 best of trades WAVETIMER !

PUT CALL NEARING ANOTHER BUY SPY SIGNAL The chart posted is the put/call model I use I am getting another BUY the spy and now QQQ I am now long a 10 % position but based on the model I am moving to a 35 % long dec calls only

20 day PUT/CALL SELL is now been given I am now moved to a net short the spy at 95% long in the money 510 puts for dec 2024 .I am holding out to move to a 100 to a 115 % short if we can have two thing occur .1st the sp prints 5055 and the vix on the 9 day prints 11.30 or lower.I have been waiting for the 5071 target and the dji of 38950to 39450 focus 39100 .But I saw some math as to why we stopped at 5048 . The nyse as just seen a record high today on a print basis and as we are very close the ENEMY of Good is PERFECTION

COVER ALL PUTS MARKET MOVE NET LONG CALLS DIA BUY SIGNAL IN P/CThe chart posted is the 10 and 20 day PUT CALL model I have posted a BUY signal today see red arrows Look for one last rally now to into 381.9 to 385.2 focus on 383.6
