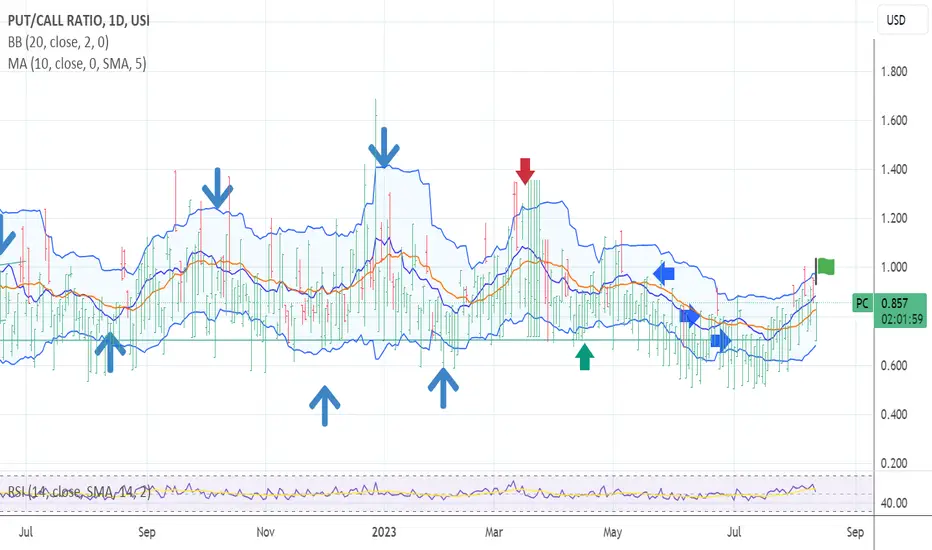
20 day put/call signalsThe chart posted is my 20 day put/call model the RED arrows have been BOTTOMS to be moving Long the GREEN arrows Have been SELL signals as you can see this is NOT yet turned BUT it is based on the roc models I will also post vix
PC trade ideas


BEAR TRAP ENDED BULL PHASE TO SEPT 10 /oct10 focus 9/21 topThe chart posted has given what state is a very clear ALL GO for the LAST BULL MARKET LEG. This last leg will end into mid sept . I will post more but a min is 4666/4731 . This will mark the END of The bull rally from oct 2022 and we will then see a very neg cycle One in which you all do not want to in the market for . Use this leg to Sell all long term holdings into WAVE B

BEARS ARE BEING TRAPPED the P/c is setup This is the hourly P/C they are betting with what they do not have

PUT CALL BUY SIGNAL is been given The chart posted is the 5 ,10 and 20 day p/c model The green flag is up this should lead to the final rally of 2023 to peak on or about sept 10 th target is 4666 ideal but from 4631 to 4731 will be there I will exit ALL LONGS THIS IS THE LAST WAVE UP . I then see the break down which should be rather steep and prolonged in a very deep recession as the deflationary cycle is and will be clear based on my work in money velocity . The consumer will be contracting and spending habits will drop very fast due to the paying back of student debt and housing deflation in the rent markets .
I am getting a buy signal in the p/c I am getting a p/c buy signal now and I am watching the vix . what is next is that if the qqq or spx prints a new low the Vix will then fail to rally past 17.2 on a close giving me the second part of the buy .

MAJOR SELL SIGNAL IS NOW IN PLACEThe chart posted is the 5 10 and 20 p/c A few weeks back like 2 I stated I had a BUY signal well that turned out to 100 % right . I now AM going to move to a 50 % net short as of this POST long puts

Put Call Ratio Up, Stocks Down?In 2023 the relationship between the Put Call Ratio and Indices has been clear. Put Call Ratio Up, Stocks Down. And vis-a-versa. Why? Significantly fewer Puts relative to Calls is not often sustained for too long and it reverts to mean. As more Puts are added, dealers hedge, forcing them to short in the outright market. Furthermore, if money managers are heavily exposed to long stocks and indices (as they are now) AND they have low levels of Put options to hedge those positions, then if aggressive selling begins, panic selling can follow. So no news, down slowly? Bad news, down quickly?

I now have a PUT/CALL SELLThe chart posted is that of the p/c model last week I said I had a BUY signal and to which I was given so much grief from traders It was spot on and all alt targets met and the 17 day shift from 2018 called for the peak on or about july 17 .I now have moved to a net short looking for a very sharp drop or worst into aug 25th I am net long march and feb in the money puts in QQQ and SMH . best of trades WAVETIMER

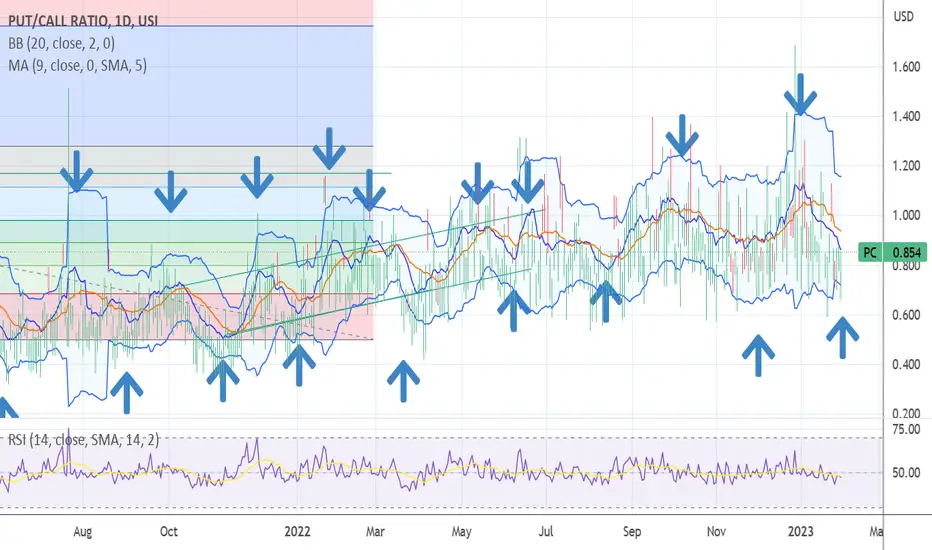
PUT/CALL BUY is been given it is going to 70 on a 10 n 20 dayThe chart posted is the put call on a 10 and 20 day avg one my my best tools it should bottome at or near the same low point as it did on 4/4/2022 the qqq were ate 370 area at that time we are now at 77 on it .Conclusion the QQQ will now rally above fib relationship at the 371.6 wave a or 1 x 1.618 to 378/383 . based on this alone . Have taken a net long calls in GOOG

PUT CALL 10 DAY SELL SIGNAL IS NOW BEING GIVEN MOVE TO LONG PUTSThe put call model as well as high level of Bullish put call model is now giving a great signal as well as fib cycles and golden ratio price projection! I am now moving to net short ALL INDEXES AND LONG 75 TO 80 % IN THE MONEY PUTS IN SPY QQQ AND SOON NVDA

Weekly Levels & Trade Prep. Mar13-17 (Part 2)Complimentary video to my Weekly Levels charts. Video 2 of 2.

PUT/CALL SELL SIGNAL SETUP 10 DAY DO YOU FEEL LUCKY So do you feel Lucky do you . did the market have more legs up or did you shoot that last injection of suckers money . Well to you feel lucky Punk MAKE MY DAY

PUT CALL SIGNALS 20DAY/10DAY Chart posted is that of the 20 day and 10 day put call signal we are reaching a level to be net long PUTS and SHORTING
A Crowded Bear TradeOn 09/16/22 soon after the SPX made a new correction low, the Put/Call ratio hit its highest level in over a year.
This indicates a huge amount of money buying puts - a bet on more downside action.
Today on the open the SPX bottomed just above the 09/16/22 low.
This is a cowded downside bet - frequently this situation is the prelude to a change in market direction.
Mark

P/C BUY SIGNAL N SELL UPDATED Next week is going to be fun . Have safe and peaceful labor day best of trades WAVETIMER

BUY SIGNAL WITHIN 2 TD CYCLES FEAR is near max as we end the first leg down see april 2000 to oct 2002 Do worry about the man behind the curtain nothing to see here

PUT/CALL SELL SIGNAL SETUP 10 DAYThe chart posted is that of the 10 and 5 and 20 day putcall at each arrow trend changes I am net long vix and looking to short qqq and spy for drop into .786 of this rally for wave B down within the first abc up do not be long any sectors outside of the VIX

strategy for TOTAL PUT/CALL RATIO COMPOSITE FRIDAY 04/08/2022put/call ratio composite: it is a periodic meter that helps us to enter the market. which works the opposite, at this moment it is showing more bearish opportunity. I do not know if you can notice that the market opens bullish and then falls sharply.
one or another actions rise either by positive economic news or technical movement. when the put/call ratio is above zero, it is not showing any more upside opportunities. this is valid for swing trader, day trader..............! I hope this can help you in something especially to the newbies


Put call BUY SIGNAL IS NOW IN PLACE AS WELL TO NASI 10 Day has now reach the 50% retracement level also in the P/C the rocket is set what happens if peace broke out would you still be bearish boys . well do you feel lucky punk

MArket selloff not done yetOur trusty option trigger signals potential for a bump in the early morning tomorrow with continued selling on the 45 min chart. This market is deffinitely sucking longs in and then kicking them in the teeth. Trade safe and with a plan, folks.
