Natural Gas is in the Buying DirectionHello Traders
In This Chart NATGAS HOURLY Forex Forecast By FOREX PLANET
today NATGAS analysis 👆
🟢This Chart includes_ (NATGAS market update)
🟢What is The Next Opportunity on NATGAS Market
🟢how to Enter to the Valid Entry With Assurance Profit
This CHART is For Trader's that Want to Improve Their Technical Analysis Skills and Their Trading By Understanding How To Analyze The Market Using Multiple Timeframes and Understanding The Bigger Picture on the Charts
USNATGAS trade ideas
Natural Gas Bullish Reversal...Are the Lows in?U.S. natural gas inventories increased by 48 billion cubic feet last week to 3,123 Bcf, increasing the surplus over the five-year average.
Consensus / forecast was 37Billion Cubic feet.
Despite a much higher build than expected Nat gas saw positive price action.
This appears to simply be a dead cat bounce before we go lower.
A death cross on the daily chart has occurred. This signal often results in a small bounce before going lower.

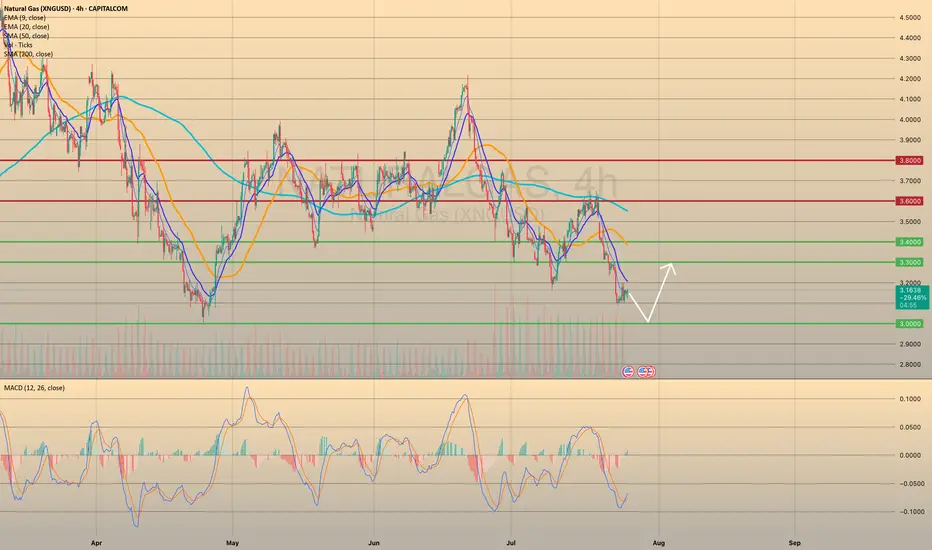
XNGUSD CONTINUES ITS DOWNWARD TREND. FOR HOW LONG?XNGUSD CONTINUES ITS DOWNWARD TREND. FOR HOW LONG?
Recent bearish impulse started at the beginning of this week may come to an end soon. Yesterday the U.S. Natural Gas Storage report came out. Numbers appeared to be lower than expected and lower than previous. (23b vs 28b vs 46b). This is bullish signal for the market participants. Minutes after the report came out, market reacted bullish, however, soon price went sideways.
Right now gas prices continue to decline. Still, the opportunity for short-sellers here is quite limited. Not so far below there is a level of 3.0000, form where I expect the price to rebound, supposedly to a 3.3000.
Natural Gas is in the Buying DirectionHello Traders
In This Chart NATGAS HOURLY Forex Forecast By FOREX PLANET
today NATGAS analysis 👆
🟢This Chart includes_ (NATGAS market update)
🟢What is The Next Opportunity on NATGAS Market
🟢how to Enter to the Valid Entry With Assurance Profit
This CHART is For Trader's that Want to Improve Their Technical Analysis Skills and Their Trading By Understanding How To Analyze The Market Using Multiple Timeframes and Understanding The Bigger Picture on the Charts

Bullish Diamond pattern (Reversal) is forming in Natural GasNatural Gas is show Classical bullish Diamond pattern character supported by oversold Rsi & triple bottom in weekly
Any good positive data will trigger sharp reversal in Natural Gas
Reversal will be brutual
Seller be cautious trail your stoploss

Natural Gas Rebounds from Key SupportNatural gas has bounced off its strong support level and is showing signs of upward movement, particularly evident on the hourly chart. Dips are being bought up, with the price quickly returning to previous levels.
Downsides: The downtrend is still in place (though it may potentially be broken), and there's a relatively long stop-loss below yesterday’s candle low at 2.98.
📝Trading Plan
Entry: buying gold at the current level
Stop Loss: 2.98
Target: 3.36, 3.62, and 4.20.

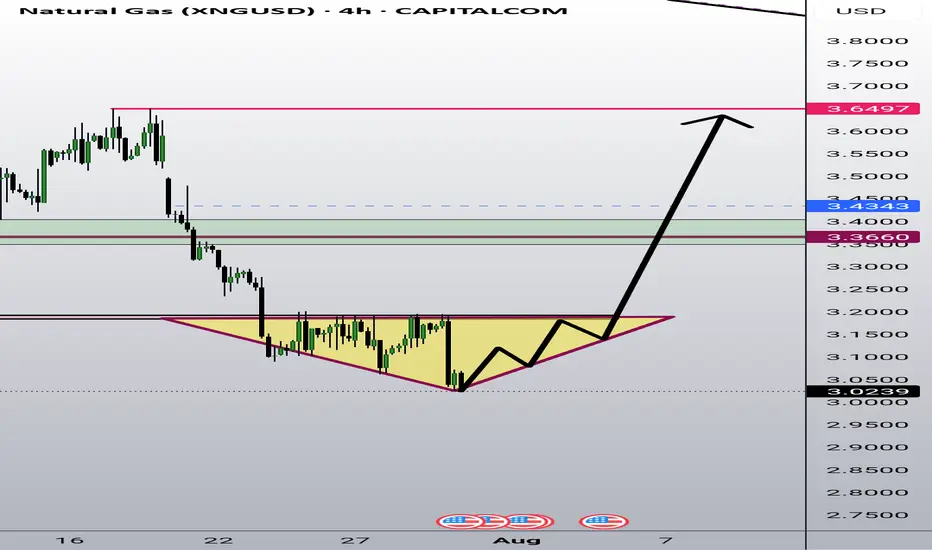
NATURAL GAS REACHED THE KEY SUPPORT LEVEL. WHERE TO GO NEXT?NATURAL GAS REACHED THE KEY SUPPORT LEVEL. WHERE TO GO NEXT?
XNGUSD has come to a crucial support level of 3.0000. Although the sentiment here stays as quite bearish (seasonally, August is not the perfect month for natgas buyers), we expect the price to rebound from the level of 3.0000 towards 3.3000 first. Afterwards, the continuation of bearish trend is expected with final target of 2.6000 before cold season beginning.

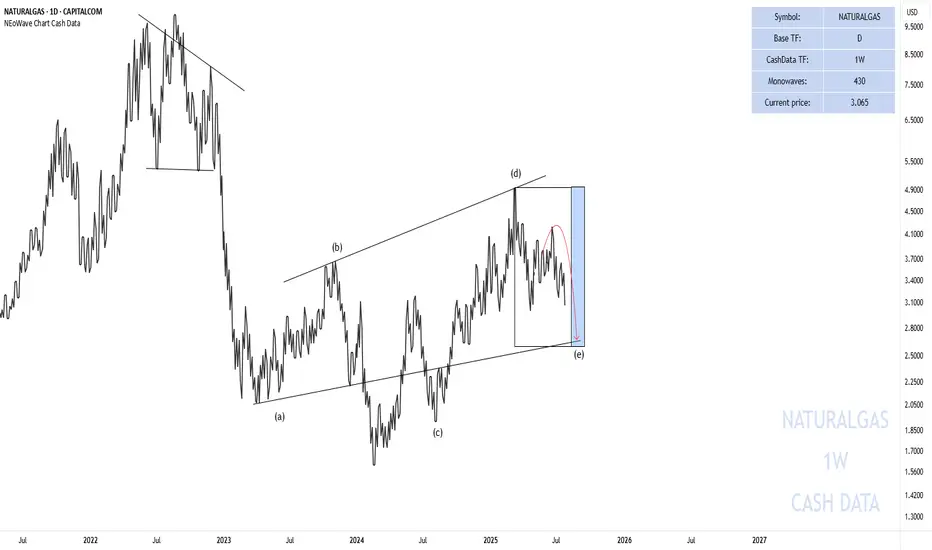
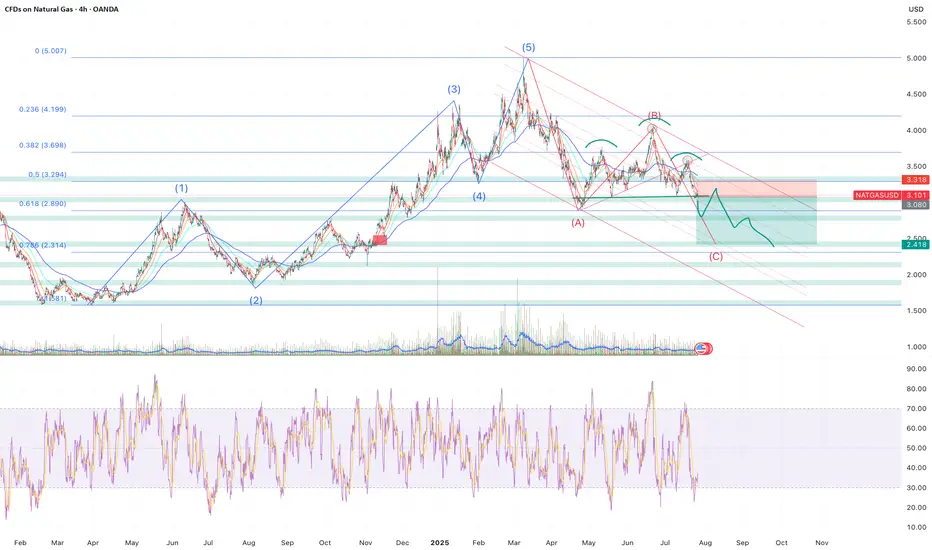
End of the Wave-(e) Natural Gas
In the previous analysis I said that:
Currently, wave-(e) is forming and I do not expect a strong upward movement until August 12-September 12 and this wave can take time until the time range I specified for it.
In the picture you can see that the price has started to decline again exactly from where we specified and has fallen by 27% so far. The price is not necessarily going to fall to 2.66 but time must pass and the price must enter the specified time range.
Good luck
NEoWave Chart
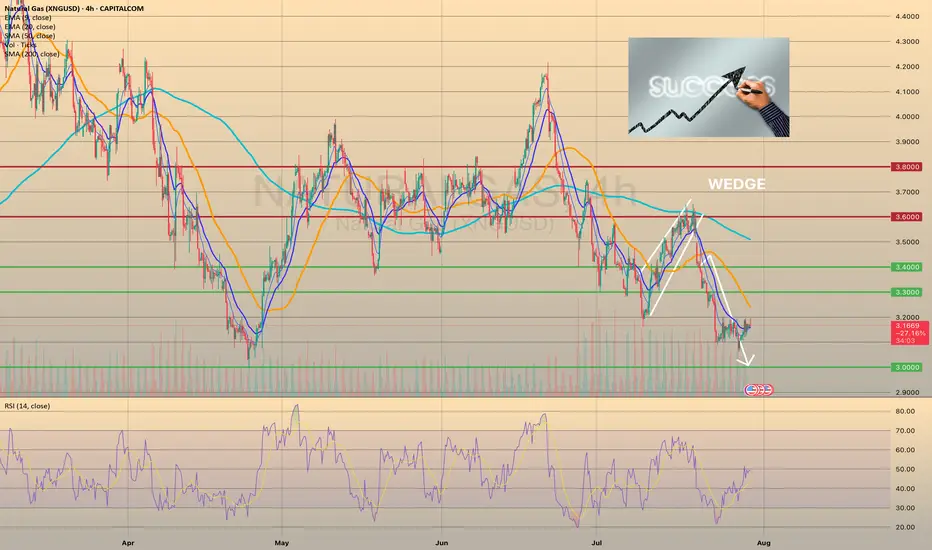
Sell NATGAS into OCT/NOVNatalie has fromed a H&S and has broke through all of the supporting EMAs leading to most of the indicators turning bearish.
My approach for the forseeable is seeling bounces until the winter season approaches.
Of course Natalie is extremely susceptible to trend changes due to economical data and has to be monitored closely. Currenlty I'm a bear.
Only selling once it breaks and retests, where I will once again reasses based on economics such as storage, production, imports and demand.
Target around $2.5 where interestingly a gap (red rectangle) sits from Nov - 24.
Elliot Wave (although not a great fan) kind of aligns as well as the 0.786 fib level which began forming at the beginning of 2024.
Storage | Volatility | Price Outlook
U.S. natural gas markets are stabilizing as volatility trends back toward seasonal norms.
📉 Volatility has dropped from 81% in Q4 2024 to 69% in mid-2025
🏪 Storage is currently at 3,075 Bcf,
🔻 4.7% lower YoY
🔺 5.9% higher than the 5-year average
🚢 LNG exports remain strong—up 22% YoY and 74% above the 5-year average
🔌 Domestic demand is seasonally weaker but steady
➡️ Despite being below last year’s levels, storage surplus vs. the 5-year average acts as a soft ceiling on price.
➡️ Historical analogs suggest a fair value range between $2.50–$3.20/MMBtu in the short term.
📊 Current price action around $3.00–$3.40 looks slightly overheated unless a fresh catalyst emerges (heatwave, export spike, etc.).
🧭 Watching for:
Injection trends over the next few weeks
Cooling demand in power sector
Resistance around $3.40
Support near $2.80
Wedge Pattern — A Key to Trend Movements📐 Wedge Pattern — A Key to Trend Movements 📈
🔍 Introduction
The Wedge is a chart pattern that represents a phase of directional consolidation following a trending move. It can act as a continuation 🔄 or a reversal 🔃 signal, depending on the context. The structure consists of two converging trendlines, both sloping in the same direction.
🧩 Pattern Description
Unlike the Flag pattern 🚩, the Wedge has no flagpole and doesn’t depend on the direction of the previous move. The direction of the wedge body determines its type:
A falling wedge ⬇️ is bullish 🟢 (buy signal)
A rising wedge ⬆️ is bearish 🔴 (sell signal)
The breakout is the key point to watch. The two trendlines slope in the same direction but at different angles, causing them to converge. This reflects a loss of momentum ⚠️ and typically indicates that buyers or sellers are preparing to take control.
This pattern can act as:
A continuation signal 🧭 — appearing at the end of a correction
A reversal signal 🔄 — forming at the end of a strong trend
📉 Volume is usually low during the wedge and rises on breakout. A low-volume breakout increases the risk of a false breakout ❗. Often, price retests the breakout level 🔁, giving traders a second chance to enter.
🎯 Entry & Stop-Loss Strategy
📥 Entry: On breakout confirmation
🛑 Stop-loss: Below the pattern’s low (bullish) or above its high (bearish), or under/above the most recent local swing point
🎯 Target: Project the height of the widest part of the wedge from the breakout point. Alternatively, use key price levels 📊 or a trailing stop 🔂 to lock in profits.
💡 My Pro Tips for Trading the Wedge
✅ Pattern Criteria
Two converging trendlines ➡️➕➡️
Clearly defined structure ✏️
Prior trending move before the wedge 🚀
Low volume within the wedge 📉, high volume on breakout 📈
Retest of breakout level = confirmation 🔁
🔥 Factors That Strengthen the Signal
Breakout on strong volume 📊💥
Appears after an extended trend 🧭📉📈
More touches = stronger pattern ✍️
Breakout occurs close to the apex 🎯
⚠️ Factors That Weaken the Signal
Low volume on breakout 😐
Poorly defined trendlines 🫥
Few touches on lines
Early breakout (too far from apex) ⏱️
No prior trend / appears in a range-bound market 📏
✅ Examples of My Successful Wedge Trades
📸
❌Examples of Failed Wedge Overview
💥
💬 Do you use the wedge pattern in your trading?
It’s a powerful pattern, especially when confirmed by volume and market structure. Share your favorite wedge setups or ask questions below 👇👇
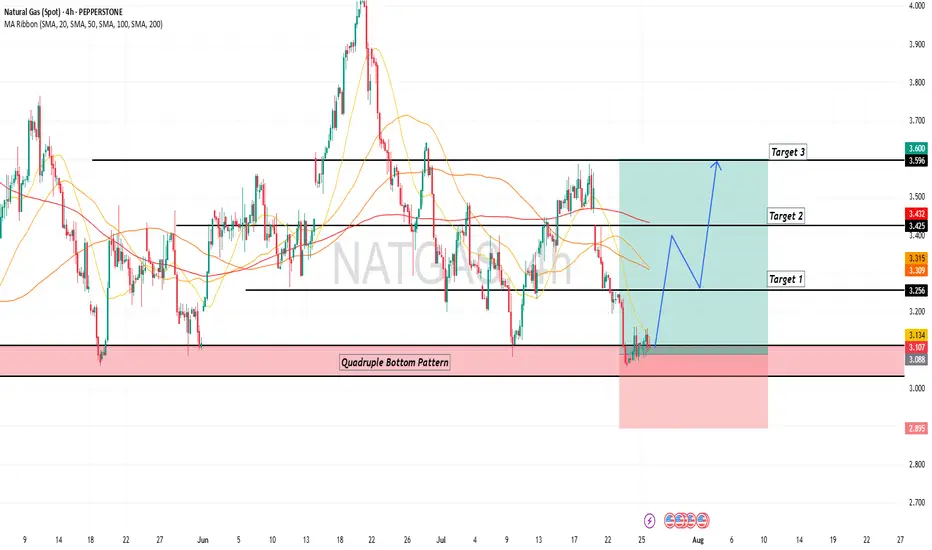
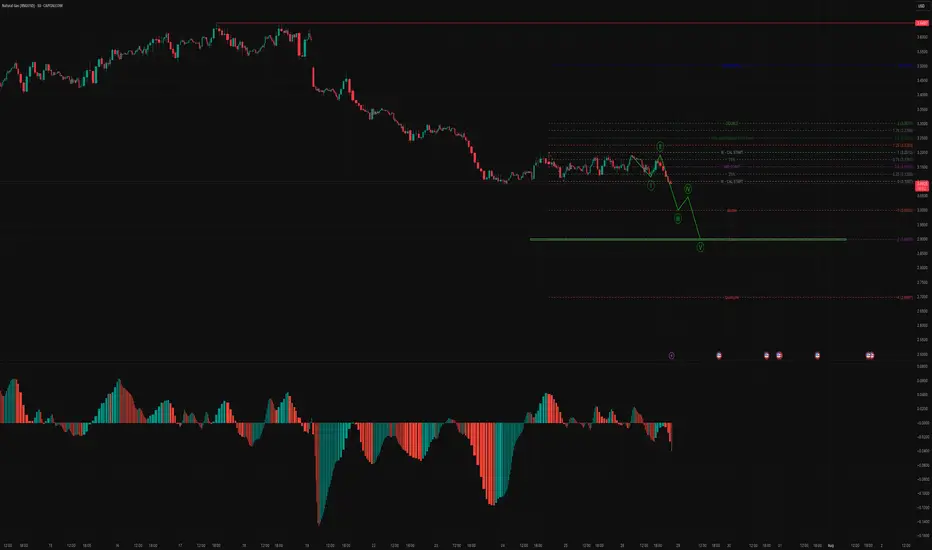
The technical analysis for Natural Gas (NG) 📉 Current Market Structure & Interpretation
🟢 Elliott Wave Count (Bearish Impulse in Progress)
The chart suggests a 1-2-3-4-5 impulsive wave is unfolding on the downside.
Currently, NG appears to have completed Wave 2 (retracement) and Wave 3 is in progress, heading toward a major breakdown.
The structure projects Wave 3 → Wave 4 pullback → Wave 5 final leg.
🔍 Fibonacci & Key Levels (Bearish Projections)
Wave 3 Target Zone:
-1.0 Fib Extension (~3.00) marked as "double"
Strong support break zone; high probability breakdown confirmation
Wave 5 Completion Target:
-2.0 Fib Extension (~2.807) highlighted as major support
Also aligns with a long-term base/accumulation zone
Extreme Bearish Target:
-4.23 Fib (~2.687) – only in case of panic sell-off (marked “Quintuple”)
📊 Volume & MACD Histogram (Lower Panel)
Strong bearish momentum in MACD histogram: red bars extending and deepening.
Bearish volume expansion visible during Wave 1 and Wave 3 fall, validating impulsive nature.
No sign of volume divergence yet – supports continuation.
🔄 Retracement & Pullback Zones
Wave 4 likely to pull back between:
0.25–0.382 retracement of Wave 3
Could test the area around 3.04–3.08, before turning back down
⚠️ Invalidation & Risk Level
If price breaks above 3.13–3.16 (0.618 level of the total fall), wave count may get invalidated.
Otherwise, structure remains bearish.
🎯 Short-Term Trade Plan (Bias: Bearish)
Aspect Details
Entry Zone Any pullback near 3.04–3.08 (Wave 4 zone)
Target 1 3.00 (Wave 3 completion)
Target 2 2.807 (Wave 5 final target)
SL/Invalidation Above 3.13–3.16
Trade Type Short / Put Option / Futures Sell
Bias Intraday to Short-Term Positional
✅ Conclusion
The chart shows a well-structured Elliott bearish impulse, currently in progress with strong downside momentum. Expect further continuation toward 2.80 zone, barring any invalidation above 3.13. The Fibonacci confluence and momentum support this outlook.
Disclaimer:
This analysis is for educational and informational purposes only and should not be considered as financial or investment advice. Trading in commodities, options, and futures involves substantial risk and may not be suitable for all investors. Always conduct your own research and consult with a qualified financial advisor before making any trading decisions. The author or publisher is not responsible for any losses incurred from trading decisions based on this analysis.
U.S. NATURAL GAS SUCCESSFULLY REBOUNDED FROM FIRM SUPPORT.U.S. NATURAL GAS SUCCESSFULLY REBOUNDED FROM FIRM SUPPORT.
Yesterday the natural gas storage report came out higher than expected. U.S. natural gas inventories increased by 48 billion cubic feet last week to 3,123 Bcf, increasing the surplus over the five-year average to 195 Bcf from 171 Bcf the week before, the EIA reports. The storage increase was bigger than the 24 Bcf average for the week, and above the 36 Bcf estimate. However, the price rised on 2.35% afterwards, supported by increased volume, which indicates the strength of the level. The upward movement towards the 3.3000 level is highly expected.
Additionally, seasonals suggest us that current prices may become the lowest till the end of the year. Historically, since August the natural gas prices increase in anticipation of a new heating season and higher energy demand (pic2).

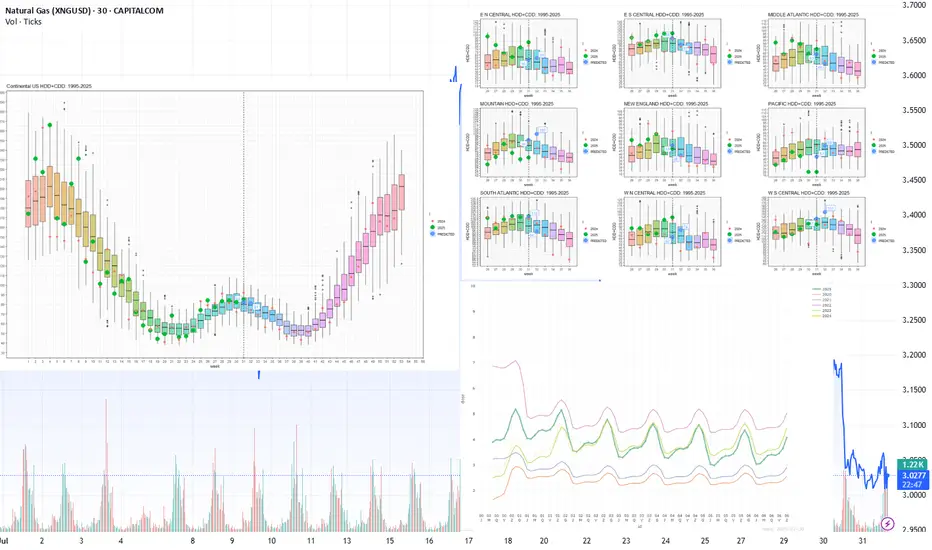
LNG and Weather Factors: We Expect Moderate Storage IncreaseThe natural gas market enters Week 31 with a sense of equilibrium, as prices hold steady and storage levels continue to climb. The expiration of Contract Q aligned with the 15-year median, while Contract U trades near the median, and 2025 fall contracts remain within the interquartile range, slightly above median levels. However, Winter 2026-27 contracts persist above the upper quartile, hinting at lingering supply and weather concerns. A projected 39 BCF storage increase for Week 30 (July 21-27) keeps inventories above the five-year median, supported by robust injection rates. Yet, a sharp rise in the supply-demand differential, driven by increased power generation and industrial consumption, signals evolving market dynamics as LNG exports dip. Weather stabilization and regional trends further shape this outlook, which we explore in detail below.
Current prices compared to price dispersion 10 days before expiration by month since 2010
The expiration of contract Q was in line with the median for the last 15 years. Contract U is trading close to the median. The prices of subsequent contracts have not changed significantly. The 2025 fall contracts are trading slightly above the median values on the expiration date, while remaining within the interquartile range. The 2026 and 2027 winter contracts continue to be above the upper quartile.
Forward curve compared to 2020-2024
(Lower graph on the right)
Despite the fact that prices for 2025 contracts with delivery in three years have approached the levels of similar contracts for 2023 and 2024, there remains a pronounced skew in the forward curve in segments with the nearest (1–2 years) and most distant (5–6 years) deliveries.
Current stocks and forecast for next week compared to 2019-2024
For week 30 (July 21-27), we expect an increase in storage of 39 BCF. The fill rate remains firmly above the median for the previous five years. Injection rates are maintaining positive momentum. If the current supply and demand conditions remain unchanged, peak levels similar to those seen in 2024 are possible. Weather and seasonal phenomena in the second half of summer and early fall remain a limiting factor.
Weekly HDD+CDD total based on current NOAA data and forecast for the next two weeks compared to 1994-2024
In the current week 31, despite expectations of HDD+CDD growth, the weather stabilized and reached the 30-year median. The following week (32) is forecast to be at the median level. The seasonal peak in weather has practically passed, and a decrease in HDD+CDD values is expected going forward.
(The graph on the left)
Explanation of the graph: the candles represent quantiles for 30 years from 1994 to 2024. Red dots represent 2024, green dots represent 2025, and blue dots represent the 2025 forecast.
Weekly HDD+CDD total based on current NOAA data and forecast for the next two weeks compared to 1994-2024 by region
(The graph at top right)
Looking at the regional breakdown, we can see moderate HDD+CDD levels in weeks 31-32 in virtually all regions except WS CENTRAL and MOUNTAIN.
Weekly total supply/demand difference compared to 2014-2024
In the current 31st week, the difference between supply and demand rose sharply above the median. With a slight decline in LNG exports, consumption for power generation and industrial production rose sharply.
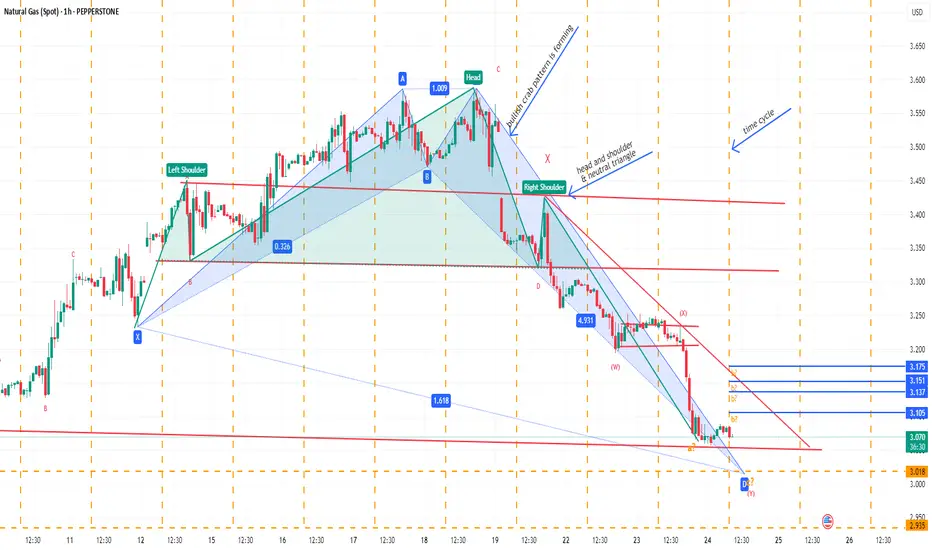
Natural gas spotHead and shoulder pattern observed and neo wave wise also appear either neutral triangle , if break neck line good fall and then near another bigger head and shoulder neckline. Let see

U.S. NATURAL GAS - BEARISH WEDGE WORKED OUT. WHAT'S NEXT?U.S. NATURAL GAS - BEARISH WEDGE WORKED OUT. WHAT'S NEXT?
Today, the market opened 2.66% below its closing price on Friday. The current price has already fallen on 4.8% since the closing on Friday, and it is now above the 3.400 support level. I expect further decline, however, with a possible rebound from the current level and pullback towards the SMA50, with a final target of 3.000.

NATURAL GAS SPOTBullish crab pattern may form, if another harmonic pattern may develop later.
Neo wave wise may be in wave Z need confirmation.
Time cycle high low break may be trend continue in break out/down direction.
Not sebi research analyst.
NATGAS Long Setup – Accumulation + Breakout OpportunityInstrument: US Natural Gas (Spot)
Timeframe: 1D
Published: July 24, 2025
By: @Rendon
📈 Idea Summary:
Natural gas is showing signs of accumulation after a corrective downtrend. Price recently tested key horizontal support around $2.96–$2.85 and is now attempting a recovery. Two potential bullish scenarios are outlined:
🧠 Bullish Scenarios:
🔵 Scenario A (blue path): Clean breakout above $3.32 with strong volume could lead to a continued push toward $3.56 → $3.79 → $4.05.
🔴 Scenario B (red path): Price may first retest the $2.96–$2.85 demand zone again before bouncing and gradually rallying toward $4.05.
🔍 Key Levels:
Support: 2.961 / 2.957 / 2.854
Resistance: 3.323 → 3.568 → 3.792 → 4.046
🛑 Invalidation:
A decisive close below $2.84 would invalidate the bullish thesis and suggest further downside risk.
📊 Volume Insight:
Volume has been drying up, which may indicate a potential spring or absorption before a breakout.
✅ Trade Plan (example):
Entry: On retest of $2.95 or break of $3.32
Stop Loss: Below $2.84
Target: First TP at $3.56, then trail toward $4.05
💬 Let me know in the comments how you see NATGAS developing and which path you’re betting on!

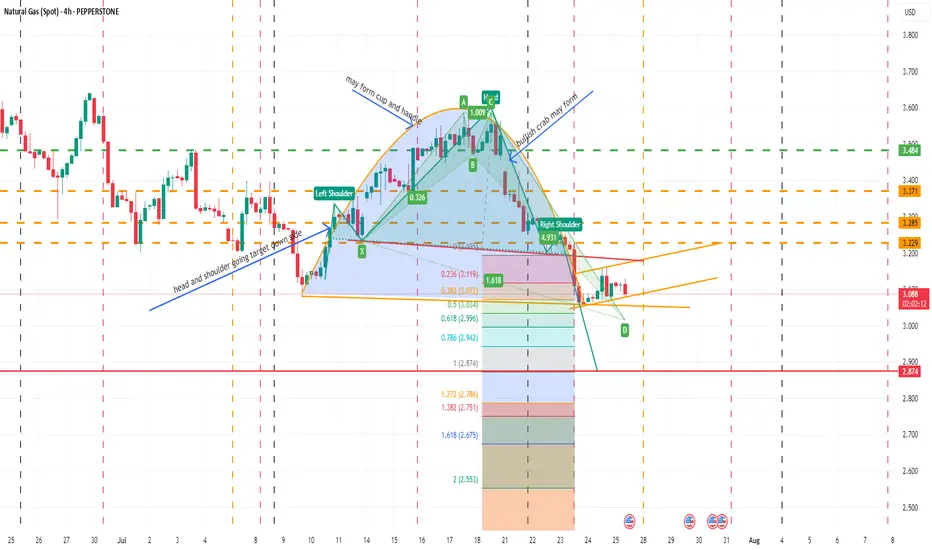
NATURAL GAS SPOTMay form inverse cup and handle, bullish crab also about to form , after completing one head and shoulder pattern already posted earlier new head and shoulder going on. In daily and 4 hr chart below ichimoku cloud. In weekly within cloud. Moving averages showing weakness in daily and weekly, monthly candle also no bearish. May be in such scenario bullish crab pattern may fail but need to be careful as over sold territory. Let see how all works in future though so far all as per analysis. I am not SEBI registered analyst.
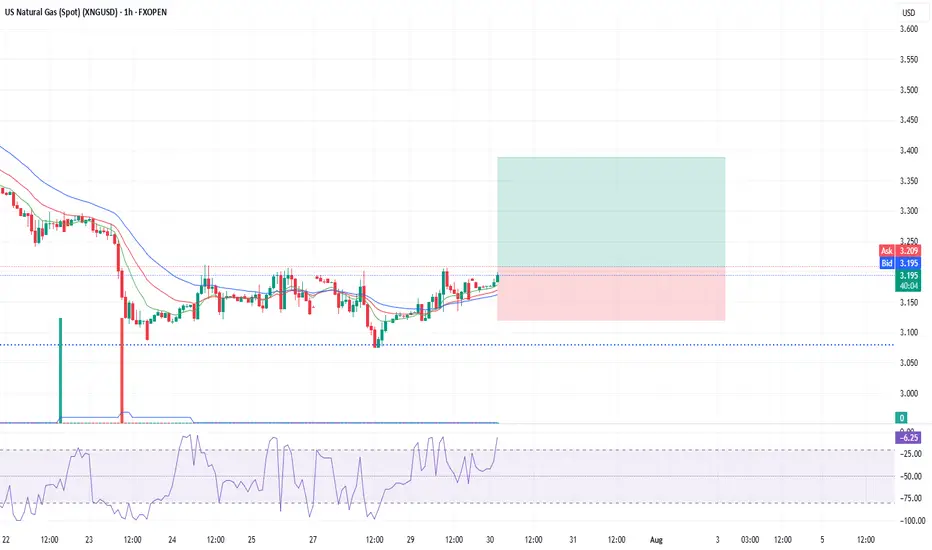
Natural Gas: Long Setup After Healthy PullbackNatural gas has made a decent pullback, and a solid long setup is forming here with a relatively tight stop-loss for gas.
If the stop gets hit, the second entry will be from the $3.00 level.
Entry is from current levels.
📝Trading Plan
Entry: Entry is from current levels.
Stop Loss: 3.0855
Target: 3.36
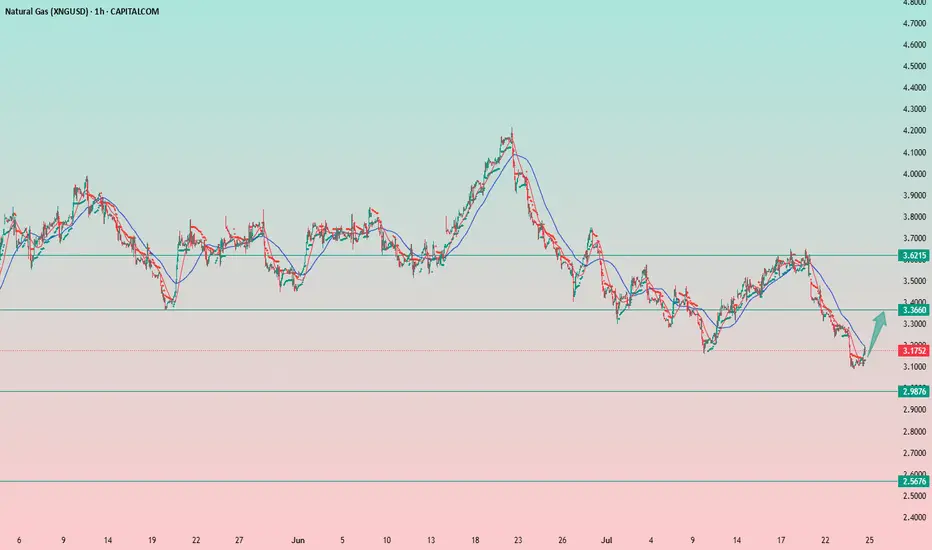
Triple Bottom @ Natural GasNaturalgas is near triple bottom
Best level for accumulation
Pure price action 💯

XNGUSD Technical Update – What the Chart Is Telling Us NowIn this video, I break down the current XNGUSD (Natural Gas) chart using pure price action analysis on the daily timeframe.
This update builds on my previous post, where I shared a comprehensive outlook supported by fundamentals, including supply/demand imbalances, geopolitical risks, and long-term LNG export growth.
In this video, I focus purely on the technical picture—highlighting key levels, market structure, recent consolidation, and where I see potential opportunities unfolding next.
📈 If you're trading or investing in Natural Gas, this is a must-watch update to stay in tune with the current market dynamics.
Remember: This is not financial advice. Always do your own research and manage risk appropriately.
