Crude oil is expected to break through the $68.00 mark
💡Message Strategy
WTI crude oil futures prices soared during the European session on Wednesday (June 11), continuing Tuesday's gains, but failed to reach the important level of $66.45. Currently, bulls are focusing on whether they can clearly break through the technical resistance level to confirm the continued upward trend.
OPEC+ plans to increase production by 411,000 barrels per day in July, the fourth consecutive month of increase. Its impact on global supply may be weakened. Domestic demand in Saudi Arabia and other OPEC+ members may increase in the summer, helping to absorb the additional supply. According to Capital Economics, this internal consumption may support oil prices in the short term by offsetting the increase in supply.
China-US trade truce boosts risk appetite, but demand questions remain
WTI hit a seven-week high, reflecting the recovery of market risk appetite after the China-US trade negotiations. The two sides have agreed on a framework for restarting the trade truce and easing rare earth export restrictions, boosting market sentiment.
📊Technical aspects
Oil price forecast: Bullish bias strengthens above key resistance level
If the bears regain control, $64.50 will be seen as the near-term support. A successful break above $66.75 could open up space for the next major upside target near $67.50.
Supported by geopolitical tensions, easing trade concerns and stable demand fundamentals, the outlook for crude oil remains bullish, provided that WTI can close above $66.75.
If a breakout is confirmed, it may attract new buying and push prices towards the $68 mark. However, if the current gains cannot be maintained, oil prices may fall back to the $64.50 range.
💰 Strategy Package
Long Position: 64.50-65.00,65.00-65.30
USOIL trade ideas

USOil LongUSOIL is now net long on the regression break.
Contract roll on the futures market is +1.6% on the front month.
I am considering my options and EAs to use on this market.

USOUL:Go long near 65.5
USOIL:Crude oil broke through the watershed 64.85 after the emergence of strong unilateral bulls, daily cycle relying on short-term average to go even Yang form, rising space has opened, pay attention to the strong will continue at least a few trading days, short-term relying on 65 defense needs to be more, pay attention to 65.5 near the long, see 66.7-67
Trading Strategy:
BUY@65.5
TP: 66.7-67
↓↓↓ More detailed strategies and trading will be notified here ↗↗↗
↓↓↓ Keep updated, come to "get" ↗↗↗

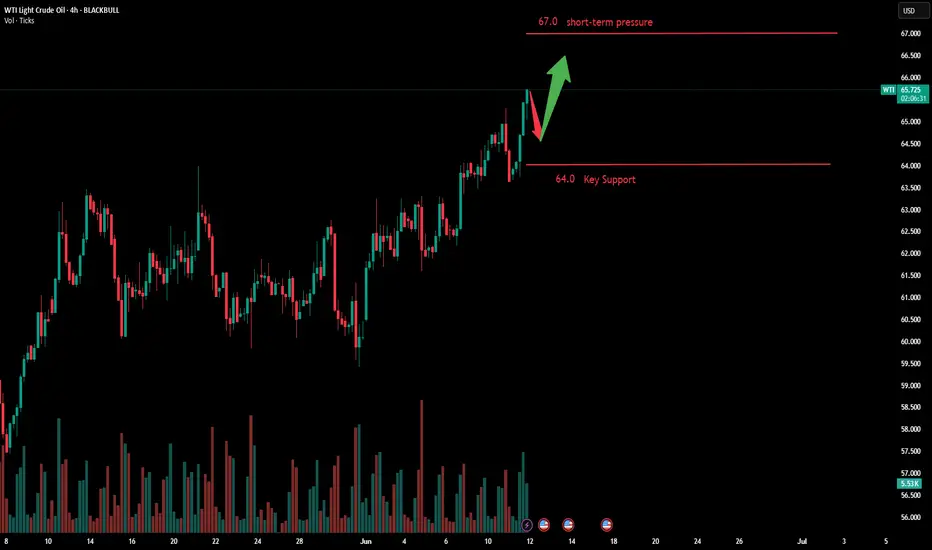
"Go long on crude oil with strong unilateral pullback"The market is weighing the impact of global trade tensions on the global crude oil demand outlook. After two days of intense consultations in London, the Asian giant and the U.S. have reached a framework agreement on restarting trade talks. U.S. Commerce Secretary Howard Lutnick said after the negotiations that the framework still needs review and approval from President Trump. Crude oil continued to rise after a pullback correction, showing a single bearish candlestick retracement pattern on the daily chart. With price supported at the MA5 level, it continues to make new highs, and this rally could target the 67.0 level.
Humans need to breathe, and perfect trading is like breathing—maintaining flexibility without needing to trade every market swing. The secret to profitable trading lies in implementing simple rules: repeating simple tasks consistently and enforcing them strictly over the long term.
Trading Strategy:
buy@64.0-64.5
TP:66.5-67.0
WTI: Need a Breakout the STOP.DISCLAIMER : All labelling and wave counts done by me by manually and i will keep change according to the LIVE MARKET PRICE ACTION. So don't bias, hope on my trade plans...try to learn and make your own strategy...Following is not that much easy...I AM NOT RESPONSIBLE FOR ANY LOSSES IF U TOOK THE TRADE ACCORDING TO MY TRADE PLANS....THANKS LOT..CHEERS

Crude Oil Surges on Summer Demand and Trade OptimismOn the weekly chart, crude oil trades above the mid-range of a descending channel that has been in place since the 2022 highs. The RSI remains just below the neutral zone, suggesting a cautiously bullish-to-neutral outlook while prices hover near the $65 resistance level.
From a daily perspective, oil prices are breaking out above the $65 resistance, and a firm hold could pave the way toward $66 and potentially retest the $71 and $73 levels.
On the downside, the psychological support at $60 remains critical. A break below $60—and more critically, below the $58 moving average—could reintroduce long term bullish positioning from $55 and $49.
- Razan Hilal, CMT

Crude Oil Technical Analysis 🛢 Crude Oil Technical Analysis (Weekly Structure & 2H Chart Confirmation)
Chart Reference: Based on your 2H chart, crude has completed an A-B corrective structure and is likely entering the impulsive C leg, which typically unfolds in 5 waves (I, II, III, IV, V).
🔍 Elliott Wave Interpretation
Wave A: Likely the initial leg down — corrective but strong.
Wave B: Completed near the recent top ~66.5–67 zone (acts as resistance).
Wave C: Beginning now; a clear impulse structure (5-wave down expected).
🟣 Wave Count Breakdown on 2H Chart
Wave I: Likely completed near 64.5 — key level to confirm downside continuation.
Wave II: Minor retracement to ~66.5 (double top zone).
Wave III: Expected to be sharp and impulsive — projected towards 60 zone.
Wave IV: Small pullback/retrace near 57.5–58.5.
Wave V: Final push down — projected to 52–54 range.
🎯 Key Price Levels
Level Significance
66.5–67.0 Wave B high / Resistance Zone
64.5 Breakdown Confirmation (Wave I Low)
60.0 First Major Support / Wave III end
55.0 Likely Wave V Extension area
52.0 Potential C-Wave Completion Zone
🧠 Observations & Trade Notes
If 64.5 breaks, the C-leg is active and impulsive selling should follow.
RSI/Momentum indicators (not shown) should confirm bearish divergence or breakdown if this analysis holds.
Wave III is usually the longest; hence, fast drop expected after 64.5 breach.
Keep an eye on volume spikes and wide-body red candles post-64.5 for entry triggers.
📉 Short-Term Trading Strategy
Below 64.5: Initiate short with SL above 66.7
Target 1: 60.2
Target 2: 55.3
Target 3: 52.0
SL Trail: Once below 60, trail SL above 62.
🛑 Risk Considerations
A strong close above 67.2 invalidates the current wave count and may call for re-evaluation (possibly extended Wave B or triangle).
📌 Conclusion
Crude has likely entered a Wave C downtrend which is impulsive in nature. A clean break below 64.5 confirms that Wave III is active, and targets of 60–52 remain valid. The structure aligns with a larger time frame correction. Strong caution is advised above 67.
📢 Disclaimer:
This analysis is for educational and informational purposes only and should not be construed as investment or trading advice. Trading in commodities, stocks, futures, and options involves substantial risk of loss and is not suitable for every investor. Past performance is not indicative of future results. Always do your own research or consult with a qualified financial advisor before making any trading decisions. The author shall not be held responsible for any losses incurred from the use of this analysis.

USOIL:Go short before you go long
USOIL:Crude oil trend in line with expectations to break 65, hourly level to see adjustment, trading can be done first short and then long. Here are my range trading ideas.
Trading Strategy:
SELL@65.4-65.5
TP:64.5-64.
BUY@64.5-64
TP: 65.3-65.5
↓↓↓ More detailed strategies and trading will be notified here ↗↗↗
↓↓↓ Keep updated, come to "get" ↗↗↗

Crude oil rose as expected
💡Message Strategy
OPEC’s crude output increase in May was lower than required by the OPEC+ agreement, which had planned to increase production sharply last month.
The five OPEC members that pledged to cut production in the OPEC+ agreement and are now gradually lifting the cuts had to increase production by a combined 310,000 barrels per day, but according to data from oil flow tracking companies and surveys of sources at OPEC, oil companies and consultancies, they only increased production by 180,000 barrels per day.
This was because Iraq cut production to make up for a long period of overproduction, while Saudi Arabia and the UAE increased production by less than their target levels, the survey found.
Saudi Arabia had the largest increase in May compared to April. According to the survey, OPEC's largest producer and de facto leader, as well as the leader of the OPEC+ alliance, increased production by 130,000 barrels per day.
This is also one of the driving forces accelerating gold's rise
📊Technical aspects
WTI crude oil prices finally extended their upward momentum. However, crude oil prices have risen as tensions in the US-China trade war ease and global oil demand recovers from tariff-related pressures.
From the daily chart level, crude oil's medium-term trend is hovering around the moving average system, and the medium-term objective trend is mainly fluctuating and rising. Oil prices gradually rise to the upper edge of the range. From the perspective of momentum, the MACD indicator fast and slow lines cross the zero axis upward, and the bullish momentum begins to warm up. The K line closes with a small positive line continuously. If the oil price breaks through the range resistance in the later period, the medium-term trend is expected to further rise and test the 70 line
The short-term (2H) trend of crude oil continued to rise. The oil price encountered resistance near 65.40, and the K-line crossed the moving average system, and the short-term objective upward trend changed. The second large real negative line formed the main rhythm. It is expected that the crude oil trend will further fall to around 64.50 during the day, and then restart the upward momentum.
💰 Strategy Package
Long Position: 64.50-65.00,65.00-65.30

WTI Crude Oil INTRADAY Bullish breakout supported at 6380Trend Overview:
WTI Crude Oil remains in a bullish trend, characterised by higher highs and higher lows. The recent intraday price action is forming a continuation consolidation pattern, suggesting a potential pause before a renewed move higher.
Key Technical Levels:
Support: 6380 (primary pivot), followed by 6320 and 6250
Resistance: 6650 (initial), then 6740 and 6830
Technical Outlook:
A pullback to the 6380 level, which aligns with the previous consolidation zone, could act as a platform for renewed buying interest. A confirmed bounce from this support may trigger a continuation toward the next resistance levels at 6650, 6740, and ultimately 6830.
Conversely, a daily close below 6380 would suggest weakening bullish momentum. This scenario would shift the bias to bearish in the short term, potentially targeting 6320 and 6250 as downside levels.
Conclusion:
WTI Crude Oil maintains a bullish structure while trading above the 6380 support. A bounce from this level would validate the consolidation as a continuation pattern, with upside potential toward the 6650 area. A breakdown below 6380, however, would invalidate this view and suggest deeper corrective risk.
This communication is for informational purposes only and should not be viewed as any form of recommendation as to a particular course of action or as investment advice. It is not intended as an offer or solicitation for the purchase or sale of any financial instrument or as an official confirmation of any transaction. Opinions, estimates and assumptions expressed herein are made as of the date of this communication and are subject to change without notice. This communication has been prepared based upon information, including market prices, data and other information, believed to be reliable; however, Trade Nation does not warrant its completeness or accuracy. All market prices and market data contained in or attached to this communication are indicative and subject to change without notice.

WTI on high time frame , price reach 60$?
"Hello friends, focusing on WTI, the price is currently in a bullish trend on the daily time frame. During the last NY session, the price swept liquidity in the $66 zone and faced a strong rejection. Considering both technical analysis and fundamental news, I believe the price is gearing up for a decline, with the initial target likely around $60."
If you need further clarification or have more details to discuss, feel free to share!

Will Oil Prices Face Downward Pressure After EIA's Forecast?Macro approach:
- The EIA’s latest short-term outlook projects weaker oil prices as rising global inventories weigh on the market. Sluggish demand growth and increased production are expected to push output above consumption, building stockpiles and adding pressure on prices.
- Traders are also monitoring the ongoing US-China trade talks in London. Sentiment remains cautiously optimistic after US Commerce Secretary Lutnick described the negotiations as progressing well.
- On the supply side, Saudi Aramco has reduced its Jul oil shipments to China by 1 million barrels compared to Jun, suggesting that the recent OPEC+ production hike may not translate into substantial new supply.
Technical approach:
- USOIL retested both the descending trendline and resistance near 64.50 before pulling back. The price remains above both EMAs, signaling that bullish momentum is still intact.
- A breakout above 64.50 and the descending trendline could open the door to 68.00–70.00.
- However, failure to clear this resistance may lead to a retreat toward the 60.00 support level.
Analysis by: Dat Tong, Senior Financial Markets Strategist at Exness

Bullish momentum to extend?WTI/Oil (XTI/USD) is falling towards the pivot which is a pullback support and could bounce to the 1st resistance.
Pivot: 63.32
1st Support: 61.18
1st Resistance: 65.80
Risk Warning:
Trading Forex and CFDs carries a high level of risk to your capital and you should only trade with money you can afford to lose. Trading Forex and CFDs may not be suitable for all investors, so please ensure that you fully understand the risks involved and seek independent advice if necessary.
Disclaimer:
The above opinions given constitute general market commentary, and do not constitute the opinion or advice of IC Markets or any form of personal or investment advice.
Any opinions, news, research, analyses, prices, other information, or links to third-party sites contained on this website are provided on an "as-is" basis, are intended only to be informative, is not an advice nor a recommendation, nor research, or a record of our trading prices, or an offer of, or solicitation for a transaction in any financial instrument and thus should not be treated as such. The information provided does not involve any specific investment objectives, financial situation and needs of any specific person who may receive it. Please be aware, that past performance is not a reliable indicator of future performance and/or results. Past Performance or Forward-looking scenarios based upon the reasonable beliefs of the third-party provider are not a guarantee of future performance. Actual results may differ materially from those anticipated in forward-looking or past performance statements. IC Markets makes no representation or warranty and assumes no liability as to the accuracy or completeness of the information provided, nor any loss arising from any investment based on a recommendation, forecast or any information supplied by any third-party.


WTI Cash Bearish Divergence BearishU.S. Iran tensions, U.S. China Talks, U.S. Production capacity down,Inflation high
Techincally: Volume surges, Divergence,
Targets: See the chart.
Entries: 3 approches(red Boxes)
I am short. I stay short. At current level (above 64 risk of being bullish is higher than being short).
Mange risk tightly.

Crude Oil Surges StronglyAs market participants await positive outcomes from negotiations between a major Asian economy and the U.S., crude oil prices edge higher modestly. During Tuesday's Asian session, Brent crude oil futures rose by $0.12 to $67.16 per barrel, while U.S. WTI crude oil gained $0.13 to $65.42, briefly hitting a new high since April 4th intraday. In the previous trading day, Brent surged to $67.19, the highest level since April 28th, primarily driven by market expectations of a potential deal between the U.S. and China.
Current oil prices stand at a crossroads of multiple factors. In the short term, the global trade landscape dictates the main thread of market sentiment. If a mitigation plan is reached, it will boost demand expectations. However, the resumption of Iranian exports and OPEC's production increase strategy may lead to a potential supply glut in the second half of the year, emerging as the primary risk suppressing oil prices.
Technically, the K-line has pierced below the moving average system, indicating a shift in the short-term objective upward trend. The formation of a large-bodied bearish candle in the subsequent session establishes the main rhythm, suggesting that oil prices may further decline to around $63.50 today before seeking new support.
Overall, today's trading strategy for crude oil is recommended to focus on rebound shorting as the primary approach and pullback long positions as a supplement. In the short term, monitor resistance at the $67.5-68.0 range, while support lies at the $65.0-64.5 level.
Humans need to breathe, and perfect trading is like breathing—maintaining flexibility without needing to trade every market swing. The secret to profitable trading lies in implementing simple rules: repeating simple tasks consistently and enforcing them strictly over the long term.

USOIL BEST PLACE TO SELL FROM|SHORT
USOIL SIGNAL
Trade Direction: short
Entry Level: 65.62
Target Level: 62.64
Stop Loss: 67.59
RISK PROFILE
Risk level: medium
Suggested risk: 1%
Timeframe: 9h
Disclosure: I am part of Trade Nation's Influencer program and receive a monthly fee for using their TradingView charts in my analysis.
✅LIKE AND COMMENT MY IDEAS✅

CRUDE OIL (WTI): Detailed Support & Resistance Analysis
Here is my latest structure analysis for WTI Oil.
Resistance 1: 63.6 - 65.9 area
Resistance 2: 68.2 - 69.2 area
Resistance 3: 71.4 - 75.2 area
Support 1: 61.8 - 62.8 area
Support 2: 59.0 - 60.8 area
Support 3: 55.1 - 57.2 area
Consider these structures for pullback/breakout trading.
❤️Please, support my work with like, thank you!❤️

USOIL Trade Setup: Watching for a Bullish Break After Pullback 📈 US OIL Trade Plan
Currently, USOIL is in a strong bullish trend 🔥 — price action has pushed into overextended territory, which opens the door for a potential pullback 🌀.
I'm watching for a WTI retracement into equilibrium, ideally aligning with the 50%–61.8% Fibonacci levels from the previous swing low to high 🔍📉. If price corrects into that zone and we find support, followed by a bullish break in market structure 💥 — that would be the confirmation I’m waiting for to consider a long position 🚀.
⚠️ Key Level to Watch: That structure break is the trigger — no confirmation, no trade 🧠.
⚠️ Disclaimer:
This content is for educational and informational purposes only and should not be considered financial advice. Always conduct your own analysis and consult a professional before making trading decisions. Trade responsibly.

Hellena | Oil (4H): SHORT to support area of 58.00.Colleagues, the previous forecast did not meet expectations for too long, and the price has been in a prolonged sideways movement.
In this regard, I decided to slightly revise the waves and make a new forecast.
At the moment, I believe that the price will resume its downward movement in the medium-term wave “3.” The complex configuration of the correction makes it difficult to fully understand whether it is a combined correction or a five-wave movement.
In either case, I expect the price to reach the support area of 58.00.
Manage your capital correctly and competently! Only enter trades based on reliable patterns!

Crude oil prices test 10-week highs amid trade optimism!Crude oil prices are testing fresh 10-week highs today, with WTI futures flirting with the key resistance level at $65.50, a price not seen since the onset of trade tariff tensions in early April.
Investor sentiment remains cautiously optimistic as US-China trade talks continue in London this week, raising hopes that both parties can make progress toward a resolution on tariffs and trade restrictions. A positive outcome could further boost crude oil prices.
Seasonal factors are also playing a supportive role. The onset of the summer travel season in the northern hemisphere is expected to drive increased demand for crude, adding a bullish layer to the outlook. Energy traders are closely watching for signs that a successful trade agreement could trigger a sustained rally.
From a technical perspective, WTI bids have peaked near $65.50, although further upside appears constrained by the 200-day EMA, which is acting as a firm resistance level. However, a potential inverse head and shoulders pattern is forming, which could support a breakout and add further confidence to bullish positions.
On the downside, failure to breach the $65.50 resistance may invite selling pressure, with a potential re-test of the $60.00 support level if momentum weakens.

The trend after the surge in crude oil prices
💡Message Strategy
Core economic data and event-driven
The US employment report boosted expectations of rate cuts. According to the US Department of Labor, the unemployment rate stabilized at 4.2% in May, and 139,000 new non-farm jobs were added (the previous value was revised down). Phil Flynn, senior analyst at Price Futures Group, pointed out: "The employment data is 'just right', neither too hot nor too cold, but it strengthens the possibility of the Fed's rate cut." The expectation of a rate cut is seen as a potential positive for the crude oil market, as loose policies may stimulate economic recovery and boost oil demand.
OPEC+ moderately increased production to balance market expectations. OPEC+ reached an agreement on Saturday to increase production by 411,000 barrels per day in July, which is lower than Saudi Arabia's proposal, but in line with market expectations. HSBC analysts believe: "Summer oil demand will peak in July-August, matching the increase in OPEC+ supply, and the market supply and demand will tend to balance in the second and third quarters." The decision did not suppress oil prices, but instead eased concerns about oversupply.
📊Technical aspects
WTI crude oil: closed at $64.73 per barrel on Friday, up 2.21% on the day and 6.55% this week. It is about to reach our strategic target of 65.00. When everyone is looking at the decline of crude oil, our strategy is firmly on the rise, and the result is consistent with our direction.
From a technical perspective, the daily chart of US crude oil (WTI) shows that the price is running in a short-term rising channel, with support at around $63, while the upper resistance is concentrated in the $64.50 area. In recent trading days, WTI has received support at the 60-day moving average and successfully broke through the 20-day moving average, indicating that the short-term bullish momentum is gradually increasing.
At the same time, the MACD indicator shows a golden cross signal, and the momentum column continues to expand, indicating that the price is expected to further test the $65 mark. If the resistance level can be effectively broken, the next target may be $67.
💰 Strategy Package
Long Position: 63.50-64.00

WTI CRUDE OIL: Channel Down needing to fill its top. Bullish.WTI Crude Oil turned bullish on its 1D technical outlook (RSI = 62.137, MACD = 0.740, ADX = 26.844), having completed a very strong 1W candle last week. This is the continuation of the May 5th bottom rebound. All prior such rebounds have filled at least the 1W MA50, having touched the 0.618 Fibonacci retracement level. The 1W RSI LH trendline gives a good sense of where to sell, but since the 0.618 Fib is the guide, the target is TP = 71.15.
## If you like our free content follow our profile to get more daily ideas. ##
## Comments and likes are greatly appreciated. ##
