Crude oil is entering the seasonal growth windowCrude oil had tested the lower band of the Bollinger Bands indicator on the daily chart. Being a momentum instrument, it has a chance of testing the area below the previous intermediate-term low (testing 52-55k area), after which the price may turn back to $60: the fair price according to the STEO forecast from eia.gov
As WTI oil is entering the seasonal window of growth, so we can assume the mean-reversion scenario to dominate in the near future, especially considering the improving market sentiment.
Don't forget - this is just the idea, always do your own research and never forget to manage your risk!
USOIL trade ideas

WTI TRADE UPDATEhi all
Based on the current situation for WTI, with the stop loss hit from the previous trade idea, Plan A now relies on a breakout of the trendline and the support turning into resistance as confirmation for taking a long position.
However, if rejection occurs at the trendline or at the support-turned-resistance level, there's a possibility that the price will decline again, given that a breakout has already happened on the daily timeframe. Therefore, closely monitoring price movements around these key levels is crucial before making any trading decisions.
Ensure strong confirmation before acting, and keep an eye on shifts in market structure. Feel free to share any new updates, and best of luck with your strategy!
good luck all
**My trading strategy is not intended to be a signal. It's a process of learning about market structure and sharpening my trading my skills also for my trade journal**
Thanks a lot for your support

Price OIL will continue falling ?!According to Global Channel
According to minor channel
According to Flag Pattern
According to CCI under zero
According to Breakout Support Level @ 66 USD.

Double bottom pattern for USOILFirst tp 70$
Second tp 80$
Oil in it ways make a beautiful pattern
I see DB pattern
For target you see two hidden gap

WTI Oil H4 | Pullback resistance at 50% Fibonacci retracementWTI oil (USOIL) is rising towards a pullback resistance and could potentially reverse off this level to drop lower.
Sell entry is at 60.49 which is a pullback resistance that aligns with the 50.0% Fibonacci retracement.
Stop loss is at 62.30 which is a level that sits above the 61.8% Fibonacci retracement and an overlap resistance.
Take profit is at 56.68 which is a multi-swing-low support.
High Risk Investment Warning
Trading Forex/CFDs on margin carries a high level of risk and may not be suitable for all investors. Leverage can work against you.
Stratos Markets Limited (tradu.com):
CFDs are complex instruments and come with a high risk of losing money rapidly due to leverage. 63% of retail investor accounts lose money when trading CFDs with this provider. You should consider whether you understand how CFDs work and whether you can afford to take the high risk of losing your money.
Stratos Europe Ltd (tradu.com):
CFDs are complex instruments and come with a high risk of losing money rapidly due to leverage. 63% of retail investor accounts lose money when trading CFDs with this provider. You should consider whether you understand how CFDs work and whether you can afford to take the high risk of losing your money.
Stratos Global LLC (tradu.com):
Losses can exceed deposits.
Please be advised that the information presented on TradingView is provided to Tradu (‘Company’, ‘we’) by a third-party provider (‘TFA Global Pte Ltd’). Please be reminded that you are solely responsible for the trading decisions on your account. There is a very high degree of risk involved in trading. Any information and/or content is intended entirely for research, educational and informational purposes only and does not constitute investment or consultation advice or investment strategy. The information is not tailored to the investment needs of any specific person and therefore does not involve a consideration of any of the investment objectives, financial situation or needs of any viewer that may receive it. Kindly also note that past performance is not a reliable indicator of future results. Actual results may differ materially from those anticipated in forward-looking or past performance statements. We assume no liability as to the accuracy or completeness of any of the information and/or content provided herein and the Company cannot be held responsible for any omission, mistake nor for any loss or damage including without limitation to any loss of profit which may arise from reliance on any information supplied by TFA Global Pte Ltd.
The speaker(s) is neither an employee, agent nor representative of Tradu and is therefore acting independently. The opinions given are their own, constitute general market commentary, and do not constitute the opinion or advice of Tradu or any form of personal or investment advice. Tradu neither endorses nor guarantees offerings of third-party speakers, nor is Tradu responsible for the content, veracity or opinions of third-party speakers, presenters or participants.

WTI is due for a pullbackWTI has been falling for the entire week now. A hammer has formed on the hourly candle just right above a support. We expect pullbacks. TPs are as followed and SL is located at the support below.
Please do not risk more than 1% per trade。
If you like the idea, please help like the post and comment down your thoughts below! I would love to hear your thoughts!

Trend is Your friend Took 2 years to understand the above . I kept thinking I knew when the reversals happen and lost over 200k in the process. Still love to trade and one day it will come back even that I know 2 things will make your successful in this game
1 # most important RISK MANAGEMENT
2 # Trend is your friend stick to higer timeframes stop the 1 and 5min charts
3 # Fibonacci is king
4 # trendines and S/R Matter wait for retest
5 # chart patterns is a must for reversal wait for W OR M then Fibonacci it
Anyhow you get told all these things as a newbie but takes time to get it through your thick skull not saying I have mastered it .
Lastly to all newbies stay away from NATGAS she will either make you or most likely destroy. Forget indicators !
Anyhow else love to trade like me

Shorting XTIUSD Took me 2 years to actually understand trend is your friend and Fib don't lie
Clear short

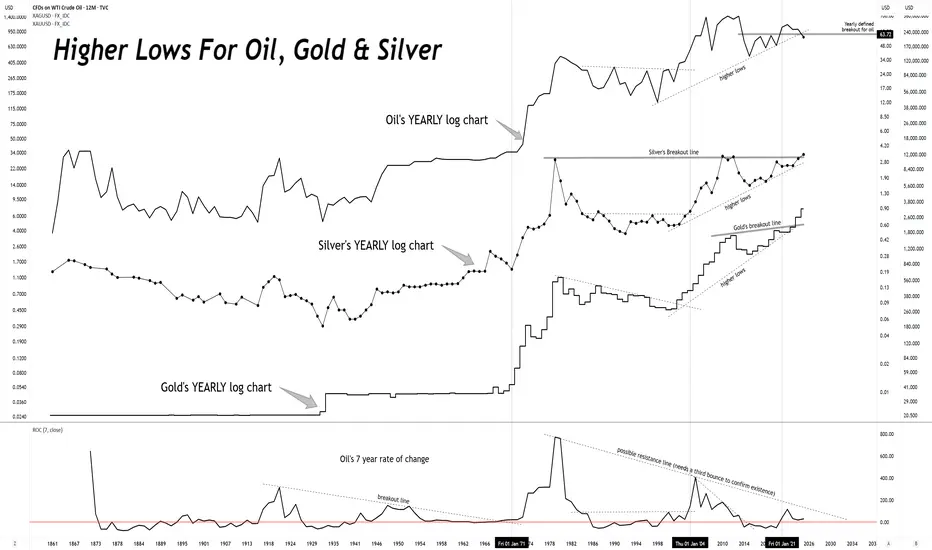
What do silver and oil have in common? Price.Since 1861, silver and crude oil charts have trended together rather well.
So, if you think there is a "cartel" which manipulates the silver, there must also be manipulating crude oil.
Or, the more logical explanation is that capital flows are carving out these price charts.

Crude oil and silver ultimately go where gold goes.Crude oil and silver ultimately go where gold goes.
Oil's YEARLY log chart
Silver's YEARLY log chart
Gold's YEARLY log chart
USOIL – Buyers Might Be Waking UpFrom last week, USOIL dropped aggressively from the 65.27 resistance zone and hit our 57.00 support target — a level we’ve been watching closely.
Now here’s where it gets interesting…
Current Observation:
The 57.00 support seems to be holding strong.
We’re starting to see signs that sellers might be losing momentum around this zone.
Price has reacted with a bounce, and if it sustains above 57.00, we could see the buyers step back in.
What I'm Watching:
– A confirmed hold above 57.00 could offer a buy opportunity, targeting to see a break above 59.5 first, then possibly 61.8 – 62.0.
– However, if 57.00 breaks, I’ll be shifting bias back to the downside, watching 55.10 next.
Key Levels:
– Support: 57.00 → 55.10
– Resistance: 59.5 → 62.0 → 65.27
At this point, it's all about how price reacts around 57.00 and 59.50.
A bounce and strong close above? I’ll be looking to go long.
Failure to hold? The sell pressure might continue.
Let’s see how this plays out. Trade safe.

USOIL CAUTION! BREAK - TEST - GO!This is my new updated chart of Oil.
Trump's "Drill baby Drill" interfering with the free market is the absolute worst thing he could do. His ridiculous tariffs will put us in an economic depression!
Oil prices are driven by demand! As I have mentioned here on TV so many times before! Increasing supply while heading into a recession is the dumbest thing possible! You never want to consume your own oil when you can consume others first! Simultaneously, F your own nation's oil company's profit margins and gov tax revenue!
This is why we shouldn't put toddlers as POTUS!
Anyway!!! This is a break test go! setup!
If you haven't seen it before, here is an example I recently posted with AAPL.
Click Boost, follow, subscribe! Let's get to 5,000 followers so I can help them navigate these crazy markets too. ))

USOIL trading alerts. Pressure and support.Oil also fell according to instructions. I just forgot to remind you. Sorry, but the profit is quite good. Sell short from 58.7. Then the lowest reached 56.34
But today in the New York market, USOIL rose again above 58. From a fundamental perspective. The market will continue to fall under pressure. But from the trend, we need to pay attention to the support of 58. If it does not fall today, it is likely to continue to fall based on Friday's trend. The pressure level near 59 needs to be paid attention to. In terms of operation, it is still mainly selling at high levels.
Always remind trading risks. So don't ignore this. If you don't know how to trade. Remember to wait and see. Don't trade blindly or gamble.
Many investor friends know that I have led some investors to create good profits for several consecutive days. If you don't know how to trade, remember to leave me a message and try it. Maybe your profit will double.

Can oil prices continue to be shorted? Of courseSaudi Arabia made a major strategic shift, willing to accept low oil prices and unwilling to cut supply.
Oil prices fell sharply as a result.
It is expected that oil prices will hit 55-56 in the short term, so the operation is still mainly shorting oil prices. Overcapacity.

USOIL SELL OPPORTUNITY Price is on a shorterm downtrend in M15. We recently had a pullback which is a good opportunity for shorting. A sell opportunity is envisaged from the current market price

OIL: Very bearish Monthly closeOIL ST/MT Outlook: Sell
From FA perspective, Oil is in downtrend:
1- Worldwide recession is/will create a lower demand for oil.
2- Risk: Agreements between Iran-USA and Ukraine-Russia will fade out any risk related.
From TA perspective:
1- Monthly close is a strong bearish. A continuation down is expected.
2- Next major stop is around $40.

USOIL BEARISH BIAS RIGHT NOW| SHORT
USOIL SIGNAL
Trade Direction: short
Entry Level: 63.13
Target Level: 61.78
Stop Loss: 64.03
RISK PROFILE
Risk level: medium
Suggested risk: 1%
Timeframe: 1h
Disclosure: I am part of Trade Nation's Influencer program and receive a monthly fee for using their TradingView charts in my analysis.
✅LIKE AND COMMENT MY IDEAS✅


us oil (1w)repeating of structres...
as previous...
its supply is going to over right now... and it may a hard pulll back at this leve...

Oil is Doomed: Time to SELL (Part 1/3)A Perfect Storm for Oil Has Begun
The start of April triggered a brutal selloff in oil, and it's only the beginning. Here’s why:
🛑 Global Trade Wars
On April 2nd, Trump launched a full-scale trade war. New tariffs could reach 23% — the highest in a century. China, the world’s largest oil importer, now faces 145% tariffs. Global trade slowdown = weaker demand for oil. Result? Oil dropped 10% in just 2 days — one of the worst drops in history.
📉 US at Risk Too
Goldman Sachs raised recession odds from 15% to 35%. Atlanta FED sees weakening GDP. The whole world slows down — and so does oil demand.
🛢️ OPEC Surprise Output Hike
OPEC+ has started increasing output — over 2.2 million barrels per day in 2025. The April hike alone was supposed to be 138,000 bpd, but turned out to be 411,000 bpd — triple the forecast. This is a MAJOR bearish shock to the market.
Flashback: Spring 2020 — OPEC raised output during an economic crisis. Oil dropped 65% .

USOIL... 1D CHART PATTERNHere's my USOIL (WTI Crude) trade setup.
- *Trade Type:* Sell
- *Entry Price:* 57.74
- *Stop Loss (SL):* 65.54
- *Take Profit (TP):* 51.40
*Quick Risk/Reward Analysis:*
- *Risk:* 65.54 - 57.74 = *7.80*
- *Reward:* 57.74 - 51.40 = *6.34*
- *Risk/Reward Ratio:* 6.34 / 7.80 ≈ *0.81*
*Comment:*
This setup has a risk greater than the potential reward, which is not ideal. A better trade usually has a risk/reward ratio of at least 1:1, preferably 1:2 or more. You might consider adjusting your TP or SL, or confirming the direction with technical/fundamental analysis.

Shorting the USOIL Looking at the longer trajectory of the Oil chart, I am not too bullish and optimistic about its future.
Weekly chart reveals it is still trending down in the channel with mid Jan this year giving the bulls a false hope only to falls further south. I expect the price to slightly moves up to the resistance level (OR higher to create a bull trap) at 66.08 before it comes down again. My profit target is around 51.54.
The risk/reward ratio looks good to me. Always have a STOP LOSS no matter how confident you think you are in your charting. IT is still based on probability from historical patterns and it may or may not repeats itself........Nothing is 100% certain in today's volatile market.
Please DYODD

USOIL – Key Levels in Play. Here's What I'm WatchingAfter rejecting the 65.27 resistance, USOIL sold off sharply, dropping to the 59.5 support zone — just as anticipated.
This confirms that the market is still respecting key support and resistance levels and trend lines.
Current Scenario:
Price is sitting around 59.5. If this support holds, we could see a corrective move (buy) back to the 62 region. But that zone is now a strong area of interest — previously a broken support, now likely to act as resistance.
Here’s my game plan:
– If price pulls back to 62 and fails to break above, I’ll be watching for a sell setup targeting the 57 or even 55 area.
– If price breaks and holds above 62 with momentum, then I’ll re-evaluate for possible upside continuation.
– Right now, a short-term buy from 59.5 to 62 is valid, but it's riskier. The safer bias remains to the downside until 62 is broken cleanly.
So, while buyers might attempt something from current levels, the dominant trend and structure still favor the sellers — especially below 62.
