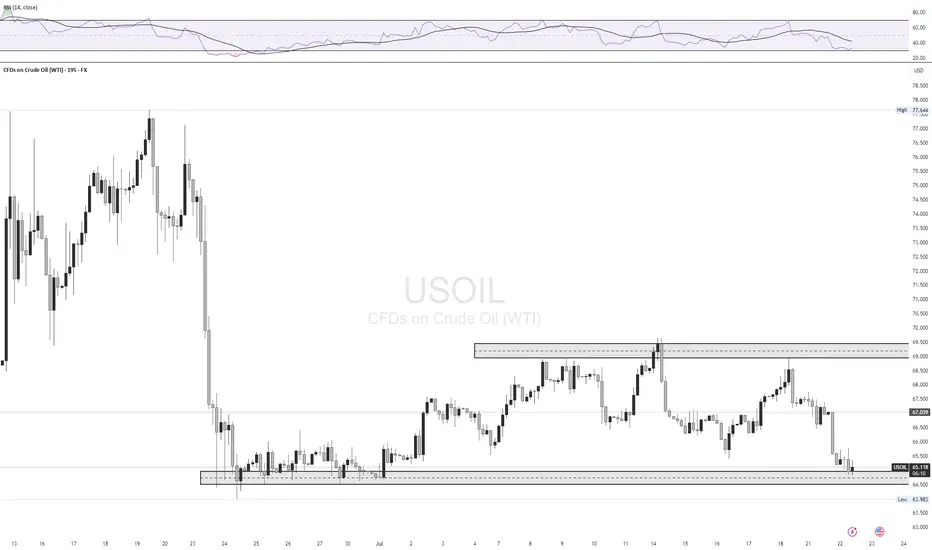
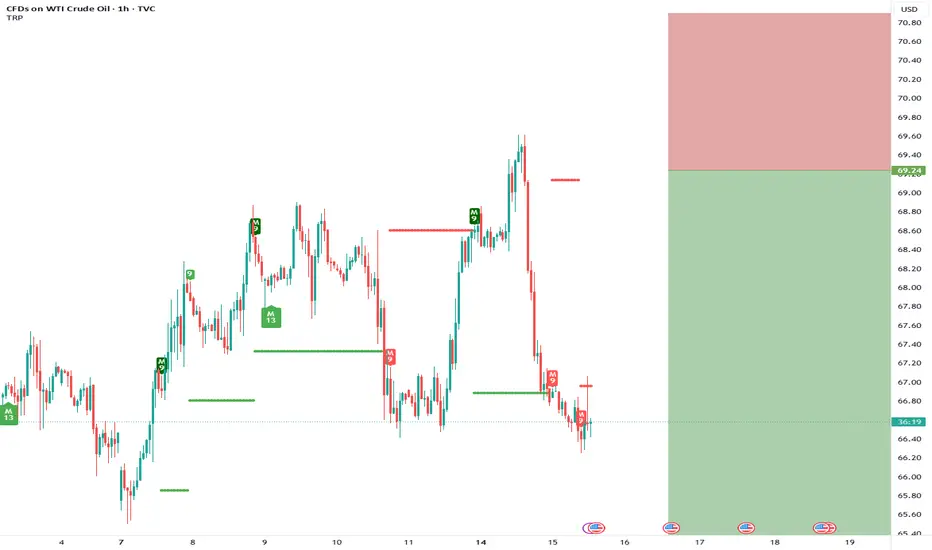
USOIL-LONG--severel times attemted to break the green channel's bottom side and failed
--price seems to go higher and push the upper side of green channel
-
USOIL trade ideas

SELL PLAN – XTIUSD (15M)📉 SELL PLAN – XTIUSD (15M)
🗓️ Date: 23 July 2025
⏱️ Timeframe: 15-Minute
🔍 Context & Reasoning:
HTF Supply Zone (Red Zone)
Price entered the red HTF zone (noted as “4H T2,3,4”) and showed rejection.
This zone aligns with potential 4H Fair Value Gaps / Supply.
Sweep & Rejection
Liquidity sweep above previous highs followed by immediate bearish reaction.
Entry Confirmation
Bearish engulfing candle formed inside the HTF zone.
Price closed below 15M EMA (blue line) showing bearish momentum.
Dealing Range Valid
DR formed after rejection of the HTF zone.
Short-term bullish FVG created and violated.
Bearish FVG confirms continuation.
🎯 Entry Details:
Entry Price: ~66.12
Stop Loss: ~66.58 (Above HTF rejection zone)
Take Profit: ~65.12 (Near Weekly TP level)
🧠 Confluences:
Rejection from 4H Supply
Price closed below EMA
Clear swing failure / liquidity grab
DR confirmation on 15M
Multiple FVGs and breaker structure supporting the move
📌 Risk Management:
Risk-to-Reward: 1:2+
Risk per trade: Max 1%
If in drawdown: Use 0.5%

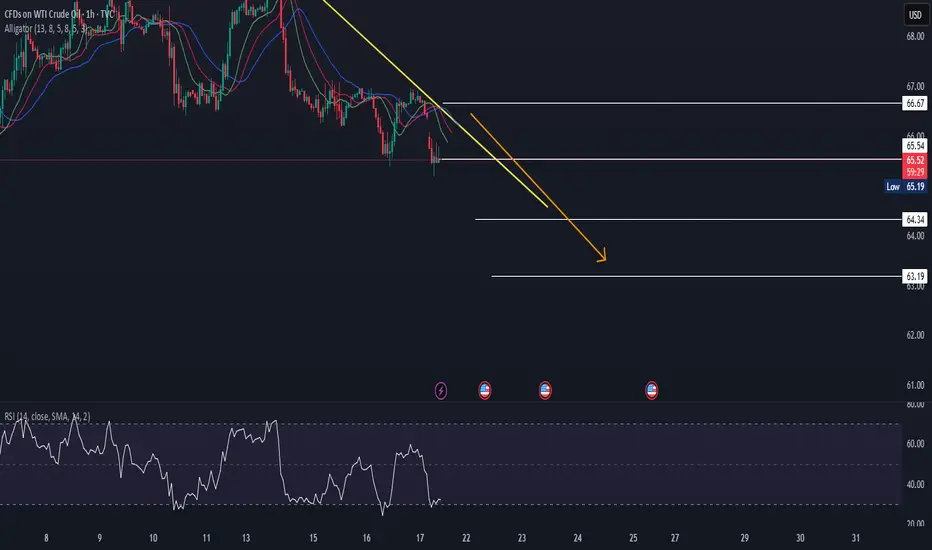
USOILUSOIL is in strongly bearish trend.
Potentially printing LH and LL.
No strong sign of reversal shown.
Alligator mouth is open which indicates trend will continue.
we sell at CMP.
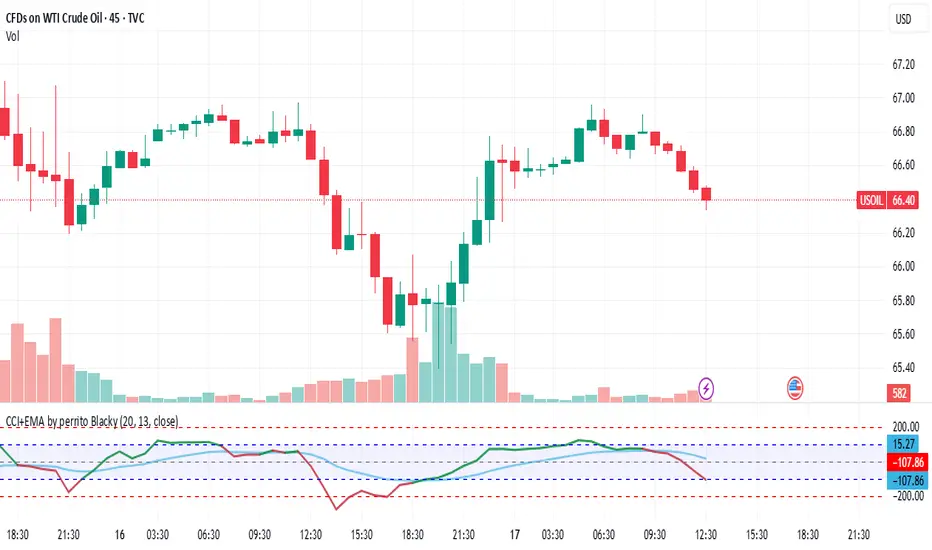
Oil Bulls Watch $67.0 for Breakout ConfirmationFenzoFx—Crude Oil trades slightly above the bullish FVG at $66.5, showing sideways momentum on the 1-hour chart. The $65.5 support is backed by volume interest and could drive prices higher.
If this level holds, bulls may target a retest of the descending trendline. For confirmation, a close above the $67.0 resistance is needed.
Please note that a close below $66.5 would invalidate the bullish outlook.

WILL CRUDE HOLD BEARISH TREND DURING FED CHAIR POWELL SPEECH?!!?CRUDE OIL
Looking for a BEARISH continuation, of last week's Friday Fall.
Take Profit near 2.00 Extension level (64.715)
Stop Loss above the previous Hourly high candlestick (66.103)

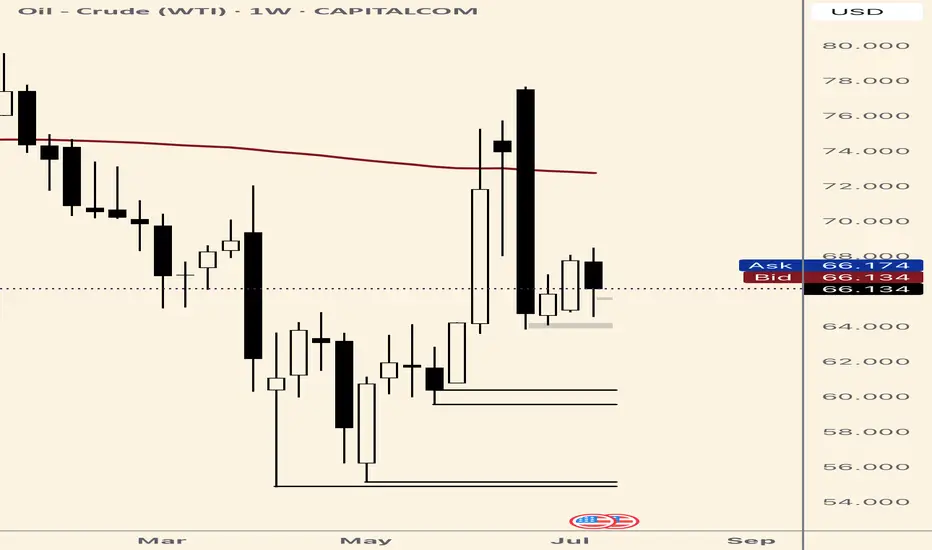
Crude Oil -DAILY- 21.07.2025Oil prices were steady after their first weekly decline this month, as attention shifted to U.S. trade negotiations and the European Union’s push to tighten restrictions on Russian energy exports. The EU is preparing new sanctions, including a lower price cap on Russian crude, limits on fuel refined from Russian oil, banking restrictions, and bans targeting an Indian refinery and Chinese firms. Despite western sanctions, Russian oil continues flowing to China and India. Meanwhile, diesel margins in Europe remain strong, signaling tight supply.
On the technical side, the price of crude oil has failed to break below the major technical support area, which consists of the 50-day simple moving average and the 50% of the weekly Fibonacci retracement level. The Stochastic oscillator has been in the neutral level since last week hinting that there is potential for the price to move to either direction in the near short term. On the other hand, the Bollinger bands have contracted rather massively showing that volatility has dried up therefore, the recent sideways movement might extend in the upcoming sessions.
Disclaimer: The opinions in this article are personal to the writer and do not reflect those of Exness

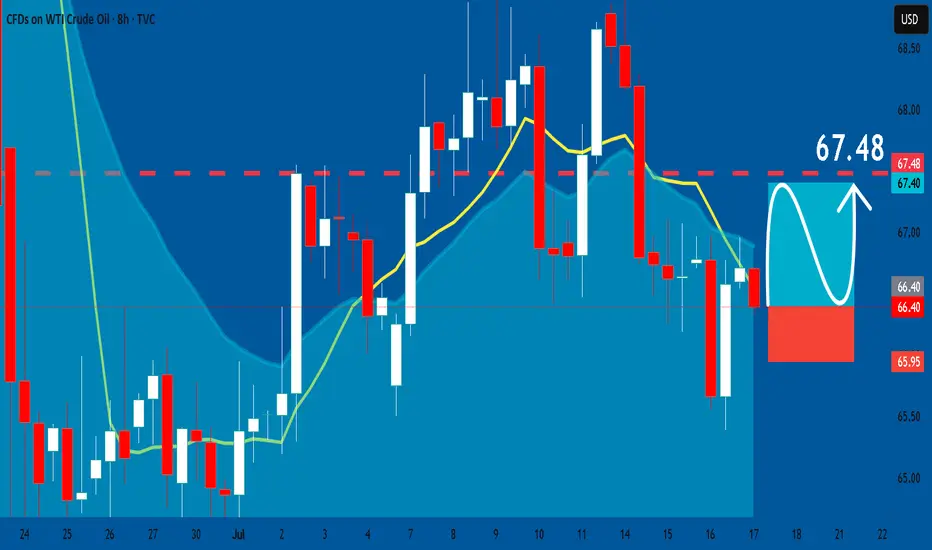
USOIL: Bullish Continuation & Long Trade
USOIL
- Classic bullish pattern
- Our team expects retracement
SUGGESTED TRADE:
Swing Trade
Buy USOIL
Entry - 66.40
Stop - 65.95
Take - 67.48
Our Risk - 1%
Start protection of your profits from lower levels
Disclosure: I am part of Trade Nation's Influencer program and receive a monthly fee for using their TradingView charts in my analysis.
❤️ Please, support our work with like & comment! ❤️
Crude fall - short termI am anticipating crude to fall these marked levels because:
1. Strong Opening Gap which usually closes after some time
2. Liquidity levels are at the same place as the Opening Gap.
3. Oil price has to fallback a bit more and consolidate a bit more to have a healthy patterns to rise until potential 90.
CRUDE OIL Bearish Flag Breakout 📉CRUDE OIL Bearish Flag Breakout!
⭕Sell!
__
#USOIL is trading in a local
Downtrend and formed a bearish
Flag pattern and now we are
Seeing a bearish breakout
So we are bearish biased
And we will be expecting
A further bearish move down
Sell!🔽
—

I’m short USOIL🛢️ USOIL is WTI Crude Oil, the oil that powers our world.
I’m short USOIL 📉
Too much oil is flooding the market while demand slows down.
Would you take this trade? 🤔
Crude oil rises slowly but falls quickly?
💡Message Strategy
International oil prices continued to climb on Monday, but the gains were limited. Brent crude futures rose 8 cents to $70.44 a barrel, continuing Friday's 2.51% rise. U.S. WTI crude rose 5 cents to $68.50, having surged 2.82% the previous trading day.
The main driving force behind this round of gains came from the market's expectation that the United States would further increase sanctions on Russia. U.S. President Trump said on Sunday that he would provide Ukraine with the Patriot air defense missile system and would make a "major statement" on the Russian issue on Monday.
The contradiction between supply and demand is also intensifying. According to market surveys, Brent crude oil rose by 3% last week and WTI rose by 2.2%. The International Energy Agency (IEA) pointed out that although the market supply and demand appear to be balanced on the surface, the actual global oil supply may be tighter than expected due to the summer refining peak and rising electricity demand.
📊Technical aspects
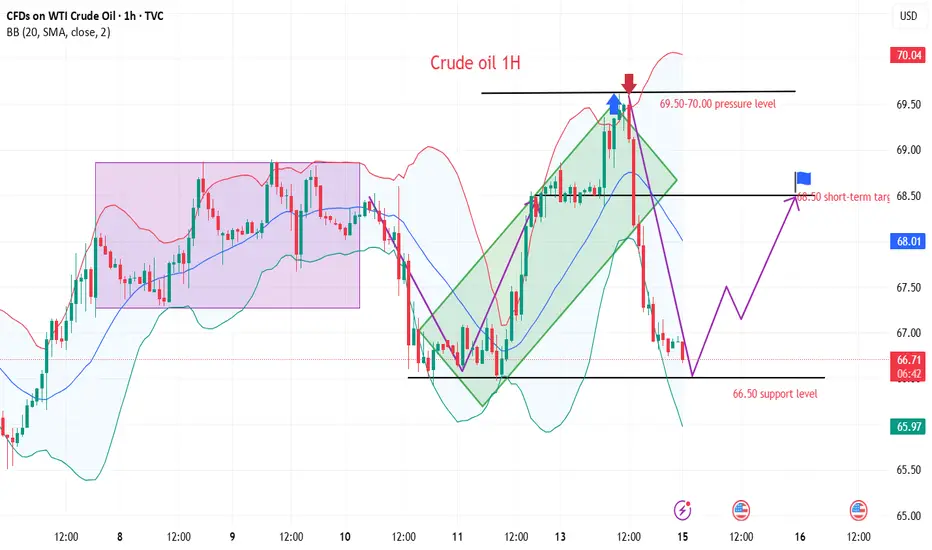
WTI crude oil continued its rebound from last week's low on the daily chart, and the current price is running at the downward support of $66.70, indicating that the short-term bullish power has increased. The MACD indicator shows a golden cross and initial volume, and the momentum column begins to turn positive, indicating that the price is expected to challenge the previous high area (69.50-70.20 US dollars).
The short-term (1H) trend of crude oil is highly repetitive, and the oil price is supported at the lower edge of the wide range and rises again. The short-term objective trend direction is upward within the range. The bullish momentum is sufficient.
💰Strategy Package
Long Position:65.50-66.50,SL:64.00,Target:69.00-70.00
WTIThe final big bear bar can be a potential exhaustion of sellers. It probably gonna have a smaller second leg, then rising up.

break above 6866.1 may push prices toward the second resistance break above 6866.1 may push prices toward the second resistance at 6911.3 (TP2).
Confirmation of bullish continuation would occur if price closes above 6981.0 on a 4H or daily chart.
Volume and momentum indicators should be monitored near 6866–6911 to assess breakout strength.
This trade setup offers a favorable risk-reward ratio with a tight SL at 6522 and layered targets.
Ideal buy entries can be placed between 6630–6660, as this range shows price stability and potential reversal signs.
Traders should stay alert for fundamental news (inventory reports, geopolitical events) that could accelerate momentum past resistance levels
is currently trading at 6648.3, positioning itself within an attractive short-term buy zone.
This level sits just above strong support at 6522, which acts as the logical stop-loss (SL) zone.
The price action suggests bullish potential as it forms a base near the support level.
Immediate resistance lies at 6866.1, which could be the first profit target (TP1).

Crude oil rebounds after a correction!International oil prices continued to climb on Monday, though the gains were limited. Brent crude futures rose 8 cents to $70.44 per barrel, extending Friday's 2.51% rally. U.S. WTI crude edged up 5 cents to $68.50 per barrel, after surging 2.82% in the previous trading session.
The primary driver behind the current upward move stems from market expectations of further escalation in U.S. sanctions against Russia. U.S. President Trump stated on Sunday that he would provide Ukraine with the "Patriot" air defense missile system and deliver a "major announcement" on Russia-related issues on Monday. "Trump is dissatisfied with the Russian President's failure to advance the peace process, a stance exacerbated by Russia's continued bombing of Ukrainian cities in recent days.
In the short term (1-hour timeframe), crude oil has shown high volatility, with prices finding support at the lower edge of the wide trading range and moving higher again. The objective short-term trend direction is upward within the range, with sufficient bullish momentum. However, given the high probability of recent erratic price swings, there is a greater likelihood that intraday crude oil prices will encounter resistance at the upper edge of the range and pull back.
you are currently struggling with losses,or are unsure which of the numerous trading strategies to follow,You have the option to join our VIP program. I will assist you and provide you with accurate trading signals, enabling you to navigate the financial markets with greater confidence and potentially achieve optimal trading results.
Crude oil awaits upward breakthrough
💡Message Strategy
Inventory data provides short-term support, but it is difficult to change the trend
Although oil prices are under pressure overall, inventory data released by the U.S. Energy Information Administration (EIA) show that as of last week, U.S. gasoline and distillate inventories have dropped significantly, while gasoline consumption has increased by 6% month-on-month to 9.2 million barrels per day, indicating that the summer driving peak has brought short-term positive factors.
In addition, global aviation demand has also become an important variable to boost market sentiment. JPMorgan Chase pointed out in a client report: "In the first eight days of July, the global daily number of flights reached an average of 107,600, a record high, among which aviation activities in Asian countries have recovered to the peak in nearly five months."
The bank also expects that the average daily global crude oil demand growth this year will be 970,000 barrels, which is basically consistent with its forecast of 1 million barrels at the beginning of the year, indicating that although the consumption end is under pressure, it has not yet experienced a cliff-like decline.
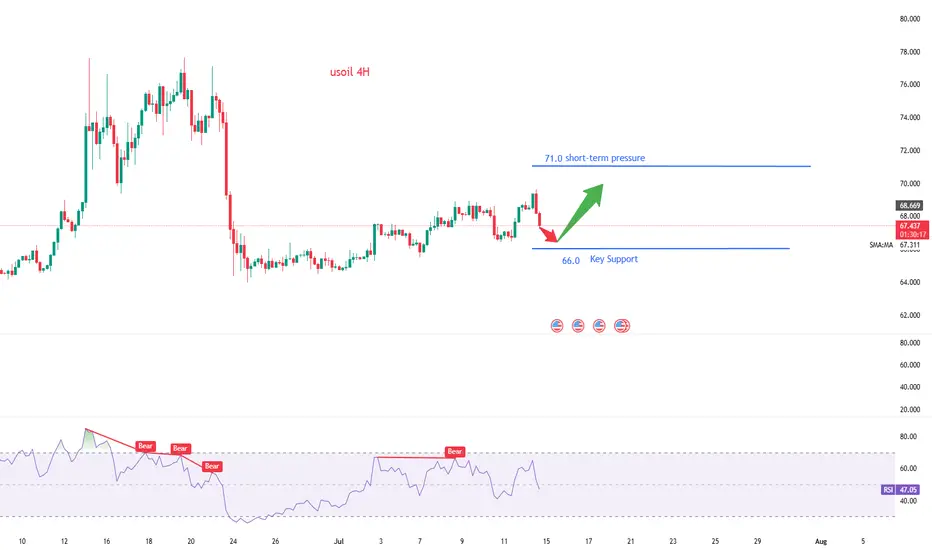
📊Technical aspects
The short-term (4H) trend of crude oil breaks through the upper resistance of the range and runs in an upward trend. The moving average system is arranged in a bullish pattern, and the short-term objective trend direction is upward. The MACD indicator opens upward above the zero axis, and the bullish momentum is sufficient. The oil price fluctuates in a narrow range, and it is expected that the crude oil will continue to rise.
In terms of operation, crude oil is mainly long at a low level. If it rises to the target point, the direction will be selected according to the pattern and continued attention will be paid.
💰Strategy Package
Long Position:65.50-66.50,SL:64.00,Target:69.00-70.00

WTI Oil – From Conflict to StrategyBack on April 24, I marked a short zone. On June 11, price broke above that level, giving a long opportunity — which I took.
Unfortunately, it coincided with the tragic military strike by Israel on Iran, pushing oil sharply higher. I’ve pinned that analysis.
Following the ceasefire, price dropped again — just a reminder that geopolitics can shake the charts.
As traders, we stay prepared to act, even while acknowledging the deep sadness of lives lost.
Now I wait for price to reach my marked level again. If I get a valid signal, I’ll short.
But if price breaks and holds above, I’ll buy the pullback — with no bias, just pure execution.
Risk-managed. Emotion-neutral. Opportunity-focused.

WTI Crude Oil Climbs Higher Amid Market OptimismMarket Analysis: WTI Crude Oil Climbs Higher Amid Market Optimism
WTI Crude Oil price climbed higher above $66.50 and might extend gains.
Important Takeaways for WTI Crude Oil Price Analysis Today
- WTI Crude Oil price started a decent increase above the $66.60 resistance levels.
- There was a break above a connecting bearish trend line with resistance at $67.15 on the hourly chart of XTI/USD at FXOpen.
Oil Price Technical Analysis
On the hourly chart of WTI Crude Oil at FXOpen, the price started a decent upward move from $65.50. The price gained bullish momentum after it broke the $66.50 resistance and the 50-hour simple moving average.
The bulls pushed the price above the $67.00 and $67.50 resistance levels. There was a break above a connecting bearish trend line with resistance at $67.15.
The recent high was formed at $67.63 and the price started a downside correction. There was a minor move toward the 23.6% Fib retracement level of the upward move from the $65.54 swing low to the $67.63 high.
The RSI is now above the 60 level. Immediate support on the downside is near the $67.15 zone. The next major support on the WTI Crude Oil chart is near the $66.60 zone or the 50% Fib retracement level, below which the price could test the $65.50 level. If there is a downside break, the price might decline toward $64.70. Any more losses may perhaps open the doors for a move toward the $63.50 support zone.
If the price climbs higher again, it could face resistance near $67.85. The next major resistance is near the $70.00 level. Any more gains might send the price toward the $72.50 level.
This article represents the opinion of the Companies operating under the FXOpen brand only. It is not to be construed as an offer, solicitation, or recommendation with respect to products and services provided by the Companies operating under the FXOpen brand, nor is it to be considered financial advice.

USOIL SELLERS WILL DOMINATE THE MARKET|SHORT
USOIL SIGNAL
Trade Direction: short
Entry Level: 69.08
Target Level: 62.06
Stop Loss: 73.74
RISK PROFILE
Risk level: medium
Suggested risk: 1%
Timeframe: 1D
Disclosure: I am part of Trade Nation's Influencer program and receive a monthly fee for using their TradingView charts in my analysis.
✅LIKE AND COMMENT MY IDEAS✅

WTI Crude Oil Analysis – 4-Hour TimeframeWTI Crude Oil Analysis – 4-Hour Timeframe
At the moment, the price is trading below a key resistance zone (marked in red), which has previously triggered multiple pullbacks. The current price behavior near this area reflects market hesitation to break through this level.
🔴 Bullish Scenario:
If the price manages to break above this resistance zone and holds above it, we can expect the upward movement to continue toward higher resistance levels. This move may unfold in a step-by-step trend, accompanied by intermediate pullbacks. The next resistance zones could act as potential targets for the bullish wave.
🔴 Bearish Scenario:
If the price reacts negatively to the current resistance area and fails to break through, a bearish correction may follow. In this case, the nearby short-term support levels could be the first targets for sellers. If those supports are also broken, the likelihood of a deeper decline and continuation of the downward trend increases.

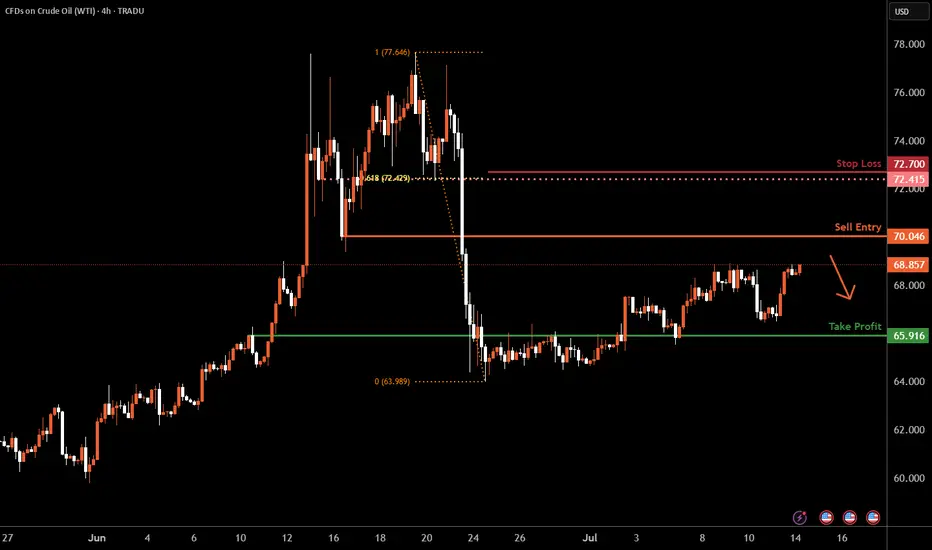
WTI Oil H4 | Rising into a pullback resistanceWTI oil (USOIL) is rising towards a pullback resistance and could potentially reverse off this level to drop lower.
Sell entry is at 70.04 which is a pullback resistance.
Stop loss is at 72.70 which is a level that sits above the 61.8% Fibonacci retracement and a pullback resistance.
Take profit is at 65.91 which is an overlap support.
High Risk Investment Warning
Trading Forex/CFDs on margin carries a high level of risk and may not be suitable for all investors. Leverage can work against you.
Stratos Markets Limited (tradu.com ):
CFDs are complex instruments and come with a high risk of losing money rapidly due to leverage. 63% of retail investor accounts lose money when trading CFDs with this provider. You should consider whether you understand how CFDs work and whether you can afford to take the high risk of losing your money.
Stratos Europe Ltd (tradu.com ):
CFDs are complex instruments and come with a high risk of losing money rapidly due to leverage. 63% of retail investor accounts lose money when trading CFDs with this provider. You should consider whether you understand how CFDs work and whether you can afford to take the high risk of losing your money.
Stratos Global LLC (tradu.com ):
Losses can exceed deposits.
Please be advised that the information presented on TradingView is provided to Tradu (‘Company’, ‘we’) by a third-party provider (‘TFA Global Pte Ltd’). Please be reminded that you are solely responsible for the trading decisions on your account. There is a very high degree of risk involved in trading. Any information and/or content is intended entirely for research, educational and informational purposes only and does not constitute investment or consultation advice or investment strategy. The information is not tailored to the investment needs of any specific person and therefore does not involve a consideration of any of the investment objectives, financial situation or needs of any viewer that may receive it. Kindly also note that past performance is not a reliable indicator of future results. Actual results may differ materially from those anticipated in forward-looking or past performance statements. We assume no liability as to the accuracy or completeness of any of the information and/or content provided herein and the Company cannot be held responsible for any omission, mistake nor for any loss or damage including without limitation to any loss of profit which may arise from reliance on any information supplied by TFA Global Pte Ltd.
The speaker(s) is neither an employee, agent nor representative of Tradu and is therefore acting independently. The opinions given are their own, constitute general market commentary, and do not constitute the opinion or advice of Tradu or any form of personal or investment advice. Tradu neither endorses nor guarantees offerings of third-party speakers, nor is Tradu responsible for the content, veracity or opinions of third-party speakers, presenters or participants.
Heading into 50% Fibonacci resitance?WTI Oil (XTI/USD) is rising towards the pivot and could reverse to the 1st support.
Pivot: 71.43
1st Support: 65.55
1st Resistance: 76.08
Risk Warning:
Trading Forex and CFDs carries a high level of risk to your capital and you should only trade with money you can afford to lose. Trading Forex and CFDs may not be suitable for all investors, so please ensure that you fully understand the risks involved and seek independent advice if necessary.
Disclaimer:
The above opinions given constitute general market commentary, and do not constitute the opinion or advice of IC Markets or any form of personal or investment advice.
Any opinions, news, research, analyses, prices, other information, or links to third-party sites contained on this website are provided on an "as-is" basis, are intended only to be informative, is not an advice nor a recommendation, nor research, or a record of our trading prices, or an offer of, or solicitation for a transaction in any financial instrument and thus should not be treated as such. The information provided does not involve any specific investment objectives, financial situation and needs of any specific person who may receive it. Please be aware, that past performance is not a reliable indicator of future performance and/or results. Past Performance or Forward-looking scenarios based upon the reasonable beliefs of the third-party provider are not a guarantee of future performance. Actual results may differ materially from those anticipated in forward-looking or past performance statements. IC Markets makes no representation or warranty and assumes no liability as to the accuracy or completeness of the information provided, nor any loss arising from any investment based on a recommendation, forecast or any information supplied by any third-party.
