Title: WTI Crude Oil 2H – Bearish Rejection Setup with Downside The updated chart maintains the bearish channel structure, with price continuing to respect lower highs and lower lows.
Current Price: $66.413
Bearish Outlook Maintained:
Price has recently tested the mid-range of the descending channel.
A minor bullish retracement is anticipated into the green

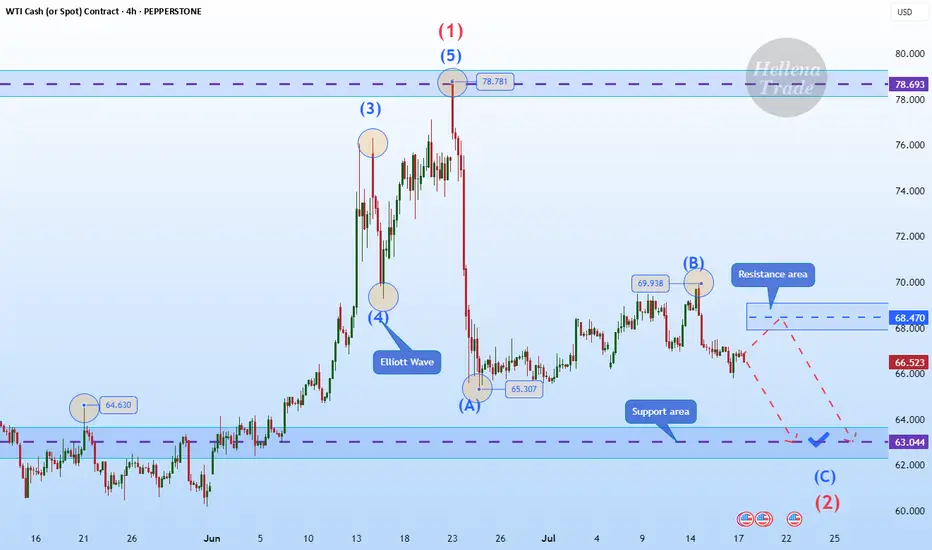
Hellena | Oil (4H): SHORT to support area of 63.000.Colleagues, I believe that wave “B” has formed at the level of 69.938, and now we expect the downward movement to continue with the aim of completing wave ‘C’ of the middle order and wave “2” of the higher order in the support area of 63,000.
It is quite possible that the price could reach the 60,0
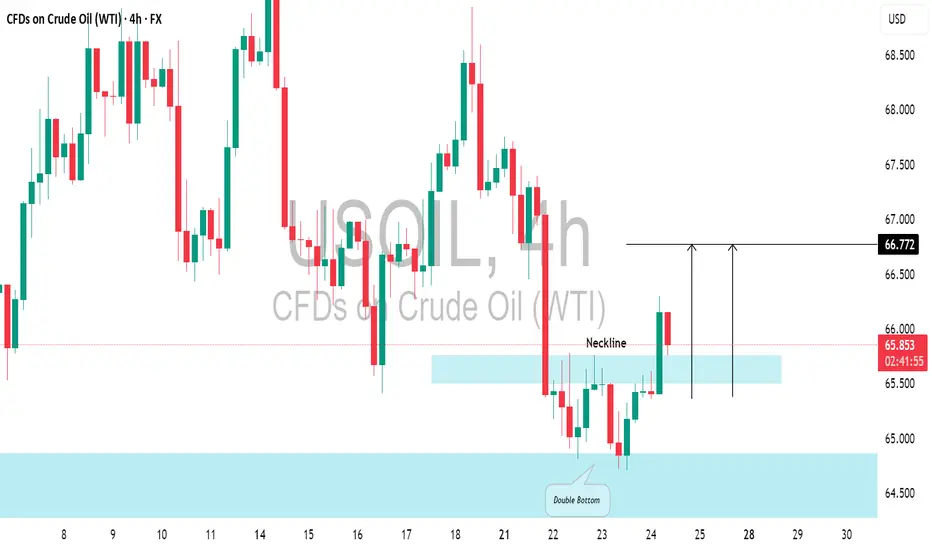
US CRUDE OIL (WTI): Pullback From Support📈USOIL responded well to the highlighted daily support level.
The price formed a double bottom pattern on that and broke above its neckline.
There's a strong likelihood that the price will continue to increase and reach 66.72 shortly.
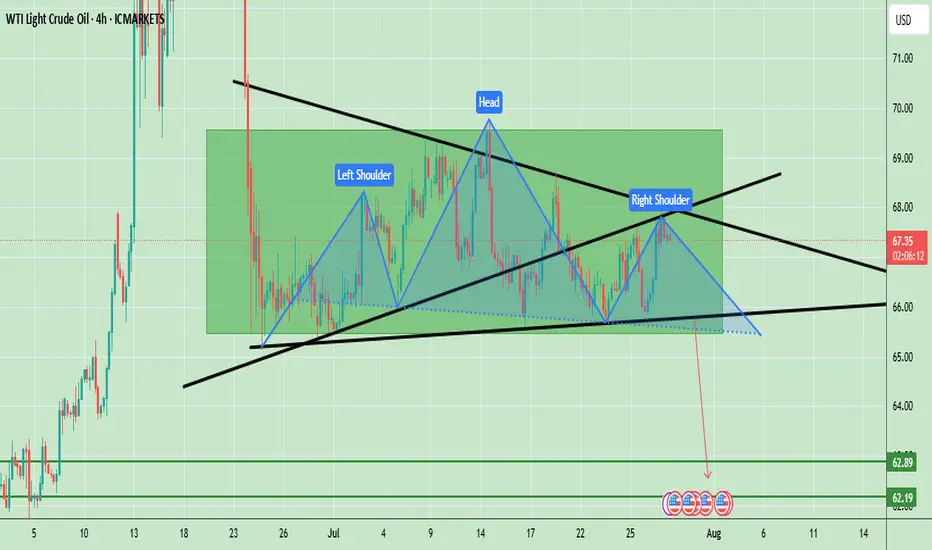
Oil Prices Form Bearish Head & Shoulders – Key Neckline in FocusWTI crude oil is showing a clear Head and Shoulders (H&S) pattern, which is a strong bearish reversal signal. The left shoulder formed in early July, followed by a higher peak forming the head in mid-July, and finally the right shoulder near the current levels, which is lower than the head. The neck
Hellena | Oil (4H): SHORT to support area of 65.944.Colleagues, I previously recommended moving trades to break-even, and for good reason. It is always necessary to hedge and reduce losses—this is part of professional work.
(Breakeven=Risk Free: Move Stop loss to the entry level).
The price has nevertheless shown a stronger correction, and I now bel

Market Analysis: Oil Prices Ease – Market Awaits Fresh CatalystMarket Analysis: Oil Prices Ease – Market Awaits Fresh Catalyst
WTI crude oil is also down and remains at risk of more losses below $64.60.
Important Takeaways for WTI Crude Oil Price Analysis Today
- WTI crude oil price continued to decline below the $66.00 support zone.
- It traded below a

USOIL BUY Smart Money + trend analysis expecting bullish Smart Money + Elliott Wave analysis expecting bullish move after corrective wave (C) completes at demand zone with Order Block, FVG, and liquidity sweep confluence

Crude oil starts to rise, are you ready?
💡Message Strategy
Oil prices continued their upward trend amid rising geopolitical risks. US President Trump recently issued a tough statement, demanding Russia end the conflict with Ukraine within 10 to 12 days or face secondary sanctions.
Fears that Russian crude oil exports might be disrupte

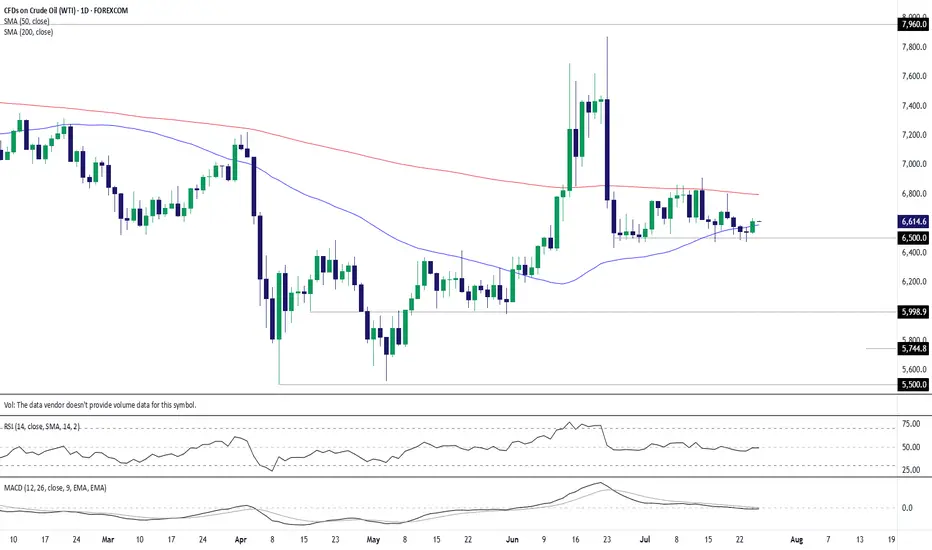
WTI crude: $65 floor holds again as bulls test 50-day MAAfter nine failures to break and close beneath $65 per barrel over the past month, you have to wonder how much longer bears will persist in attempting to take out the level. Following a nice pop higher on Thursday, completing a morning star pattern and closing above the 50-day moving average, it may
LONG ON USOIL OIL has just completed a sweep of sell side liquidity, leaving behind lots of BUY side liquidity.
DXY is falling on top of economic news stating trump will possibly fire Jerome Powell.
All this with OPEC increase oil production.
I expect oil to make a $5-$10 move throughout the rest of the wee

See all ideas
Displays a symbol's price movements over previous years to identify recurring trends.