SPXI've been waiting patiently for a real correction in everything, but my timing was drastically off. Looks like FOMO is still in charge. My guess, stock market to ATH after ATH for a while and a final wave of FOMO for crypto will enter the air.
I believe the majority are expecting a COVID-like rebound, followed by rally continuation, but the majority tends to be wrong.
What I can tell you is the true crypto bull run will not begin on optimism, as it has been...
It will begin on pessimism.
USSP500CFD trade ideas

US500/SPX500 Heist Plan: Grab the Index CFD Loot!Greetings, Profit Pirates! 🌟
Money chasers and market rogues, 🤑💸 let’s execute a daring heist on the US500/SPX500 Index CFD market using our 🔥Thief Trading Style🔥, powered by sharp technicals and deep fundamentals. Stick to the charted long-entry strategy, aiming to cash out near the high-risk Pink zone. Stay alert for overbought conditions, consolidation, or a trend reversal trap where bearish bandits dominate. 🏴☠️💪 Lock in your profits and treat yourself—you’ve earned it! 🎉
Entry 📈
The vault’s cracked open! 🏦 Snatch the bullish loot at the current price—the heist is on! For precision, place Buy Limit orders on a 15 or 30-minute timeframe for pullback entries, targeting a retest of the nearest high or low.
Stop Loss 🛑
📍 Set your Thief SL at the recent swing low (5640) on a 4H timeframe for day trades.📍 Adjust SL based on your risk appetite, lot size, and number of orders.
Target 🎯
Aim for 6160 or slip out early to secure your gains! 💰
Scalpers, Eyes Sharp! 👀
Focus on long-side scalps. Big capital? Dive in now! Smaller funds? Team up with swing traders for the robbery. Use a trailing SL to protect your loot. 🧲💵
US500/SPX500 Market Intel 📊
The Index CFD is riding a bullish surge, 🐂 fueled by key drivers. Dive into fundamentals, macroeconomics, COT reports, geopolitical news, sentiment, intermarket analysis, index-specific insights, positioning, and future trend targets for the full picture. 🔗check
⚠️ Trading Alert: News & Position Safety 📰
News can jolt the market! To safeguard your haul:
Avoid new trades during news releases.
Use trailing stops to lock in profits and limit losses. 🚫
Join the Heist! 💥
Back our robbery plan—hit the Boost Button! 🚀 Let’s stack cash effortlessly with the Thief Trading Style. 💪🤝 Stay ready for the next heist, bandits! 🤑🐱👤🎉

US500 Will Go Up! Long!
Take a look at our analysis for US500.
Time Frame: 1D
Current Trend: Bullish
Sentiment: Oversold (based on 7-period RSI)
Forecast: Bullish
The market is testing a major horizontal structure 6,165.52.
Taking into consideration the structure & trend analysis, I believe that the market will reach 6,451.04 level soon.
P.S
The term oversold refers to a condition where an asset has traded lower in price and has the potential for a price bounce.
Overbought refers to market scenarios where the instrument is traded considerably higher than its fair value. Overvaluation is caused by market sentiments when there is positive news.
Disclosure: I am part of Trade Nation's Influencer program and receive a monthly fee for using their TradingView charts in my analysis.
Like and subscribe and comment my ideas if you enjoy them!

Let's see how it goes. www.youtube.com
"The true strength of any government, military, or society lies in its commitment to protect civilians. When that principle is compromised, we lose the very reason these institutions exist. Power must serve humanity, not harm it."

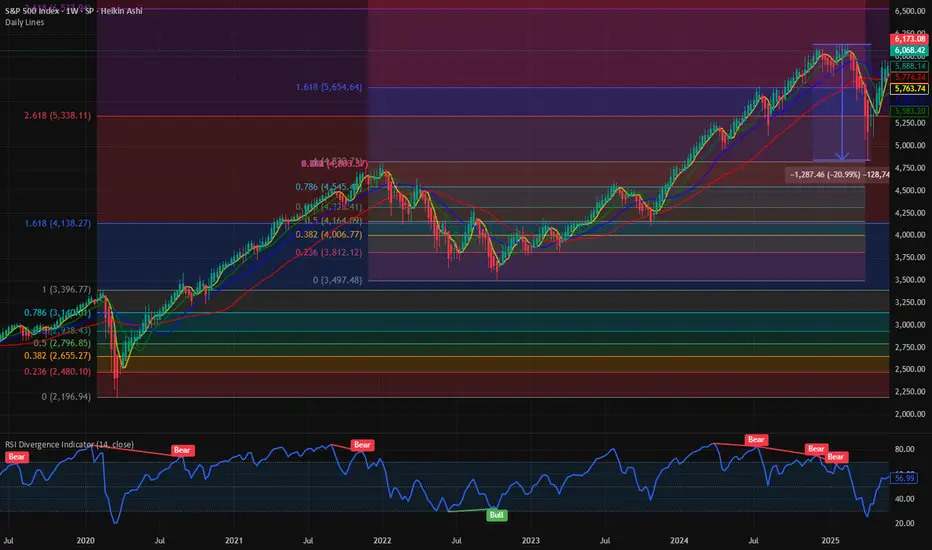
$SPX Path of least resistance is higher. Next Stop : 6500 This week we officially recovered all the losses from the liberation day low. We had a 20% bear market crash and since then there has been a V shaped rally in the major averages. NASDAQ:QQQ and SP:SPX have fully recovered the losses and then some. It is 0% form its ATH. We have been closely following the chart of SP:SPX for the last few weeks and have marked various Fib Retracement levels and Fib Extenstion. IN my opinion the Covid lows were one of the majot drawdown moments.
If we plot the Fib Extension on the COVID highs and lows, we can clearly see the Support and Resistance zones. As per the Fib Levels the next consequential level in SP:SPX will be 6550, which is the 3.618 Fib level. That I would suggest as the path to least resistance. First, we go higher before we can see any major correction. In case of a Major correction, we get support @ 5300.
Verdict : SP:SPX goes higher first before correction. 6550 is the next stop.
S&P500 Potential UpsidesHey Traders, in today's trading session we are monitoring US500 for a buying opportunity around 6,075 zone, S&P500 is trading in an uptrend and currently is in a correction phase in which it is approaching the trend at 6,075 support and resistance area.
Trade safe, Joe.

Watch out for SPX500USDHi traders,
Last week SPX500USD made a gap lower but after the fill it went further up and broke the previous swing high (ATH). This could be the last wave 5 (orange) of wave 3 (red).
So next week we could see this pair go lower for a (big) correction down.
Let's see what the market does and react if it reaches the Daily bullish FVG's.
Trade idea: Wait for price come into the Daily bullish FVG's to trade longs again. At the moment price is too high to trade.
If you want to learn more about trading FVG's & liquidity sweeps with Wave analysis, then please make sure to follow me.
This shared post is only my point of view on what could be the next move in this pair based on my technical analysis.
Don't be emotional, just trade your plan!
Eduwave

Hourly SAR moved above priceThis is an earlier signal compared to the standard bearish Wolfewave entry - which is price entering back below the 1-3 line.
Here, I placed a 1:3 risk/reward ratio.
Keep in mind that there could be stop hunters just above the bear risk tolerance.
Next in line in the fractal order to mark a swing high will be the 4 hour SAR.
Standard bearish Wolfewave Target is the 1-4 line.
Alternative Targets are the Magic Lines.
Patterns can fail
Do your own due diligence.

S&P 500 Daily Chart Analysis For Week of June 27, 2025Technical Analysis and Outlook:
During the current trading week, the S&P 500 Index has predominantly demonstrated an upward trajectory, surpassing the Mean Resistance level of 6046, the Outer Index Rally target of 6073, and the critical Key Resistance threshold of 6150. Currently, the index is exhibiting a bullish trend, indicating potential movement towards the Outer Index Rally objective of 6235. However, it is essential to note that there is a substantial probability that prices may retract from their current levels to test the Mean Support at 6136 before experiencing a resurgence.

V2. US S&P Zones - PMI Manuf, USINTR, Inflation, DXY & QEV2. US S&P Zones - PMI Manuf, USINTR, Inflation, DXY & QE
US S&P Zone Analysis -- Correlation with
1. Leading Economic Indicators (PMI Manufacturing Index, PMI Services Index, Building Permits)
2. US Interest Rates (MEAN 1.97 from Jan 2003)
3. US Inflation Rate YoY
4. Dollar Index (DXY)
5. Quantitative Easing Episodes
WHY CHANGE IN APPROACH?
As per Ammar Bhai, Red and other Zones for US and developed markets shall not follow only Interest Rates after 2000. Traditional single impact of Interest Rate is not Enough.
NOTE ABOUT INFLATION ABOVE 5%
It was also noticed that if inflation was about 5% that coincided with Red and Yellow zone and it must be avoided for stock trading.
NEW APPROACH
NEW GREEN ZONE
1. PMI Manuf Index is RISING or ABOVE 50
2. Interest Rates are FALLING or LEVELED or BELOW MEAN (Expansionary Policy in Effect)
3. Inflation is FALLING or AROUND TARGET
4. DXY is FALLING or SIDEWAYS
5. Stock Market RISING
NEW APPROACH for RED ZONE
1. PMI Manuf Index is FALLING or BELOW 50
2. Interest Rates are RISING or LEVELED or ABOVE MEAN (Contractionary Policy in Effect)
3. Inflation is RISING or SIDEWAYS. (Also Check if Inflation rate is above 5%)
4. DXY is RISING
5. Stock Market FALLING or SIDEWAYS
NEW YELLOW ZONE
1. PMI Manuf Index is RISING or ABOVE 50
2. Interest Rates are RISING or LEVELED
3. Inflation is RISING or SIDEWAYS (Also Check if Inflation rate is above 5%)
4. DXY is RISING or SIDEWAYS
5. Stock Market RISING or SIDEWAYS
NEW ORANGE ZONE
1. PMI Manuf Index is SIDEWAYS or BELOW 50
2. Interest Rates are FALLING or LEVELED or BELOW MEAN (Expansionary Policy in Effect)
3. Inflation is FALLING or SIDEWAYS (Also Check if Inflation rate is above 5%)
4. DXY is FALLING or SIDEWAYS
5. Stock Market RISING or SIDEWAYS
Historically whenever Interest Rates are dropping, US market goes down for some months:
US somehow try to control Inflation before bringing the interest rates down.
When Inflation is under control and Growth has not gone down much, then they decrease the interest rates
Because in past whenever Interest rates were decreased, growth also fell for some months and then improved.
Then FED does QE, which bring surplus cash in the market, Which drops Dollar rate, that helps the Stock Market grow.

US500 will fly!US500 (H4 time frame) is in up trend and recently broke the highest CTS and touches POI, if it keeps higher and breaks 6,168.13 then go long
This result depends on my own analysis (Am not professional or advisor)

Generally bullish sentiment heading into next weekWednesday's AUD CHF trade finally stopped out. I've been a little surprised by CHF resilience considering the 'risk on' environment. I have read an interesting article suggesting CHF and EUR strength can be attributed to holding relatively high amounts of gold reserves. I'm not sure how much long term credence I'd give that theory but it does make sense.
Meanwhile, the USD turned out to be the currency to short this week as the market starts to price in more rate cuts than thought a few weeks ago. It could be a tricky road ahead for the FED, as softening data, and now today's higher than forecast PCE data means the dreaded 'stagflation' word will be mentioned. But with the VIX well below 20 and the S&P touching all time highs, in the absence of Middle East re-escalation or fresh tariff concerns, I'll begin next week with a mind to continue looking for 'risk on' trades.
For today, I will let Friday's price action do what it's going to do and start fresh next week.

The S&P did it!The S&P 500 has reached a new ATH. The monthly RSI looks strong as well. This could trigger an explosion into the target area.

LONG SPX TILL 6300+Hi,
I am publishing this idea for educational purpose. I beleive break out has done and spx should touch 6300 t0 6400 zone in future soon.

S&P 500 hits fresh records: Levels to watchBreaking its February peak, the S&P 500 has joined the Nasdaq 100 in hitting a new record high this week. The latest gains came on the back of a sharp de-escalation in the Middle East and mounting pressure on the Fed to cut rates.
They question is whether it will kick on from here or we go back lower given that trade uncertainty is still unresolved. Indeed, there’s the upcoming 9 July deadline, when the current reciprocal tariff truce is due to expire. Unless it’s extended—or replaced by something more concrete—we could be in for another wave of trade tensions.
It is also worth remembering the ever-looming US fiscal showdown. Trump’s much-touted spending bill—nicknamed the “One Big Beautiful Bill”—is targeting a Senate vote by the 4th of July. If passed, it could reignite concerns about ballooning deficits and inflationary pressure.
Anyway, from a purely technical analysis point of view, the path of least resistance continues to remain to the upside. Thus, we will concentrate on dip buying strategy than looking for a potential top - until markets make lower lows and lower highs again.
With that in mind, some of the key support levels to watch include the following:
6069 - the mid-June high, which may now turn into support on a potential re-test from above
6000 - this marks the launch pad of the latest rally and marks the 21-day exponential average
5908 - this week's low, now the line in the sand. It wouldn’t make sense for the market to go below this level if the trend is still bullish.
Meanwhile, on the upside:
6169 is the first target, marking the 161.8% Fib extension of the most recent downswing
6200 is the next logical upside target given that this is the next round handle above February’s peak of 6148
By Fawad Razaqzada, market analyst with FOREX.com

It seems very simple.Based on the market volume chart, as well as its similarity to previous declines, it seems like we are approaching a reliable bottom. This bottom is not far away and could happen right around 5000. We just have to wait for the daily reversal candle.

SPX going to all time highsThe quarterly on the SPX is a powerful bullish signal. Nothing stops this train, we are going to all time highs.

July 9th EU-US tariff deal, what will happen to S&P500?Timeline & Context
-The U.S. initially implemented a 10% baseline tariff on most imports (April 5), with potential spike to 50% for EU goods on July 9 unless a deal is struck.
-On June 26, Macron warned that if U.S. keeps a 10% tariff, the EU will impose equivalent retaliatory levies.
-EU offer of “zero-for-zero” (Macron, von der Leyen) remains on the table, though Washington reportedly resists.
How Markets May React
If a 10%–10% deal is struck (U.S. keeps 10%, EU matches):
-Markets will likely breathe a sigh of relief—clearing headline risk.
-Expect a moderate rally, perhaps +1–3% in the S\&P 500, as tariff uncertainty diminishes.
-Economists note past discussion: when the EU delay hit May, S\&P futures jumped ~2%.
If they agree to Macron’s “zero-for-zero” proposal:
-That would be a bullish surprise—tariffs completely lifted.
-Market response could range +3–5%, though EU has indicated U.S. pushback on full zerozero .
-Analysts warn clarity isn’t always calm: the S\&P is already priced above fundamentals—choppy reactions still possible .
If the pause lapses with no EU agreement:
-U.S. could enforce 50% tariffs; EU likely retaliates.
-Risks: recession fears in EU, U.S. inflation spike so stocks will likely fall.
-Bank strategists forecast flat S\&P (5,900), but warn of volatility range 5,600–6,000 based on trade policy surprises.
-Disclaimer: This analysis is for informational and educational purposes only and does not constitute financial advice, investment recommendation, or an offer to buy or sell any securities. Stock prices, valuations, and performance metrics are subject to change and may be outdated. Always conduct your own due diligence and consult with a licensed financial advisor before making investment decisions. The information presented may contain inaccuracies and should not be solely relied upon for financial decisions. I am not personally liable for your own losses, this is not financial advise.

SPX : A reminderJust a follow-up reminder of what was shared on 18 May.
Price is moving as anticipated - soon to enter the blow-off zone.
Be careful. Be bold.
Over on the EURUSD - what can we expect? Actually, I can see that the price is also moving along - a bit challenging to know when to move in, until .........
Good luck.

SPX -TINAUnlimited money sloshing around means no end to upside in the markets. When the Fed finally lowers interest rates, all markets will go crazy. Calling for 7,500. Go big!!

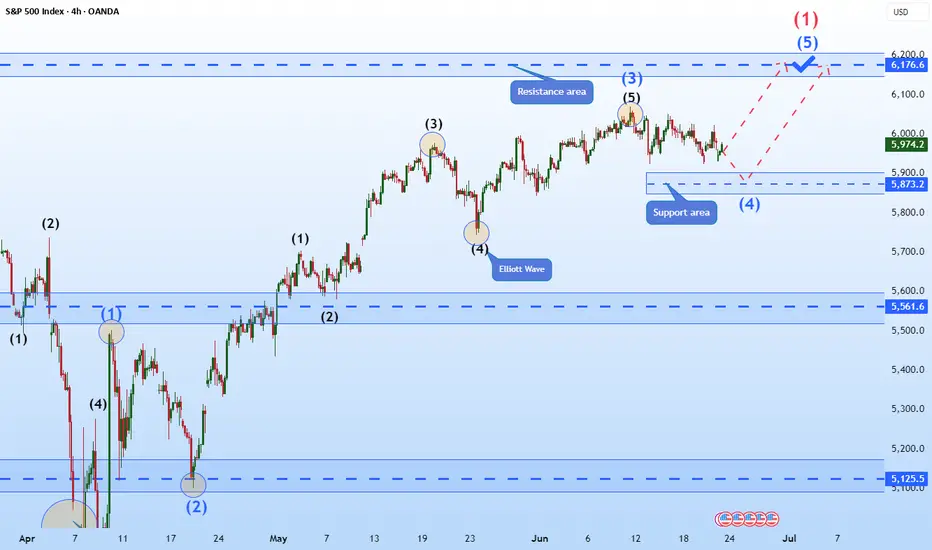
Hellena | SPX500 (4H): LONG resistance area of 6176 (Wave 1).Colleagues, the previous forecast remains essentially unchanged, and the target is still 6176, but I think the forecast can be updated because the price has been flat for quite some time.
I still expect the upward movement to continue in the large wave “1” and in the medium-order wave “5”.
A small correction to the support area of 5873 is possible.
Manage your capital correctly and competently! Only enter trades based on reliable patterns!
S&P500 and Nasdaq Short: Wave 5 <= Wave 3Based on the Elliott Wave rule that wave 3 is not the shortest wave, I gave a projection on where the peak of both S&P500 and Nasdaq could be. Based on these peaks, the stop is set above and the take profit target is where wave 4 was.

S&P. Has been struggling to keep a full bull/bear run.Setting todays fib circle I think it's going to balance out. especially with the fin levels.
Not just because of july.
