US500 Will Fall! Short!
Here is our detailed technical review for US500.
Time Frame: 10h
Current Trend: Bearish
Sentiment: Overbought (based on 7-period RSI)
Forecast: Bearish
The market is approaching a significant resistance area 5,979.56.
Due to the fact that we see a positive bearish reaction from the underlined area, I strongly believe that sellers will manage to push the price all the way down to 5,838.14 level.
P.S
Overbought describes a period of time where there has been a significant and consistent upward move in price over a period of time without much pullback.
Disclosure: I am part of Trade Nation's Influencer program and receive a monthly fee for using their TradingView charts in my analysis.
Like and subscribe and comment my ideas if you enjoy them!
USSP500CFD trade ideas

SPX: geopolitics shaping sentiment Although the previous week on US equity markets started with a positive sentiment, still the newly emerged tensions in the Middle East turned the sentiment to the negative side. The S&P 500 was looking for higher grounds, after recently reaching the 6K level again, however, turning 1,13% to the negative territory on Friday, after the news regarding the Middle East tensions. The index is back below the 6K, closing the week at 5.976. While investors were digesting the risks from the Middle East tensions, tech companies were the ones that were mostly driving the index to the down side. NVDA dropped by 2,09%, AAPL was down by 1,38%. On the opposite side was TSLA, with a Fridays gain of 1,94%.
On the other hand, the macro fundamentals were relatively positive for the US economy. The inflation is clearly calming down, with the US inflation in May at 0,1%, which was better from market estimate. Also the University of Michigan Consumer sentiment preliminary for June showed decreased inflation expectation by US consumers, at 5,1% for this year, from 6,6% posted previously.
The most important event during the week ahead would be the FOMC meeting, scheduled for Wednesday, June 18th. The Fed will also discuss the economic projections. This would be a day to watch on financial markets as it can bring some higher volatility.

Down for SPX500USDHi traders,
SPX500USD went exactly to the target of my previous outlook.
After price came into the Daily FVG it rejected from there and started the correction down.
So next week we could see more downside for this pair to finish a bigger correction down.
Let's see what the market does and react.
Trade idea: Wait for a small correction up on a lower timeframe to trade short term shorts to the previous Weekly low.
If you want to learn more about trading FVG's & liquidity sweeps with Wave analysis, then please make sure to follow me.
This shared post is only my point of view on what could be the next move in this pair based on my technical analysis.
Don't be emotional, just trade your plan!
Eduwave

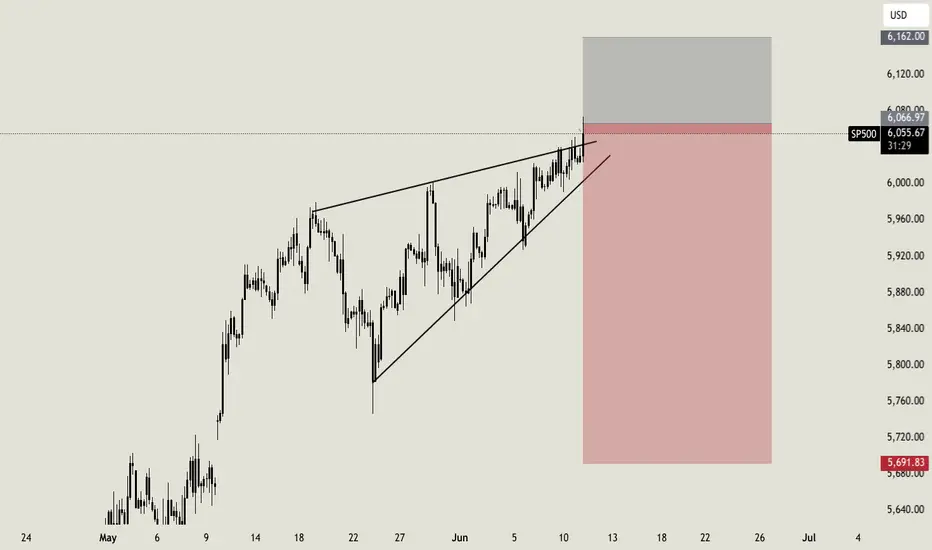
Is SPX at a crucial point here.... inflection point?Until yesterday, it seemed that bulls were fully in control chugging along to make new ATH or go closer to previous ATH. Seemed like SPX was breaking from ascending triangle. Looked bulllish going into this Opex close, certainly propped by good data and good tariff comments.
Now with the recent war news, and the dip we had yesterday, seems like new pattern emerging (rising wedge) which is bearish. Also keep in mind the JPM hedge that expires end of month. The open interest shows that JPM hedge is still alive (they havent closed) and based on my calculations currently JPM has a loss of around $622M.
To stem losses market at minimum needs to be below 5900 by end of month (at 5900 JPM loses $59M but its chump change for them) and for them to be neutral or make money then SPX needs to be 5300 and below by end of month.
Currently around 5975, would mean a drop of 500-600 points in next 2 weeks... certainly can happen....
Appreciate your comments!

S&P 500 Daily Chart Analysis For Week of June 13, 2025Technical Analysis and Outlook:
The S&P 500 Index has displayed both upward and downward movements throughout this week's trading session, narrowly missing the targeted Outer Index Rally level of 6073. Currently, the index is characterized by a bearish trend, warranting attention towards the Mean Support level of 5940, with additional critical support identified at 5888.
Conversely, there exists a significant potential that, upon reaching the Mean Support of 5940, the index may recover and rise to the Mean Resistance level of 6046. This upward movement could facilitate an interim rally, culminating in the completion of the Outer Index Rally at 6073 and enabling the index to address the Key Resistance level positioned at 6150.

sp500 shortI feel things.
War in the other side that justifies the downside.
It will be amazing to see powel saving the us stock by cutting rates on summer.
Lets chill and see what happens, liquidity is also a position.

SPX500 – 4H Smart Money Concepts | Compression Breakout & LiquidThe S&P 500 has broken down from a tight ascending wedge within a premium zone, confirming a CHoCH and suggesting a shift in short-term order flow. A corrective move is now unfolding.
🔻 Bearish Short-Term Outlook:
Weak High + CHoCH within the premium zone confirms rejection.
Multiple FVGs below offer potential draw zones:
5,900
5,850
Strong liquidity pool near 5,668.57
🧠 Smart Money Roadmap:
Structure suggests a short-term liquidity hunt below recent lows.
Equilibrium zone rests near 5,650, ideal for reaccumulation/reload.
📈 Long-Term Outlook Remains Bullish:
If liquidity objectives are met and macro improves, we may see a bullish reversal back above 6,050 toward:
6,200+
Mid/long-term fib targets near 6,500
📊 Strategy Insight:
Short-term trade: Scalps into the 5,700–5,660 zone.
Macro timing: Watch July CPI/FOMC for bullish or bearish confirmation.
Long-term positioning: Start building once price reclaims structural BOS with a displacement.
🎯 Smart money plays both ways — sweep liquidity, then reprice.
#SPX500 #SMP500 #SmartMoneyConcepts #OrderFlow #LiquiditySweep #FVG #CHoCH #PremiumZone #TechnicalAnalysis #VolumeProfile #EquityMarkets #WaverVanir #TradingView

SPX500: Trade Setupwww.youtube.com
📉 SPX500 – 4H Short Setup | Smart Money Premium Rejection
Approaching a pivotal juncture on the 4H chart, where price interaction at the premium zone signals a noteworthy development. Notably, a rejection marked by a feeble high + CHoCH structure.
🎯 Current Thesis:
- Short Entry: 5,998.3 → Entering premium + inefficient zone
- Target: 5,790.1 → Previous FVG + BOS retest area
- Potential Reload Zone: 5,704.2 – 5,644.2 → Offering deep discount + mitigation opportunities
🧠 Structure + Liquidity Insights:
- Bearish intent affirmed by BOS + CHoCH
- Fib levels align for confluence, notably 0.886 rejection at 5,875.6
- Key FVG breached; distribution evident from premium swing failure
📊 Gameplan:
Execute initial target at 5,790, consider partial exit.
Monitor reaction for possible reload near 5,704 or lower at 5,644 for continued strategy.
Maintain caution above 6,018 (weak high) for risk protection.
⏳ Context:
- Increasing volatility, weakening internals
- Downside path supported by volume nodes
- Market reassessing risk premia amidst Fed pause
🏴☠️ Trade strategically akin to smart money. Avoid impulsive actions — prioritize displacements, mitigations, and liquidity tactics.
hashtag#SPX500 hashtag#SmartMoneyConcepts hashtag#Fibonacci hashtag#ShortSetup hashtag#OrderFlow hashtag#TradingView hashtag#BearishBias hashtag#PremiumRejection hashtag#IntradayStrategy hashtag#SMP500 hashtag#WaverVanir

SPX500 – 4H Short Setup | Smart Money Premium RejectionWe’ve reached a critical inflection zone on the 4H chart. Price has tagged the premium zone and rejected with a weak high + CHoCH structure.
🎯 Current Thesis:
Entry Short: 5,998.3 → Price entered premium + inefficient zone
Price Target: 5,790.1 → Previous FVG + BOS retest zone
Reload Zone: 5,704.2 – 5,644.2 → Deep discount + mitigation area
🧠 Structure + Liquidity Logic:
BOS + CHoCH validated bearish intent.
Fib levels confirm confluence:
0.886 rejection (5,875.6)
Price now under key FVG
Distribution confirmed by swing failure at premium
📊 Gameplan:
Target first leg to 5,790, partial out.
Watch reaction for potential reload around 5,704 or deeper at 5,644 for continuation play.
Protect invalidation above 6,018 (weak high).
⏳ Context:
Volatility rising, internals weakening
Volume nodes support downside path
Fed in pause → market reevaluating risk premia
🏴☠️ Trade like smart money. Don’t chase price — wait for displacements, mitigations, and liquidity raids.
#SPX500 #SmartMoneyConcepts #Fibonacci #ShortSetup #OrderFlow #TradingView #BearishBias #PremiumRejection #IntradayStrategy #SMP500 #WaverVanir

update TP for NASDAQ i see more ups for NASDAQ .The Nasdaq index touched strong support, so I think it will rise further, as shown.

-(update)- Opportunity for buying NASDAQ After careful observation and relying on support and resistance, I see an upward movement from the support represented in front of you.


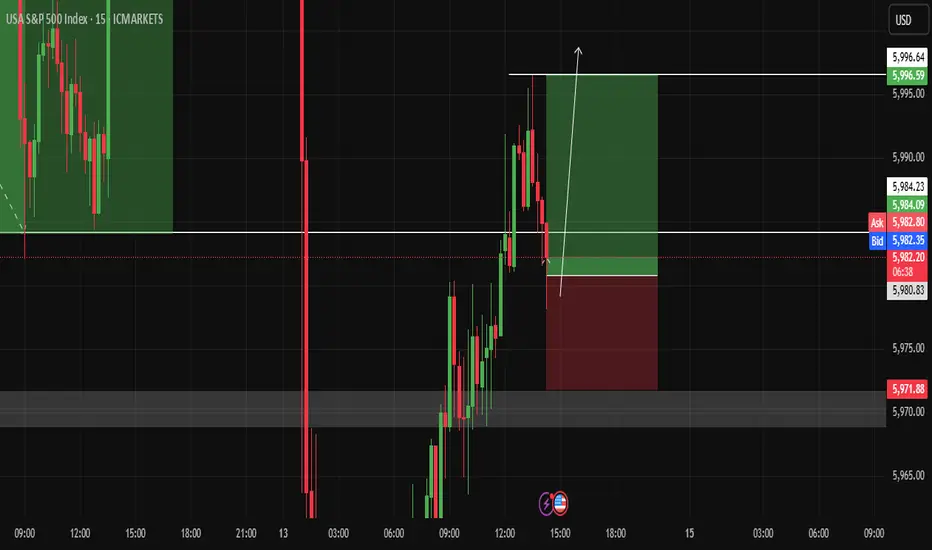
Opportunity to buy NASDAQBy combining support and resistance, I see NASDAQ rising to 5996 before reaching to 5971
SPX500 | Bearish Below 6010 Amid Rising Geopolitical TensionsSPX500 | OVERVIEW
The index remains under bearish pressure due to escalating geopolitical tensions, particularly the ongoing conflict.
As long as these conditions persist, the market is likely to maintain a downward bias.
Technical Outlook:
As long as the price trades below the 5990–6010 pivot zone, the bearish trend is expected to continue toward 5938.
A confirmed stability below 5938 may lead to further downside toward 5902 and 5858.
A bullish reversal is only likely if hostilities cease or negotiations begin between the conflicting parties.
Pivot Zone: 5990 – 6010
Support Lines: 5938, 5902, 5858
Resistance Lines: 6041, 6098, 6143
previous idea:

S&P500Both COT data and price action indicate the start of bearish momentum, making this a high-probability setup for a downside move Short Entry: Enter a short position due to the bearish setup.

The sell moment is coming? SP500Market is greed as of now, and the chart is showing a potential reversal pattern. I expect a quick short liquidation first and a big short next. I expect the market to retrace till the 5700 level in the coming weeks.
If you are a scalp trader, check my accounts page!
[06/09] [GEX] Weekly SPX OutlookLast week’s outlook played out quite well — as anticipated, SPX hit the 6000 level, closing exactly there on Friday. This was the realistic target we highlighted in last week's idea.
🔭 SPX: The Bigger Outlook
It's difficult to say whether the rising SPX trend will continue. We're still in the "90-day agreement period" set by the administration, and so far, the market has shown resilience, avoiding deeper pullbacks like the one we saw in April.
With VIX hovering around 17–18, we’ve reached a zone where further SPX upside would require volatility. For the index to continue rising meaningfully, it needs to reverse the current bearish macro environment, and that can only happen with strong buying momentum — not a slow grind.
The parallel downward channel drawn a few weeks ago is still technically valid. Even a short 100-point squeeze would fit within this structure before a larger move down unfolds.
GEX levels give us useful clues heading into Friday. We're currently in a net positive GEX zone across all expirations, giving bulls a structural advantage, just like last week.
As of Monday’s premarket, SPX spot is at 6009.The Gamma Flip zone is between 5975–5990, with a High Volume Level (HVL) at 5985.
🔍 Let’s zoom in with our GEX levels — this gives us a deeper view than our GEX Profile indicator for TradingView alone.
🐂 🟢 If SPX moves higher, the following are logical profit-taking zones:
6050 (Delta ≈ 33)
6075 (Delta ≈ 25)
6100 (Delta ≈ 17)
🎯 Targeting above 6100 currently feels irrational — for instance, the next major gamma squeeze zone is at 6150, but that corresponds to a delta 6 level (≈94% chance the price closes below it), so I won’t aim that high yet.
🐻🔴 In a bearish scenario:
5975 and 5950 are the first nearby support zones (Deltas 30 and 38).
If momentum picks up, 5900 becomes reachable quickly, even if it's technically a 17-delta distance — because that’s deep in the negative GEX zone.
📅 Don’t forget: On Wednesday premarket, we’ll get Core Inflation Rate data — a key macro risk that could shake things up, regardless of TSLA drama fading.
📌 SPX Weekly Trading Plan Conclusion
Whatever your bias, keep cheap downside hedges in place. We've been rising for a long time, and even if SPX breaks out of the descending channel temporarily, resistance and the gamma landscape may pull price back swiftly.

S&P 500 Breaks UptrendS&P 500 Breaks Uptrend
Only yesterday we questioned the sustainability of the stock market’s upward trend amid alarming news from the Middle East and the evacuation of the US embassy in Iraq — and today, the S&P 500 chart (US SPX 500 mini on FXOpen) shows a break below the lower boundary of the ascending trend channel.
According to media reports:
→ Steve Witkoff, US President Donald Trump’s special envoy to the Middle East, was expected to meet Iran’s Foreign Minister in Oman on Sunday.
→ Friday the 13th became the date when Israel launched strikes on Iran’s nuclear facilities, dramatically altering the outlook for a potential US-Iran nuclear agreement.
→ Secretary of State Marco Rubio stated that the US was not involved in the operation, while Israel’s state broadcaster reported that Washington had been informed ahead of the strikes.
Technical Analysis of the S&P 500 Chart
Yesterday morning, we noted that the Q-line, which divides the lower half of the channel into two quarters, had shifted from acting as support to becoming resistance. This was confirmed during the US trading session (as indicated by the arrow).
Selling pressure intensified, and the psychologically important 6,000 level — which showed signs of support earlier in June — now appears to be acting as resistance. It is in this area that the E-Mini S&P 500 (US SPX 500 mini on FXOpen) broke below the lower boundary of its uptrend channel.
In addition to ongoing discussions about potential Fed rate cuts this summer, geopolitical risk assessments are now also in focus. It remains unclear how Washington will respond if Iran retaliates.
Meanwhile, Israel’s Defence Minister has declared a state of emergency, warning of an imminent missile and drone attack — further fuelling fears of a possible escalation.
This article represents the opinion of the Companies operating under the FXOpen brand only. It is not to be construed as an offer, solicitation, or recommendation with respect to products and services provided by the Companies operating under the FXOpen brand, nor is it to be considered financial advice.


DOOR TO HELL IS ABOUT TO OPEN AND NO ONE IS READY.Well where do I being, firstly the world has become nonsensical and the average joe thinks they are an expert in the financial field. Little do they know the trap has been set and now it's about to be played and the fools that have been investing for the past decade are about to loose everything they worked hard for.
FOOLS DON'T REALISE THAT THE STOCK MARKET IS ABOVE A 100 YEAR TRENDLINE AND THE PAST TIMES IT HAS HIT THIS TRENDLINES 1929, 2000, 2009, 2021, THE MARKET CRASHED AND PUT THESE IDIOTS IN THEIR GRAVES. YOU CANT FKING DISRESPECT A 100 YEAR TRENDLINE AND THINK IT WILL GO PARALABOLIC, "TO THE FKING MOON THEY SAY". Yes I am a bear, the biggest bear in the forest but I am also trying to make people understand what is about to come no one is ready.
SPX Will crash from 6069 to 420, it will drop 30% with a rebound on the 1.618 fib to 550 and then the mother of all crashes will come into play a 80-90% correction to 160, the 2009 tops. No one is ready for this play.
SPEAD THOSE CHEEKS WIDE BULLS, WHAT IS ABOUT TO HAPPEN THEIR IS NO RETURN. no homo.

Volatility Incoming - But Price Will Say WhenKey levels on SPX and NDX
5905 big gamma level and hedging level for June 30 monthly and quarter expiration
DXY watching for potential bear trap and range trade
Gold, Silver, Bitcoin and others all discussed
Thanks for watching!!!

Bulls game over now 4611 incoming Weekly TF down move incoming..Fasten your seatbelt please..Big move incoming.. Good luck and safe Short from 6040 Tp 4611

update at 12pmMarket has reentered the wedge, not a great sign, but we'll have to see how the day loses. Nat Gas came down hard. Gold is holding support, BTC getting a bounce but I think it goes lower. OIL had a nice bounce but may fall here.
