Can the S&P 500's Ascent Continue?The S&P 500 recently achieved unprecedented highs, reflecting a multifaceted market surge. This remarkable performance stems primarily from a robust corporate earnings season. A significant majority of S&P 500 companies surpassed earnings expectations, indicating strong underlying financial health. The Communication Services and Information Technology sectors, in particular, demonstrated impressive growth, reinforcing investor confidence in the broader market's strength.
Geopolitical and geostrategic developments have also played a crucial role in bolstering market sentiment. Recent "massive" trade agreements, notably with Japan and a framework deal with Indonesia, have introduced greater predictability and positive economic exchanges. These deals, characterized by reciprocal tariffs and substantial investment commitments, have eased global trade tensions and fostered a more stable international economic environment, directly contributing to market optimism. Ongoing progress in trade discussions with the European Union further supports this positive trend.
Furthermore, resilient macroeconomic indicators underscore the market's upward trajectory. Despite a recent dip in existing home sales, key data points like stable interest rates, decreasing unemployment claims, and a rising manufacturing PMI collectively suggest an enduring economic strength. While technology and high-tech sectors, driven by AI advancements and strong earnings from industry leaders like Alphabet, remain primary growth engines, some segments, such as auto-related chipmakers, face challenges.
The S&P 500's climb is a testament to the powerful confluence of strong corporate performance, favorable geopolitical shifts, and a resilient economic backdrop. While the immediate rally wasn't directly driven by recent cybersecurity events, scientific breakthroughs, or patent analyses, these factors remain critical for long-term market stability and innovation. Investors continue to monitor these evolving dynamics to gauge the sustainability of the current market momentum.
USSP500CFD trade ideas
Correction will be to 6050-6190, probably the upper limit Now I notice something very important and things and the analyses of many actually coincide. Monthly support from the accumulated volume lies between 6050 and 6170. 4h indicators show a clear reversal. Separately, at these levels are the previous ATH. In my opinion, it is possible to stop even at 6180-6190. We will probably start with a gap on Monday. Now here comes the moment and over the weekend what will take place as conversations and statements in the media, but it is very likely that the minimum could happen as early as Monday night (USA time) or by Tuesday. I agree that this correction was necessary and should have happened as soon as possible because things became difficult even for bulls like me.
S&P 500 Counter-Trend Setup After Bullish Week US500Currently watching the S&P 500 (US500) closely 👀. The index has been in a strong bullish trend 📈, but I’m now evaluating a potential counter-trend opportunity.
Given the strength we’ve seen this week — possibly a “foolish rally” — there’s a chance we’ve either printed or are close to printing the high of the week 🧱. That opens the door for a retracement setup, particularly as we head into Monday’s open 🗓️.
🧠 Trade idea: If we get a bearish market structure break, I’ll be looking to enter short — targeting a 1R take profit initially, and holding a portion for a 2R–3R extension 🎯.
Friday sessions, especially after strong trends, often present clean intraday pullbacks — and when Monday’s low is set early, it can trap late buyers and fuel the move 📉.
⚠️ This is not financial advice — just sharing my thought process and trade plan.

S&P 500 Daily Chart Analysis For Week of August 1, 2025Technical Analysis and Outlook:
During the trading activity of the previous week, the S&P 500 Index displayed a predominantly bearish movement after completing our Outer Index Rally target of 6420, as highlighted in the prior week’s Daily Chart Analysis, with the primary objective now being to plug our Mean Support at 6200.
It is essential to recognize that the current price movement may trigger a significant further pullback to the Mean Support level of 6090. Following this downturn, it is expected that the index will resume its upward momentum, aiming for a retest of the Outer Index Rally peak at 6420.

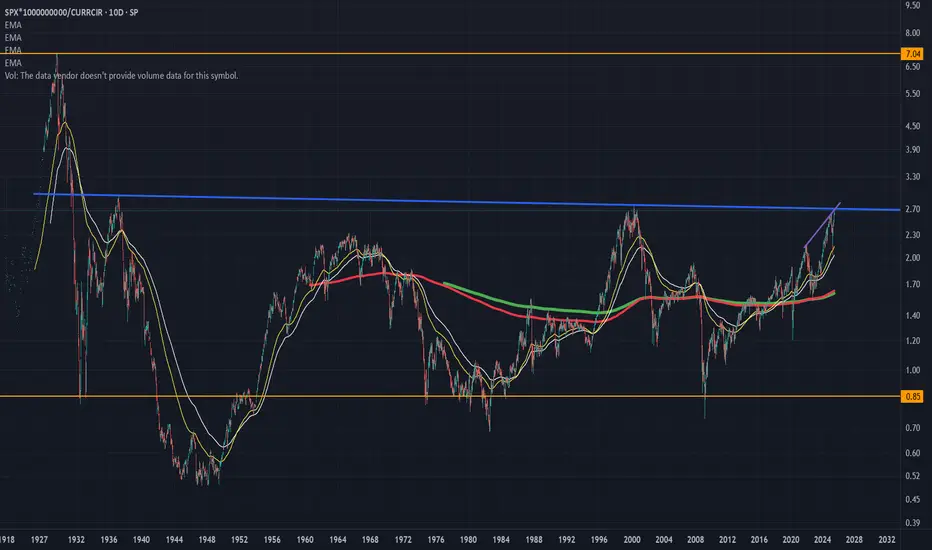
Entire S and P history in one chart. Approaching a neck-snapper!Here is a chart of the entire S and P history versus total currency in circulation.
This gives bubble periods (anytime the value is over 2) and times when the market crashed after being in a bubble.
If you notice we are fast approaching the line that broke the neck of the market in the 60s and 2000 dotcom bust.
If we clear that line, hold on to your hats because we are going into full blown speculative mania like just before the Great Depression!
In fact maybe the AI-crypto bubble will be exactly like the Great Depression, AI causing mass unemployment and global poverty.
SPX chit chat... we're still up for nowAfter that crazy April 2025 crash, it feels like we should not be this high so fast... that's how I felt before too. But the rising channel is holding up right now. We are approaching the top. In previous times, the market grinded even higher (COVID pandemic was the last example).
Today we squeezed out new ATHs. The month ends next week and a new one begins. Less fear; more charts for the rest of the year.
See you in August!

S&P 500 (CASH500) - Double Top H1Risk/reward = 2.7
Entry price = 6388.4
Stop loss price = 6399.7
Take profit level 1 (50%) = 6360.4
Take profit level 2 (50%) = 6352
Also, waiting on confirmation on some variables

S&P 500 Index Wave Analysis – 25 July 2025
- S&P 500 Index broke key resistance level 6300.00
- Likely to rise to resistance level 6500.00
S&P 500 Index recently broke the key resistance level 6300.00 (which stopped the previous waves 5 and (B), as can be seen below).
The breakout of the resistance level 6300.00 continues the active intermediate impulse wave (5) from the middle of this month.
Given the strong daily uptrend, S&P 500 Index can be expected to rise to the next resistance level 6500.00 (coinciding with the daily up channel from May).

SellRejection Level
Daily Volume
Market Structure Shift
London US Session
Trend Line Break
Untapped Order Point
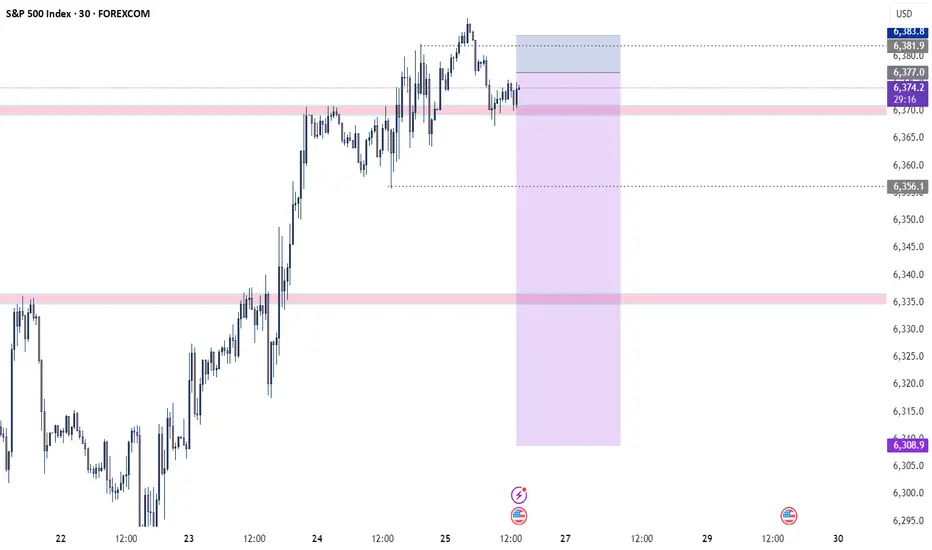
S&P500 (CASH500) SHORT - head and shoulders 30minRisk/reward = 4.1
Entry price = 6378
Stop loss price = 6385.9
Take profit level 1 (50%) = 6349.2
Take profit level 2 (50%) = 6337.2
Still waiting on confirmation of a few variables at close of this 30min candle at 17.00

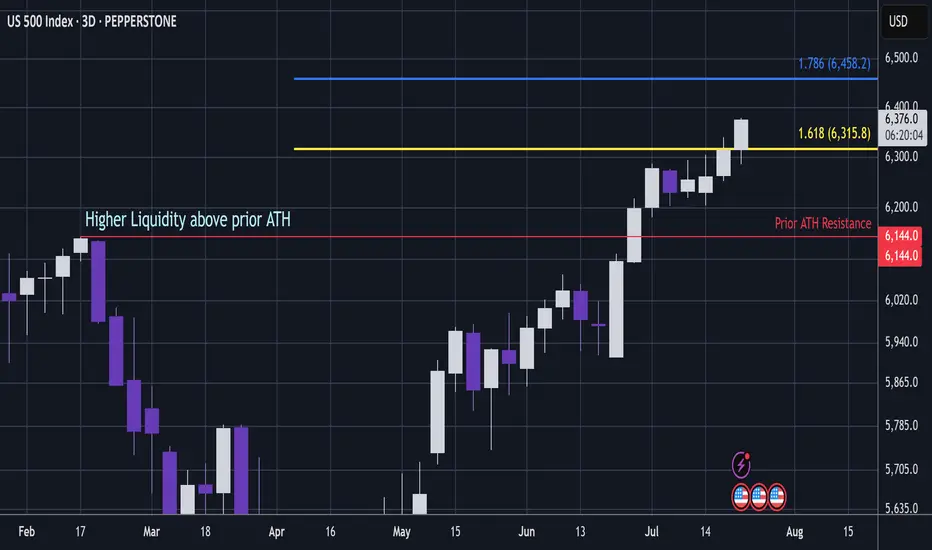
US500 - Can S&P Pass Critical Ratio / Liquidity ZoneS&P (Pepperstone CFD)
Price has popped above the 1.618 extension, which is a key ratio zone.
A bearish whipsaw in this area could be dangerous.
However, if price continues to push through this level, it signals that S&P is entering a very bullish phase.
The area above prior ATH resistance holds high liquidity.
If price moves beyond this ratio band, it will signal that a reversal in this zone is unlikely.
That said, if it’s still in this band when Trump tariffs are reinstated potentially on 1 August, then this is looking dangerous 🧐.
(Fib trendlines lower in the chart).
This analysis is shared for educational purposes only and does not constitute financial advice. Please conduct your own research before making any trading decisions.
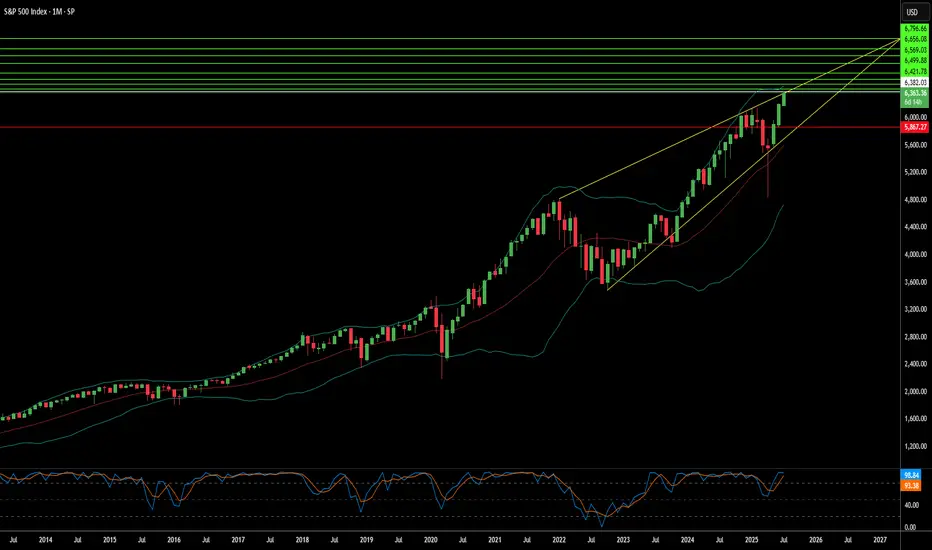
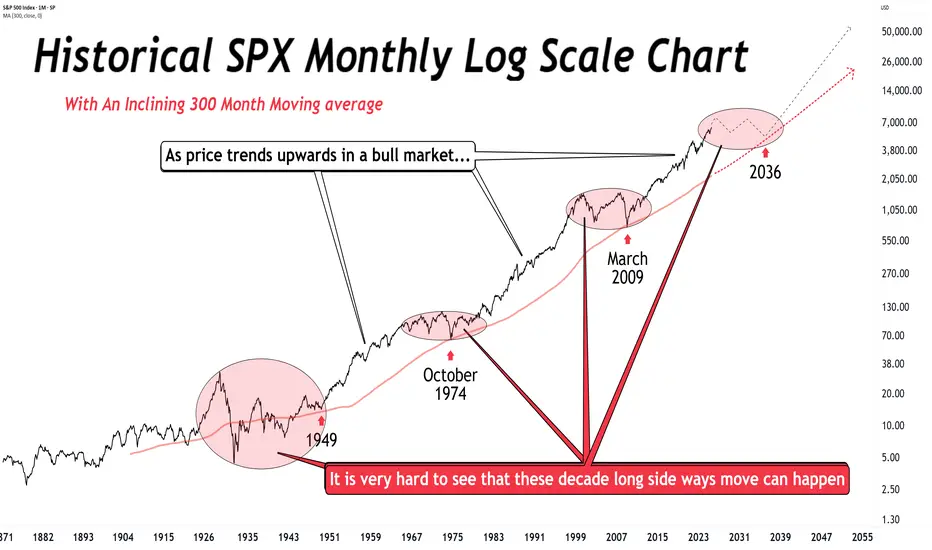
Before the perma-bulls go bonkers… Before the perma-bulls go bonkers… no, I’m not calling for a crash or bear market (yet).
But longer this bull runs, greater the odds of mean reversion.
Further we drift from 2009 without tagging the 300-month MA, more likely a sideways decade begins.
This will happen again.
You can't say we are "early" in the bull market. That simply is not true. Early is in the few years after the 2009 retouch of that very long term moving average. Can the indices still go up? Of course. But understand where you are in the cycle.
US500 Pulls Back from 6,400– Correction or Trend Shift?The index has rejected the 6,400 🔼 resistance zone with a strong bearish candle, pulling back toward the 6,200 🔽 support region. Price is still trading within a bullish structure, but this drop may signal early signs of exhaustion.
Support Levels: 6,200 🔽, 6,100 🔽, 6,000 🔽
Resistance Levels: 6,300 🔼, 6,400 🔼
Bias:
🔼 Bullish: If price holds above 6,200 and reclaims 6,300, the uptrend remains intact and bulls may reattempt a push toward 6,400.
🔽 Bearish: A daily close below 6,200 could open a deeper retracement toward 6,100 or even 6,000.
📛 Disclaimer: This is not financial advice. Trade at your own risk.

Risk-Off SignalsRisk-Off: 1 August with 2 indicators:
Voil. Momentum and Bear Market Risk Indicators (BMRI)
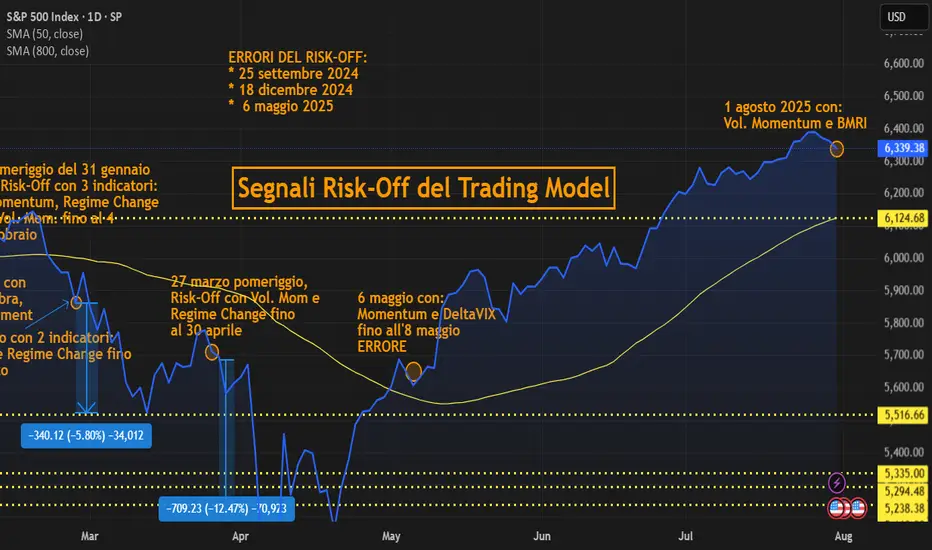
Bearish Engulfing on Risk. Average quarterly downside since 2023 open is 4.07%. Is a retest of near the yearly open on order over the month of August? Markets are no longer pricing in a Fed rate cut in September. Will that be the near term bearish fuel?

SPX to 6600+ by Aug 5This leg up in SPX is not over yet. Target at upper bound of the channel around 6.6K+ by Aug 5.

S&P Market Update – Signs of a Short-Term Correction?Although the S&P remains in an uptrend, recent price action suggests that momentum may be fading.
📉 Key Observations:
A Key Day Reversal occurred at 6409 – a potential warning signal.
We're seeing RSI divergence: price made a new high, but RSI didn’t follow suit.
The market is grinding higher, but without conviction.
📊 What to Watch:
The 15-day EMA, currently at 6317, is acting as near-term support. A close below this level could trigger a short-term correction.
Initial downside targets: 6147–6100, the previous highs from late 2024 and early 2025.
✅ To negate this bearish bias, the market would need to break above 6409 and continue higher with stronger momentum.
Stay alert — the technicals are flashing red flags. Always manage risk accordingly.
Disclaimer:
The information posted on Trading View is for informative purposes and is not intended to constitute advice in any form, including but not limited to investment, accounting, tax, legal or regulatory advice. The information therefore has no regard to the specific investment objectives, financial situation or particular needs of any specific recipient. Opinions expressed are our current opinions as of the date appearing on Trading View only. All illustrations, forecasts or hypothetical data are for illustrative purposes only. The Society of Technical Analysts Ltd does not make representation that the information provided is appropriate for use in all jurisdictions or by all Investors or other potential Investors. Parties are therefore responsible for compliance with applicable local laws and regulations. The Society of Technical Analysts will not be held liable for any loss or damage resulting directly or indirectly from the use of any information on this site.

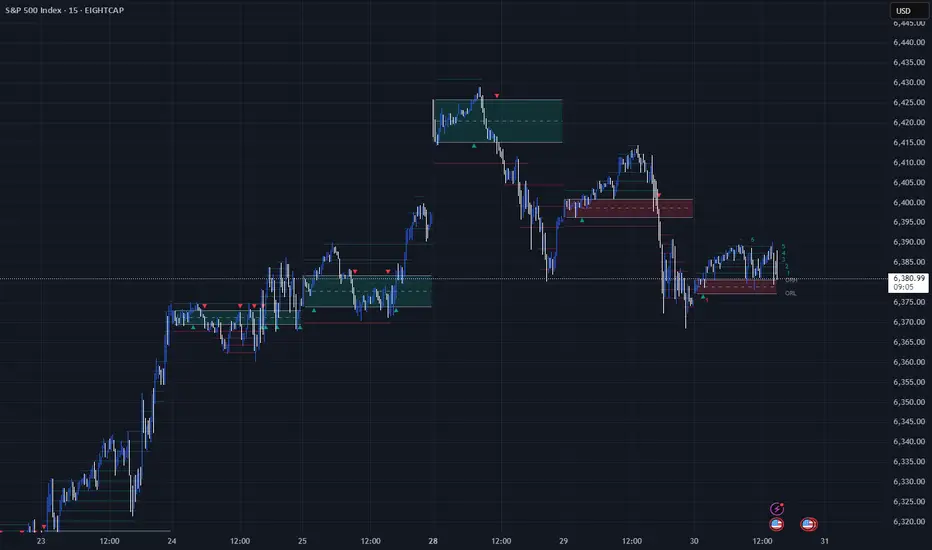
Unlocking the Power of ORB (Opening Range Breakout)Unlocking the Power of ORB (Opening Range Breakout): A Proven Strategy for Intraday Traders
In the fast-paced world of intraday trading, simplicity and structure can often outperform complexity. One such time-tested strategy is the Opening Range Breakout (ORB) — a method favored by both discretionary and system traders for its clarity and adaptability.
📌 What is ORB (Opening Range Breakout)?
ORB refers to the price range (high and low) formed during the first few minutes (typically 5, 15, or 30) after the market opens. Traders look for a breakout above or below this range, anticipating strong momentum in that direction.
🧠 Why ORB Works
Volume Surge: The opening minutes see high institutional activity, creating genuine demand/supply signals.
Market Psychology: ORB captures trader sentiment as news digests overnight and is priced in at the open.
Defined Risk: The high/low of the range becomes a natural stop-loss area, allowing clean setups.
✅ Entry and Exit Rules for the ORB Strategy
Having a consistent framework helps you avoid emotional decisions. Here’s how you can structure your trades using ORB:
🔹 Entry Criteria:
Timeframe: Define your ORB window — e.g., first 15-minute candle.
Bullish Breakout Entry:
Enter long when price closes above the ORB high with volume confirmation.
Bearish Breakdown Entry:
Enter short when price closes below the ORB low with volume confirmation.
⚠️ Avoid entering on the first breakout candle. Wait for a close and retest, or a strong momentum candle for higher confidence.
🔹 Stop-Loss Placement:
For Long Trades: Place SL just below ORB low
For Short Trades: Place SL just above ORB high
🔹 Target/Exit Options:
Fixed RR Target: Aim for 1.5–2x your risk as initial target.
Mid/Outer Bands: Use indicator-drawn breakout bands (like those in LuxAlgo script) as profit zones.
Time-based Exit: Close position by end of session if price stalls or consolidates.
Trailing Exit: Trail your stop behind higher lows (long) or lower highs (short) after breakout.
📊 ORB in Action
You can explore this ready-to-use TradingView indicator to visualize ORB levels in real-time:
🔍 Indicator: Opening Range with Breakouts & Targets (by @LuxAlgo) Thanks to @LuxAlgo team to make this indicator available.
🛠️ Highlights:
Automatically marks the opening range
Plots breakout zones and targets
Ideal for intraday strategies
Works across indices, forex, and crypto
📓 Integrating ORB into Your Trading Journal App
If you're journaling ORB trades, consider logging:
✅ Symbol & timeframe
✅ ORB range (high/low)
✅ Breakout direction (long/short)
✅ Entry time & price
✅ Exit reason (target hit, SL hit, time-based exit)
✅ Notes: market sentiment, news drivers, volume confirmation
Over time, this data will help you:
🔍 Identify which assets respect ORB best
📈 Tune your RR ratio and stop placements
🧠 Reduce decision fatigue by automating setups
🧪 Want to Automate It?
Our trading journal app is ready with 🧠 AI-based journaling for feedback and refinement
🎯 Final Thoughts
ORB is a classic — not because it’s flashy, but because it offers structure, risk control, and repeatability. Whether you're a price action purist or using smart indicators, ORB can provide a disciplined edge — especially when integrated into a journaling and feedback loop.
📌 Start small. Track results. Tune your edge.
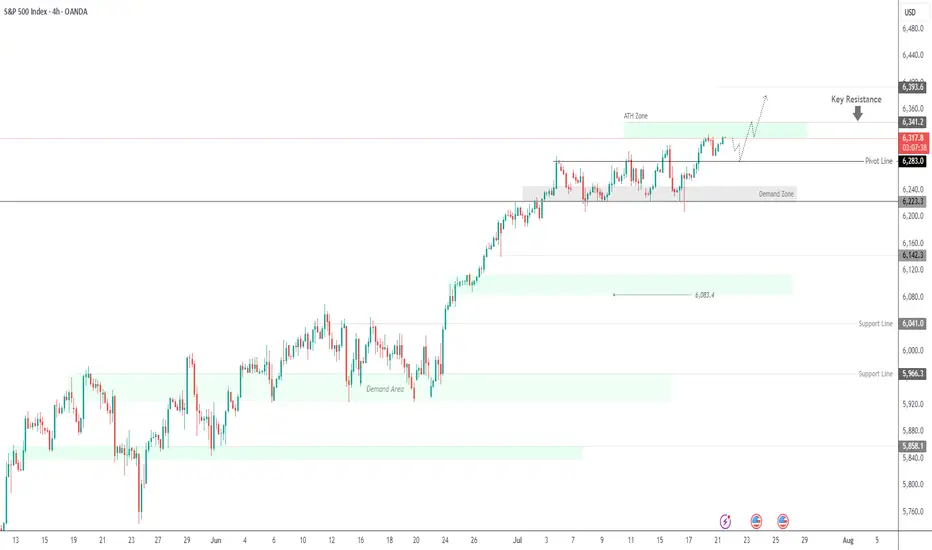
SPX500 Near ATH | Earnings Week Could Fuel Next MoveSPX500 | Weekly Outlook
The S&P 500 continues its bullish run, trading at record highs as investors await a critical week of tech earnings. Reports from Alphabet and Tesla could be key in justifying the lofty valuations driven by the AI boom.
Technical Outlook:
The price is expected to consolidate between 6341 and 6283 before any decisive move. A short-term bearish correction may occur initially, but if the price holds above the support zone, a push toward a new ATH at 6341 is likely. A breakout above this level could extend gains toward 6375 and 6393.
However, a break below 6283 would indicate weakness, potentially driving the price toward the demand zone near 6250 and 6224.
Support: 6283 · 6250 · 6224
Resistance: 6341 · 6375 · 6393
S&P500 Critical short-term crossroads.The S&P500 index (SPX) has been trading within a Channel Up since for the entirety of July and right now is ahead of important crossroads. It either breaks out above the pattern or pulls back to price a new Higher Low.
Based on the 4H CCI and the similarities with the June 24 - 25 consolidation, there are higher probabilities to break upwards. That fractal reached the 2.0 Fibonacci extension after it broke out. We will wait for confirmation and if it's delivered, we will buy the break-out and target 6460 (just below Fib 2.0 ext).
Until then, being so close to the Channel Up top, makes a solid short opportunity targeting a Higher Low (bottom). The previous one was priced exactly on the 4H MA100 (green trend-line) so that's our target or 6250 if it comes earlier.
-------------------------------------------------------------------------------
** Please LIKE 👍, FOLLOW ✅, SHARE 🙌 and COMMENT ✍ if you enjoy this idea! Also share your ideas and charts in the comments section below! This is best way to keep it relevant, support us, keep the content here free and allow the idea to reach as many people as possible. **
-------------------------------------------------------------------------------
Disclosure: I am part of Trade Nation's Influencer program and receive a monthly fee for using their TradingView charts in my analysis.
💸💸💸💸💸💸
👇 👇 👇 👇 👇 👇

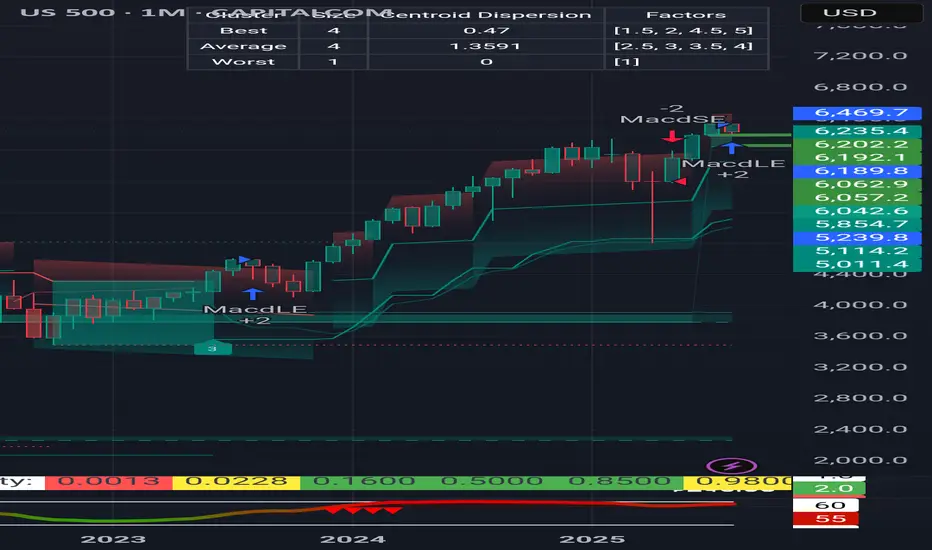
Quarterly Candle AnalysisQuarterly candle data going back to 1928 was exported and analyzed in Excel .
The purpose of doing so was to identify candles comparable to the candle we had in Q2 of 2025 (last quarter) in terms of scale and form.
Two properties of the candles were considered:
1. Candle Length as a % of Close (Column L)
2. Lower Wick as a % of Close minus Upper Wick as a % of Close (Column R)
The product of these properties (Column S) was considered as the primary quantitative metric for this analysis.
The two quarters determined to be most similar based on having green candles with forms similar to Q2 2025 were as follows:
Q4 1998
Q1 2016
Both quarters were followed by at least 4 more bullish quarters, hence, the result of this analysis is bullish, as should be expected with such a bullish candle.

S&P's "hugely overbought" towards 6375!1). Position Volume dropping! 2). Big institutions (Banks & Insurance) have backed off on higher Risk positions! 3). Huge resistance at .728 fib & trend! 4). Trump tariff talk is likely adding to a fall as well! 5). We're looking for a "SELL" trade @ 6375, since buying is too risky at the moment...Good Luck!

People don't like the truth! Let's be honest, people don't like honesty. They prefer ideas that affirm their own beliefs.
When I read articles and posts from newer traders, it's often from a place of "all in" diamond hands and the notion that things go up forever.
I've been a trader for over 25 years now, and the game isn't about making a quick buck, it's about making money over and over again. This got me thinking, the issue is when you deal with a small account you require leverage, small timeframes and of course the "shit" or bust mindset. If you lose a thousand dollars, $10,000 even $100,000 - what does it matter? That's no different than a game of poker in Vegas.
The idea of being 80% in drawdown, is alien to me. The idea of one trade and one win is also a crazy notion.
Instead of playing with the future, there is an easier way to work. This isn't about slow and boring, it's about psychology and discipline. 10% returns on a million-dollar account isn't all that difficult. Instead of aiming for 300x returns on an alt coin (due to the account size being tiny) You can make less of a percentage gain with a larger account size.
In terms of psychology - the word " HOPE " is used, way too often, it's used when you hope a stock or the price of Bitcoin goes up, it's used when you hope the position comes back in your favour, it's used when you want your 10,000 bucks to double.
This isn't trading, it's gambling.
The truth is, it's not the winners that make you a good trader. It's the way you deal with the losses.
Once you learn proper risk management, a downtrend in a market move is a 1-2% loss coupled with a new opportunity to reverse the bias.
As a disciplined trader, the game is played differently.
Let's assume you don't have $100k spare - prop firms are a great option, OPM = other people's money.
Remove the risk and increase the leverage, all whilst trading with discipline.
The market goes through many phases, cycles and crashes.
You don't always need something as catastrophic to take place, but if you are all in on a position. You need to understand that losses can be severe and long-lasting.
When everyone sees an oasis in the desert, it's often a mirage.
You only have to look at the Japanese lesson in 1989, when the Nikkei was unstoppable-until it wasn't. For that short space in time, everyone was a day trader, housewives to taxi drivers.
Everyone's a genius in a Bull market.
Then comes the crash. The recovery time on that crash?
34-years!!!
I have covered several aspects of psychology here on TradingView;
When it comes to trading, if you are able to keep playing. It's a worthwhile game. If you are gambling, it's a game whereby the house often wins.
Right now, stocks are worth more than their earnings. Gold is up near all-time highs, crypto, indices the same.
All I am saying is if you are all in. Be careful!
Disclaimer
This idea does not constitute as financial advice. It is for educational purposes only, our principal trader has over 25 years' experience in stocks, ETF's, and Forex. Hence each trade setup might have different hold times, entry or exit conditions, and will vary from the post/idea shared here. You can use the information from this post to make your own trading plan for the instrument discussed. Trading carries a risk; a high percentage of retail traders lose money. Please keep this in mind when entering any trade. Stay safe.