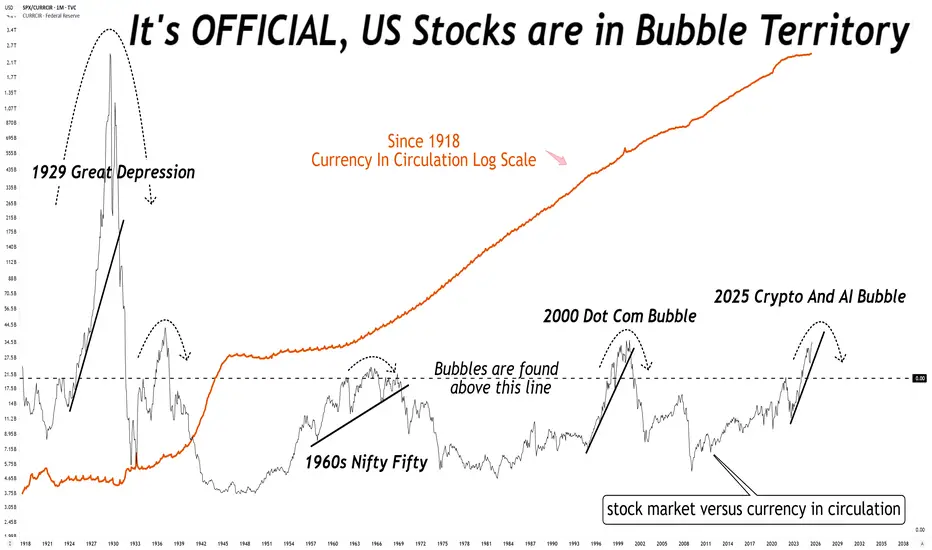
What do you mean the stock market is not in a bubble?What do you mean the stock market is not in a bubble?
No, it is not different this time, there is always a reversion to mean.
USSP500CFD trade ideas
S&P500 (CASH500) SHORT - Head and shoulders Risk/reward = 5.8
Entry price = 6321.1
Stop loss price = 6333.5
Take profit level 1 (50%) = 6257.3
Take profit level 2 (50%) = 6234.9
Still waiting for confirmation on a few variables before I enter the trade.
The Empirical Validity of Technical Indicators and StrategiesThis article critically examines the empirical evidence concerning the effectiveness of technical indicators and trading strategies. While traditional finance theory, notably the Efficient Market Hypothesis (EMH), has long argued that technical analysis should be futile, a large body of academic research both historical and contemporary presents a more nuanced view. We explore key findings, address methodological limitations, assess institutional use cases, and discuss the impact of transaction costs, market efficiency, and adaptive behavior in financial markets.
1. Introduction
Technical analysis (TA) remains one of the most controversial subjects in financial economics. Defined as the study of past market prices and volumes to forecast future price movements, TA is used by a wide spectrum of market participants, from individual retail traders to institutional investors. According to the EMH (Fama, 1970), asset prices reflect all available information, and hence, any predictable pattern should be arbitraged away instantly. Nonetheless, technical analysis remains in widespread use, and empirical evidence suggests that it may offer predictive value under certain conditions.
2. Early Empirical Evidence
The foundational work by Brock, Lakonishok, and LeBaron (1992) demonstrated that simple trading rules such as moving average crossovers could yield statistically significant profits using historical DJIA data spanning from 1897 to 1986. Importantly, the authors employed bootstrapping methods to validate their findings against the null of no serial correlation, thus countering the argument of data mining.
Gencay (1998) employed non-linear models to analyze the forecasting power of technical rules and confirmed that short-term predictive signals exist, particularly in high-frequency data. However, these early works often omitted transaction costs, thus overestimating potential returns.
3. Momentum and Mean Reversion Strategies
Momentum strategies, as formalized by Jegadeesh and Titman (1993), have shown persistent profitability across time and geographies. Their approach—buying stocks that have outperformed in the past 3–12 months and shorting underperformers—challenges the EMH by exploiting behavioral biases and investor herding. Rouwenhorst (1998) confirmed that momentum exists even in emerging markets, suggesting a global phenomenon.
Conversely, mean reversion strategies, including RSI-based systems and Bollinger Bands, often exploit temporary price dislocations. Short-horizon contrarian strategies have been analyzed by Chan et al. (1996), but their profitability is inconsistent and highly sensitive to costs, timing, and liquidity.
4. Institutional Use of Technical Analysis
Contrary to the belief that TA is primarily a retail tool, it is also utilized—though selectively—by institutional investors:
Hedge Funds: Many quantitative hedge funds incorporate technical indicators within multi-factor models or machine learning algorithms. According to research by Neely et al. (2014), trend-following strategies remain a staple among CTAs (Commodity Trading Advisors), particularly in futures markets. These strategies often rely on moving averages, breakout signals, and momentum filters.
Market Makers: Although market makers are primarily driven by order flow and arbitrage opportunities, they may use TA to model liquidity zones and anticipate stop-hunting behavior. Order book analytics and technical levels (e.g., pivot points, Fibonacci retracements) can inform automated liquidity provision.
Pension Funds and Asset Managers: While these institutions rarely rely on TA alone, they may use it as part of tactical asset allocation. For instance, TA may serve as a signal overlay in timing equity exposure or in identifying risk-off regimes. According to a CFA Institute survey (2016), over 20% of institutional investors incorporate some form of technical analysis in their decision-making process.
5. Adaptive Markets and Conditional Validity
Lo (2004) introduced the Adaptive Markets Hypothesis (AMH), arguing that market efficiency is not a binary state but evolves with the learning behavior of market participants. In this framework, technical strategies may work intermittently, depending on the ecological dynamics of the market. Neely, Weller, and Ulrich (2009) found technical rules in the FX market to be periodically profitable, especially during central bank interventions or volatility spikes—conditions under which behavioral biases and structural inefficiencies tend to rise.
More recent studies (e.g., Moskowitz et al., 2012; Baltas & Kosowski, 2020) show that momentum and trend-following strategies continue to deliver long-term Sharpe ratios above 1 in diversified portfolios, particularly when combined with risk-adjusted scaling techniques.
6. The Role of Transaction Costs
Transaction costs represent a critical variable that substantially alters the net profitability of technical strategies. These include:
Explicit Costs: Commissions, fees, and spreads.
Implicit Costs: Market impact, slippage, and opportunity cost.
While early studies often neglected these elements, modern research integrates them through realistic backtesting frameworks. For example, De Prado (2018) emphasizes that naive backtesting without cost modeling and slippage assumptions leads to a high incidence of false positives.
Baltas and Kosowski (2020) show that even after accounting for bid-ask spreads and market impact models, trend-following strategies remain profitable, particularly in futures and FX markets where costs are lower. Conversely, high-frequency mean-reversion strategies often become unprofitable once these frictions are accounted for.
The impact of transaction costs also differs by asset class:
Equities: Higher costs due to wider spreads, especially in small caps.
Futures: Lower costs and higher leverage make them more suitable for technical strategies.
FX: Extremely low spreads, but high competition and adverse selection risks.
7. Meta-Analyses and Recent Surveys
Park and Irwin’s (2007) meta-analysis of 95 studies found that 56% reported significant profitability from technical analysis. However, profitability rates dropped when transaction costs were included. More recent work by Han, Yang, and Zhou (2021) extended this review with data up to 2020 and found that profitability was regime-dependent: TA performed better in volatile or trending environments and worse in stable, low-volatility markets.
Other contributions include behavioral explanations. Barberis and Thaler (2003) suggest that TA may capture collective investor behavior, such as overreaction and underreaction, thereby acting as a proxy for sentiment.
8. Limitations and Challenges
Several methodological issues plague empirical research in technical analysis:
Overfitting: Using too many parameters increases the likelihood of in-sample success but out-of-sample failure.
Survivorship Bias: Excluding delisted or bankrupt stocks leads to inflated backtest performance.
Look-Ahead Bias: Using information not available at the time of trade leads to unrealistic results.
Robust strategy development now mandates walk-forward testing, Monte Carlo simulations, and realistic assumptions on order execution. The growing field of machine learning in finance has heightened these risks, as complex models are more prone to fitting noise rather than signal (Bailey et al., 2014).
9. Conclusion
Technical analysis occupies a contested but persistent role in finance. The empirical evidence is mixed but suggests that technical strategies can be profitable under certain market conditions and when costs are minimized. Institutional investors have increasingly integrated TA within quantitative and hybrid frameworks, reflecting its conditional usefulness.
While TA does not provide a universal arbitrage opportunity, it can serve as a valuable tool when applied adaptively, with sound risk management and rigorous testing. Its success ultimately depends on context, execution discipline, and integration within a broader investment philosophy.
References
Bailey, D. H., Borwein, J. M., Lopez de Prado, M., & Zhu, Q. J. (2014). "The Probability of Backtest Overfitting." *Journal of Computational Finance*, 20(4), 39–69.
Baltas, N., & Kosowski, R. (2020). "Trend-Following, Risk-Parity and the Influence of Correlations." *Journal of Financial Economics*, 138(2), 349–368.
Barberis, N., & Thaler, R. (2003). "A Survey of Behavioral Finance." *Handbook of the Economics of Finance*, 1, 1053–1128.
Brock, W., Lakonishok, J., & LeBaron, B. (1992). "Simple Technical Trading Rules and the Stochastic Properties of Stock Returns." Journal of Finance, 47(5), 1731–1764.
Chan, L. K. C., Jegadeesh, N., & Lakonishok, J. (1996). "Momentum Strategies." Journal of Finance, 51(5), 1681–1713.
De Prado, M. L. (2018). Advances in Financial Machine Learning, Wiley.
Fama, E. F. (1970). "Efficient Capital Markets: A Review of Theory and Empirical Work." Journal of Finance, 25(2), 383–417.
Gencay, R. (1998). "The Predictability of Security Returns with Simple Technical Trading Rules." Journal of Empirical Finance, 5(4), 347–359.
Han, Y., Yang, K., & Zhou, G. (2021). "Technical Analysis in the Era of Big Data." *Review of Financial Studies*, 34(9), 4354–4397.
Jegadeesh, N., & Titman, S. (1993). "Returns to Buying Winners and Selling Losers: Implications for Stock Market Efficiency." *Journal of Finance*, 48(1), 65–91.
Lo, A. W. (2004). "The Adaptive Markets Hypothesis: Market Efficiency from an Evolutionary Perspective." *Journal of Portfolio Management*, 30(5), 15–29.
Moskowitz, T. J., Ooi, Y. H., & Pedersen, L. H. (2012). "Time Series Momentum." *Journal of Financial Economics*, 104(2), 228–250.
Neely, C. J., Weller, P. A., & Ulrich, J. M. (2009). "The Adaptive Markets Hypothesis: Evidence from the Foreign Exchange Market." *Journal of Financial and Quantitative Analysis*, 44(2), 467–488.
Neely, C. J., Rapach, D. E., Tu, J., & Zhou, G. (2014). "Forecasting the Equity Risk Premium: The Role of Technical Indicators." *Management Science*, 60(7), 1772–1791.
Park, C. H., & Irwin, S. H. (2007). "What Do We Know About the Profitability of Technical Analysis?" *Journal of Economic Surveys*, 21(4), 786–826.
Rouwenhorst, K. G. (1998). "International Momentum Strategies." *Journal of Finance*, 53(1), 267–284.
Zhu, Y., & Zhou, G. (2009). "Technical Analysis: An Asset Allocation Perspective on the Use of Moving Averages." *Journal of Financial Economics*, 92(3), 519–544.
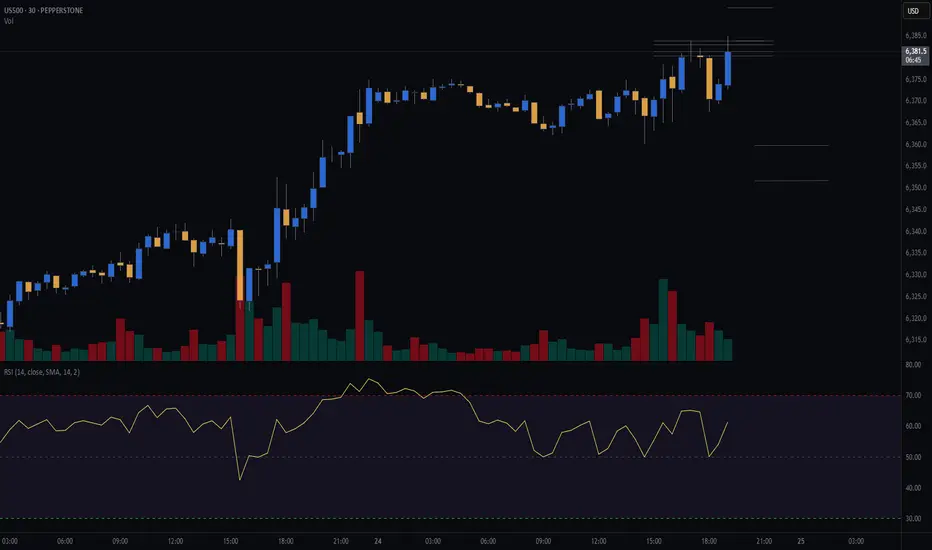
S&P (CASH500) SHORT - Double top 30minRisk/reward = 2.7
Entry price = 6384
Stop loss price = 6393.8
Take profit level 1 (50%) = 6359.8
Take profit level 2 (50%) = 6351.8
Will get confirmation of remaining variables at close of this 30min candle at 19.30.
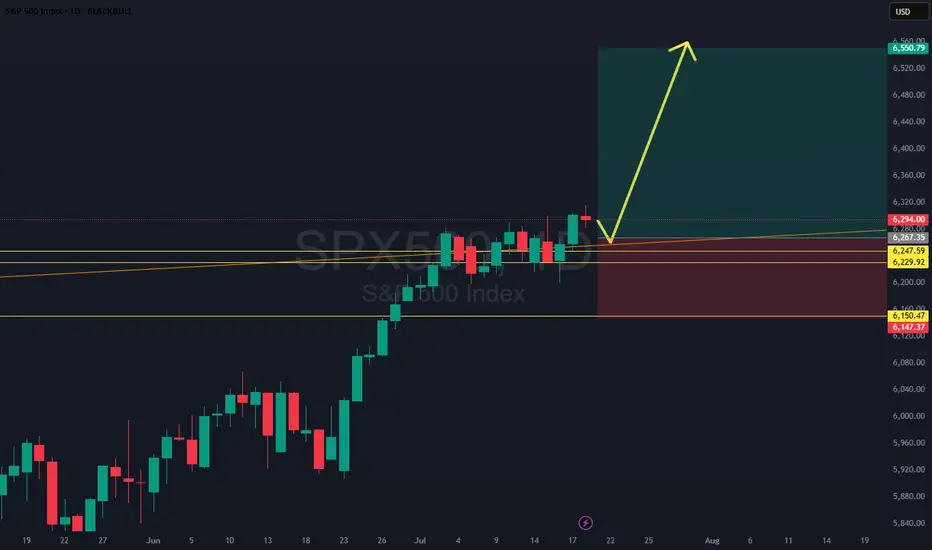
sp500 up to 6535sp500 with in my pov target to 6535 by a flag created maybe and with this super upside trend for these days

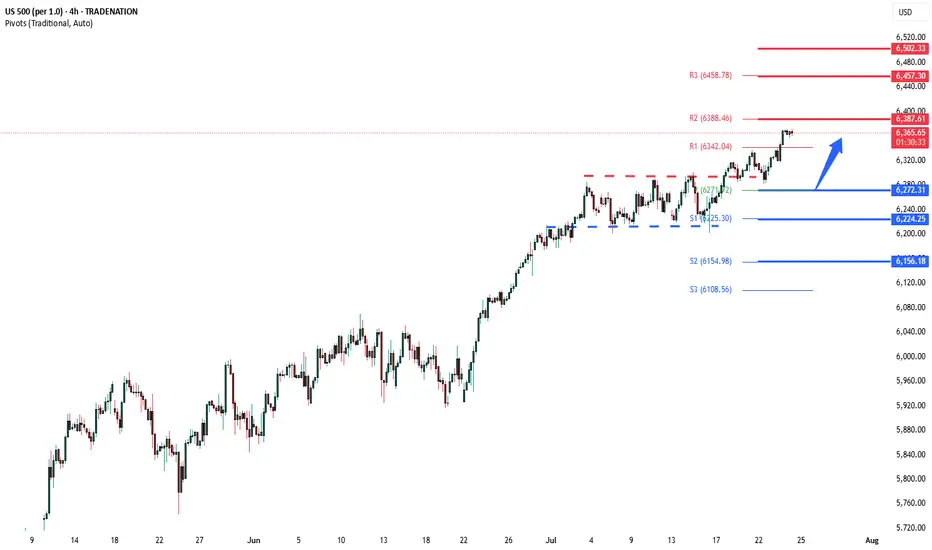
S&P500 INDEX (US500): Bullish Trend Continues
US500 updated a higher high this week, breaking a resistance
of a bullish flag pattern on a daily time frame.
I think that the market will rise even more.
Next goal for the bulls - 6359
❤️Please, support my work with like, thank you!❤️
I am part of Trade Nation's Influencer program and receive a monthly fee for using their TradingView charts in my analysis.

BuyRejection Level
Daily Volume
Market Structure Shift
London US Session
Trend Line Break
Untapped Order Point
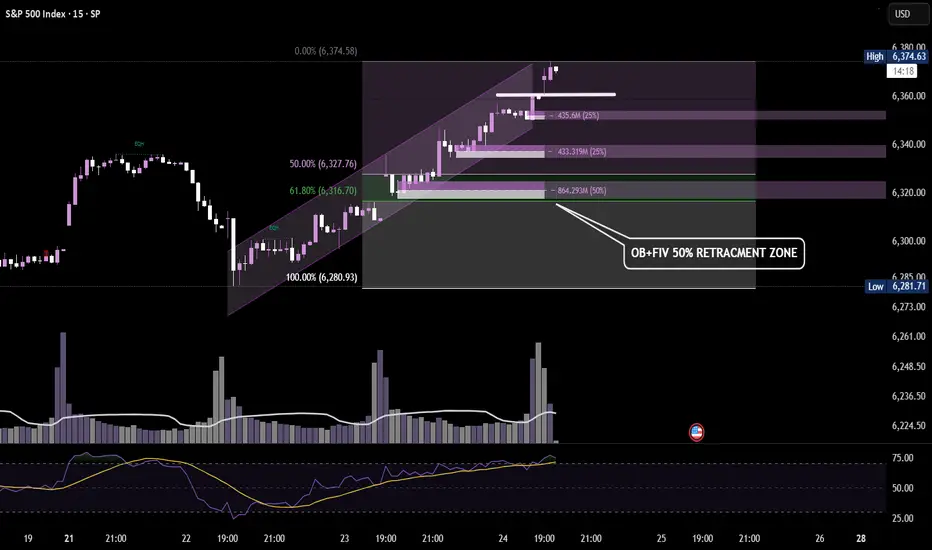
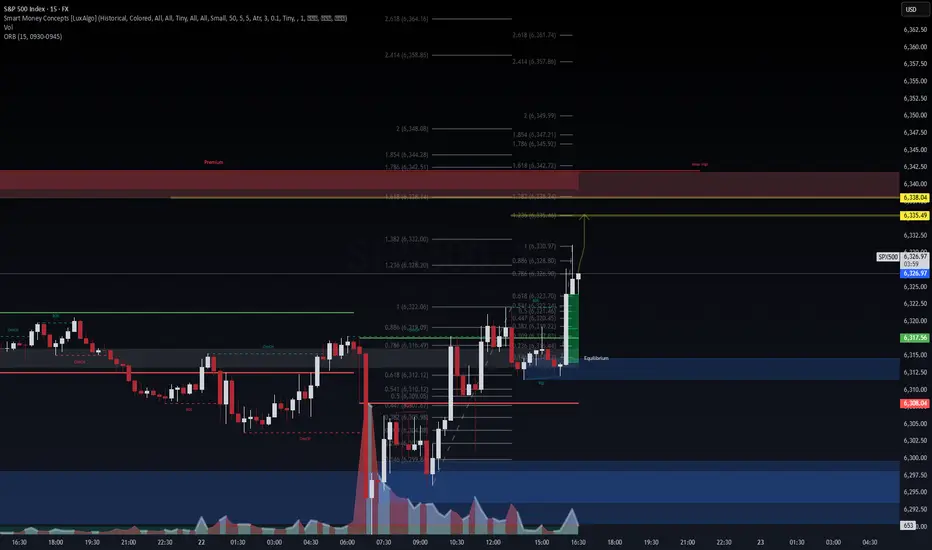
S&P 500 – 15Min Chart BreakdownPotential retracement zone aligning with Order Block + 50% FIB.
Watching for bullish reaction near 6320–6316 — key confluence zone for a possible continuation leg. 🔁📈
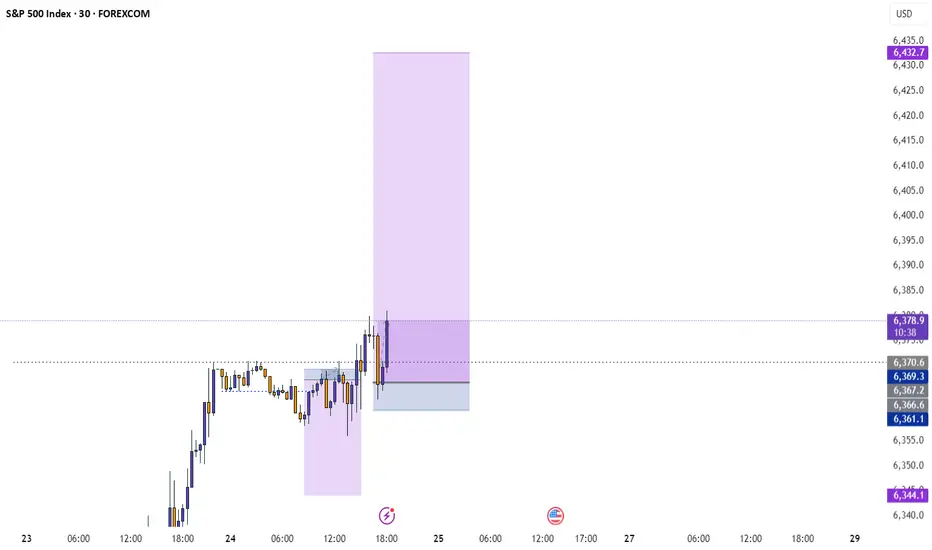
S&P500 push to new ATH? Key Developments:
AI Drives Earnings Momentum
Alphabet reported strong results, but flagged surging AI infrastructure costs, signaling increased capex ahead.
SK Hynix posted record earnings and committed to expanding AI-related investments, reinforcing the sector’s critical growth role.
Investor sentiment remains AI-positive, with capital rotation favoring tech and semiconductors despite margin compression risks.
Banking Sector Boosted by Tariff-Driven Volatility
Deutsche Bank’s FIC (Fixed Income & Currencies) trading revenue jumped 11% to €2.28B, its best Q2 since 2007, aided by global trade uncertainty.
BNP Paribas also beat earnings estimates, continuing the strong showing from European banks amid market volatility.
Trade & Tariff Watch
The EU and US are nearing a deal on a 15% standard tariff rate, potentially stabilizing trade flows and market pricing.
Trump’s broader reciprocal tariff push remains in focus, especially after the US-Japan deal. Investors are watching for signs of escalation or resolution with other partners like the EU and Canada.
Fed in the Political Spotlight
Trump visited the Fed’s construction site, criticizing costs and maintaining pressure on Chair Jerome Powell.
Speculation about Fed leadership changes and political interference is unsettling, though markets have largely shrugged this off for now.
Meanwhile, House Republicans are drafting a follow-up tax-and-spending plan, which could shape future fiscal policy and market expectations.
Conclusion: S&P 500 Trading Outlook
The S&P 500 remains buoyed by strong earnings, particularly from AI-linked sectors and financials, while geopolitical risks and tariff volatility are being absorbed as catalysts for trading profits rather than panic.
Bullish factors: Strong corporate earnings (Alphabet, SK Hynix, Deutsche Bank), potential trade de-escalation (EU-US tariff deal), and AI momentum.
Risks to monitor: Rising AI capex (impact on margins), political tension around the Fed, and tariff uncertainty.
Key Support and Resistance Levels
Resistance Level 1: 6387
Resistance Level 2: 6457
Resistance Level 3: 6502
Support Level 1: 6272
Support Level 2: 6224
Support Level 3: 6156
This communication is for informational purposes only and should not be viewed as any form of recommendation as to a particular course of action or as investment advice. It is not intended as an offer or solicitation for the purchase or sale of any financial instrument or as an official confirmation of any transaction. Opinions, estimates and assumptions expressed herein are made as of the date of this communication and are subject to change without notice. This communication has been prepared based upon information, including market prices, data and other information, believed to be reliable; however, Trade Nation does not warrant its completeness or accuracy. All market prices and market data contained in or attached to this communication are indicative and subject to change without notice.
SellRejection Level
Daily Volume
Market Structure Shift
London Session
Trend Line Break
Untapped Order Point

SPX - Time for a correction? To make it very simple,
Prices have been going up very nicely those last few weeks and months.
Everyone is happy but as we know that can't last.
NASDAQ:OPEN seems to be the latest pump and dump and it's just another sign of a coming correction imho.
Most stocks I've been following have reached resistance zone, levels where profit taking is very likely.
$S&P500 seems to have made a fifth wave, RSI divergence is present and confirming that.
It's difficult to pinpoint the exact top of course so I'm giving myself some leeway and use a small 1% stop loss in this case.
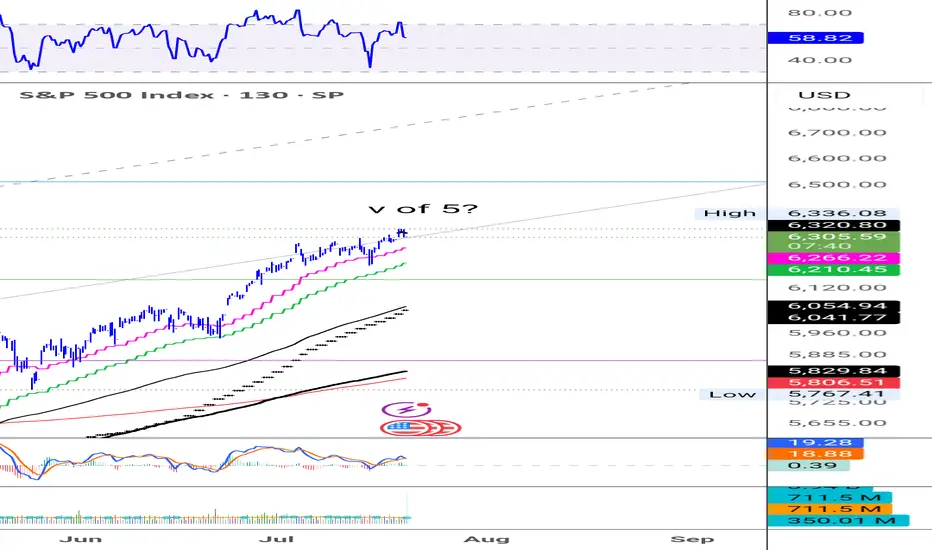
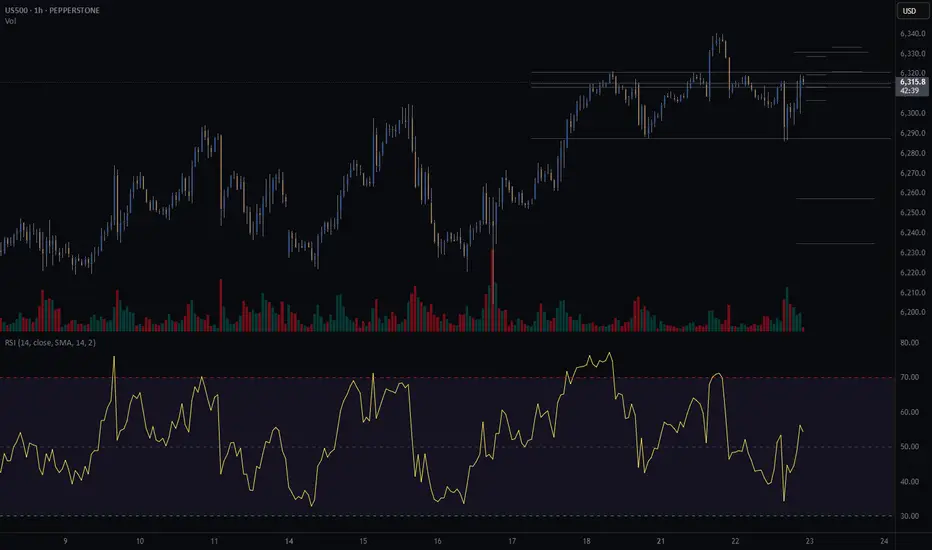
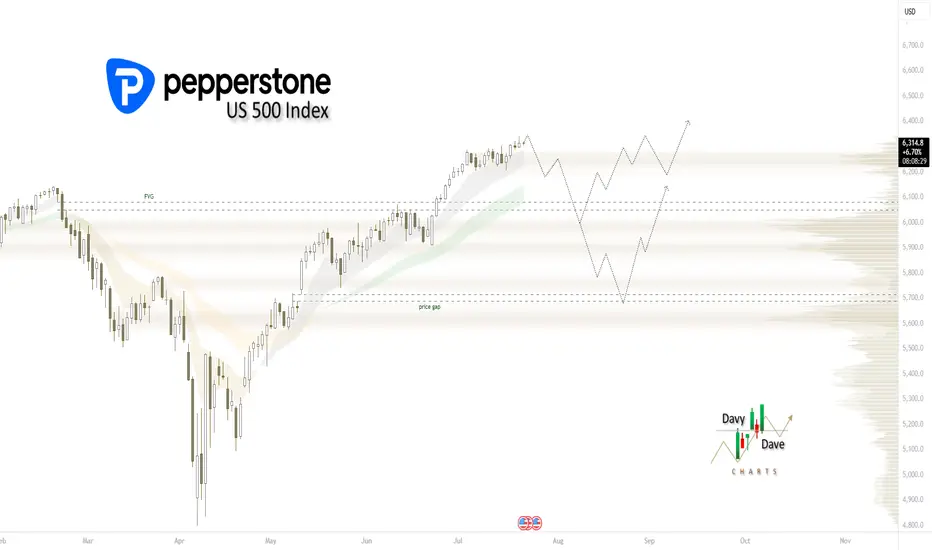
Market Breadth Flashes Warning, but S&P 500 Still Holds SteadyThe S&P 500 continues its slightly positive movement. However, the momentum has been slowing, forming a long, wedge-like pattern. These long wedges have been a recurring feature in the stock market for years. From the monthly timeframe to the 1-hour chart, the market often forms wedges.
Wedge formations tend to break to the downside but can persist for a long time before doing so. The S&P 500 typically makes a sharp correction selloff, then recovers in a "V" shape, followed by the formation of another wedge. This pattern appears to be repeating once again. Still, there are some negative signals that traders should be aware of:
1- The impact of tariffs on growth remains a major unknown. Most tariff deals have not been finalized yet. While the Japan agreement is a positive step, negotiations with the EU will be more significant.
2- Many earnings reports will be released in the coming weeks, potentially shaping market sentiment. These earnings will reflect some of the tariff effects. AI and tech remain the key market drivers, so their results will be especially important.
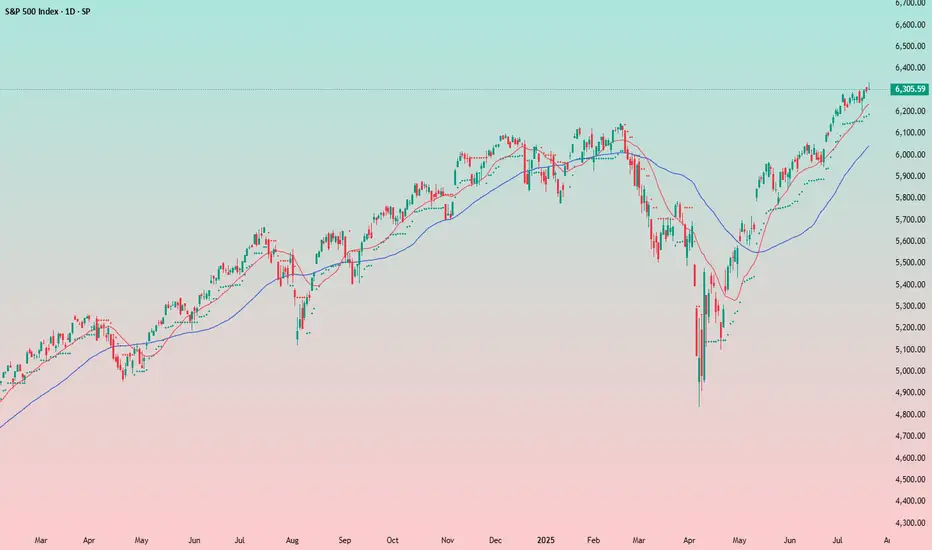
3- Some breadth indicators are showing early warning signs. One of the most useful is the "percentage of stocks above the 200-day moving average." This metric shows whether the market is broadly participating in the rally or being driven by a few large-cap names. Typically, when the market weakens, traders rotate into mega caps. The rounded numbers below shows the weakness:
March 2024 Top: 5250 - Percantege Above 200 MA: 85%
July 2024 Top: 5675 - Percantege Above 200 MA: 80%
December 2024 Top: 6100 - Percantege Above 200 MA: 74%
July 2025 Current: 6309 - Percantege Above 200 MA: 66%
This shows that fewer and fewer stocks are managing to stay above their 200-day moving average while S&P making new highs. This is not an immediate red flag, but the weakening is apparent.
In summary, the slightly positive outlook remains intact for now and is expected to continue until the wedge breaks with some early warning signs. If that happens, a sharp selloff may follow, creating both selling and buying opportunities. In the short term, 6280 is the immediate support level to watch.
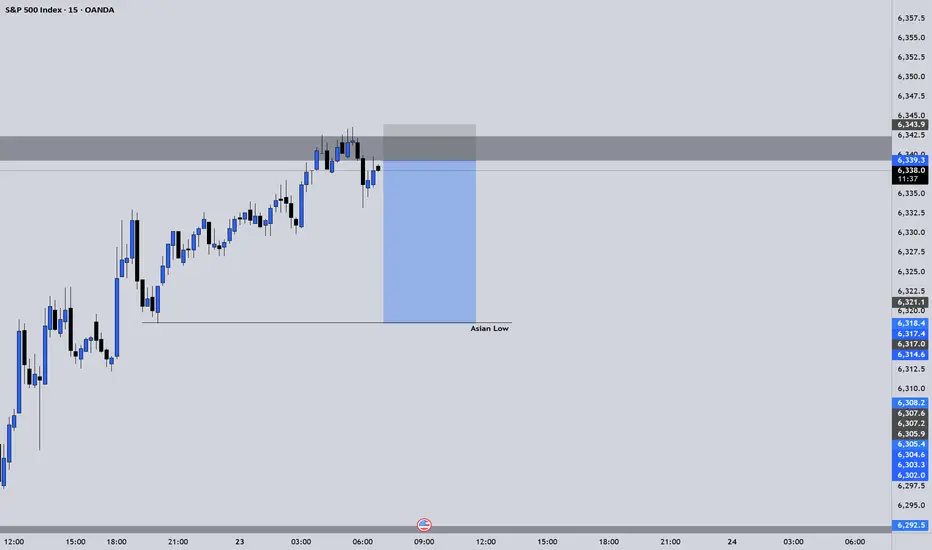
SPX500 ShortElite Analysis
This was a discretionary trade
Price came to structural liquidity
Executed trade on 5m
Targeting Asian low LP.
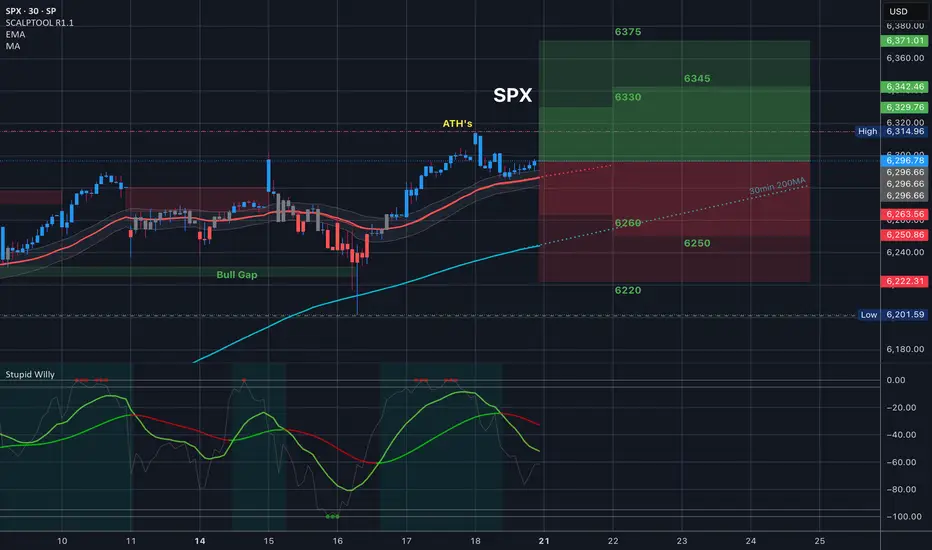
SPX: Banks beat, stocks peakThe US equity markets remained relatively resilient this week, despite ongoing concerns about trade policy developments. After last week’s slight retreat from its all-time high, the S&P 500 resumed its upward momentum early in the week, continuing to hover near record levels. The index reached a new highest level of 6,315 on Friday before pulling back slightly, closing the week at 6.296.
Bank earrings were in focus of investors during the previous week. Overall, Q2 reports from major U.S. banks showed resilience — better-than-expected earnings, strong interest income, and robust capital actions. So far, the finance sector has seen Q2 earnings rise around 13% y/y and 3,4% revenue growth. In addition, a stress test posted by Fed underpin confidence as all major banks, including JPMorgan and Citi showing resilience also under potential stress conditions. However, both bankers and investors held a cautious tone on macro/public policy risk.
Investors' confidence was additionally boosted by better than expected US macro data posted during the previous week. The inflation rate in June was 0,3% for the month and 2,7% on a yearly basis. At the same time, retail sales beat market expectations with an increase of 0,6% in June. As per analysts reports, currently 27 stocks included in the S&P 500 are trading at the all time highest levels. The ADM company, which is well known for producing Coca Cola, had a drop in the value of shares of 2% after the US President requested from the company to use real cane sugar in their popular drink.
From July 23st a composition of companies included in the S&P 500 index will be changed. A crypto company Block will be included, while the company Hess will be excluded from the index. Shares of the Blok surged by 10% on Friday, after the release of the news.

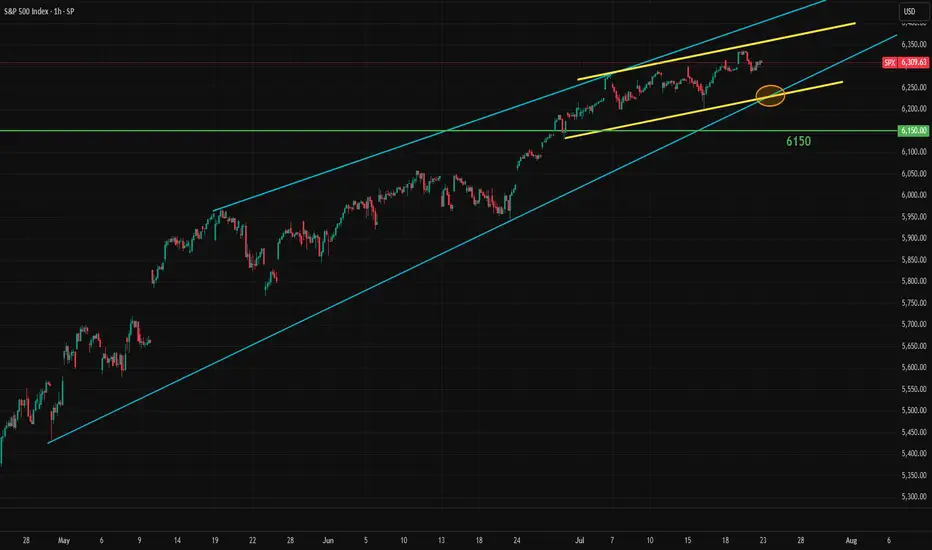
If we want a 2020-2021 style run, we need a seasonal pullbackUS 500 Index SP:SPX AMEX:SPY AMEX:VOO August seasonal scenario: institutional participation remains light, being outperformed by leveraged dip buying retail. How long can they remain on the sidelines, missing opportunities for their clients, before FOMO kicks in? Remember that institutions aren't emotionally driven, unlike their retail counter parts. That being said, they're itching to get in. What will compel them? IMO, a 5% pull back will incentivize them to buy. The August seasonal pull back may provide just that opportunity. If it comes, what happens in late Q3 and the rest of Q4 will likely be similar to 2020-2021. The deeper the pull back, the more impulsive it will likely be, as retail and institutions will be temporarily in tandem. SP:SPX PEPPERSTONE:US500 AMEX:SPY AMEX:VOO
Waiting for a Clear Signal: Too Early to Short the IndexNothing interesting is forming on the index so far.
My outlook remains neutral.
I previously attempted to short it, but those attempts were unsuccessful. Now I need to wait for a more reliable entry point — the chart will show the way.
For now, I’m staying on the sidelines.
Historically, the start of the Fed’s rate-cutting cycle has always coincided with the beginning of a decline in the stock market. I believe this time won’t be an exception — but for now, it’s too early to short.
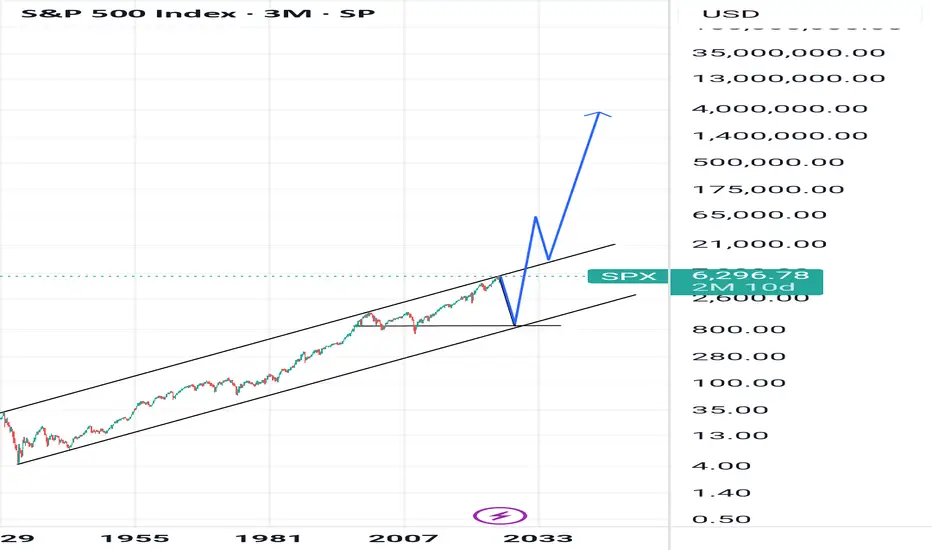
Things are about to get wild. Just for fun... Hey, it can happen... right? 🤔😉
85% drop then.. hyper inflation.
S&P bearish div on the dailySuspiciously... the market is correcting today before Powell has opened his mouth.
Bearish div on the daily chart above ATH's
Big correction coming?

US500 Swing short tradeUS500 index is on the verge of major drop. I expect the price to sink in the coming weeks, that's why this will be a swing trade. I expect to reach my main target of $6000 around mid/end of August, with a second short entry once we will start to drop and retrace till my key level.

$SPX Trading Range for 7.21.25 and everything in itToday’s Trading range and everything in it. How are you playing it?
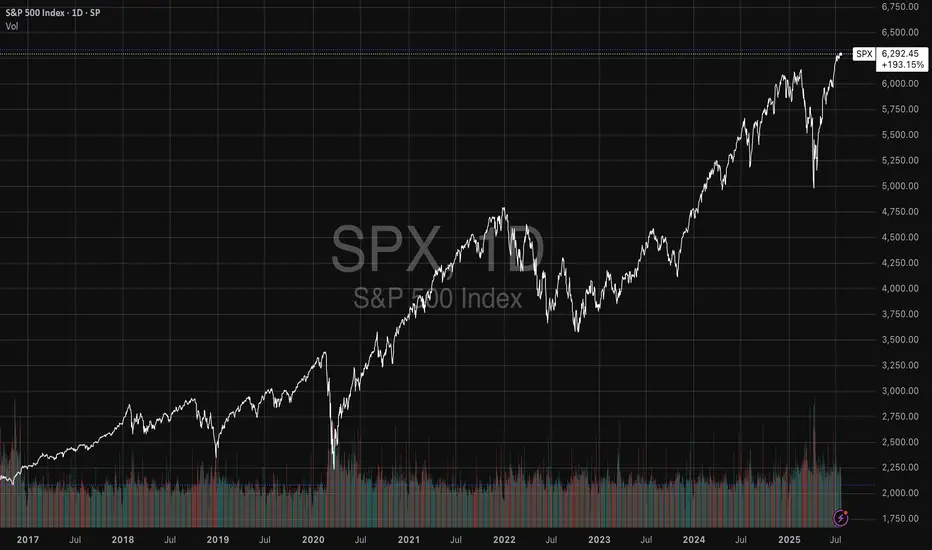
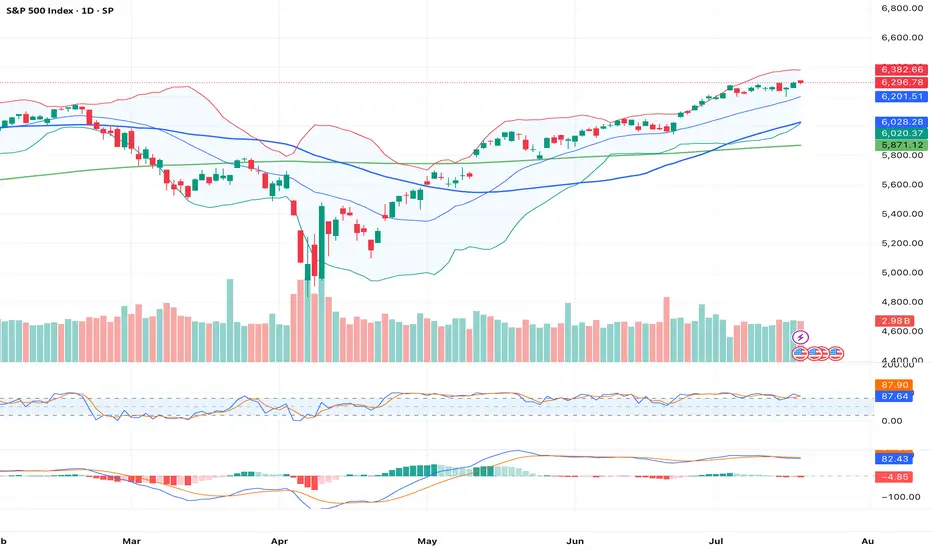
1_Day_ChartThis chart represents the 1-day (Daily timeframe) price action of the S&P 500 Index (SPX), offering a focused view of market sentiment, key levels, and trend momentum as of . Each candlestick reflects a full trading day.
📊 Chart Parameters:
Instrument: S&P 500 Index (SPX)
Timeframe: 1D (1-Day)
Exchange: NYSE / NASDAQ Composite (tracked as index)
Date Range Displayed: Past 3–6 months (approx.)
SPX500: Clean Breakout Setup - Trade of the Week?SPX500 just broke and closed above a key daily level, confirming strength after a bull flag formed off a skinny leg up. The plan? Wait for a retest of that flag structure, then ride momentum higher. We’ve got a conservative stop below solid support, making this one of the cleanest, most technically sound setups of the week. Only watch-out: price may not give the retest and could continue running. Either way, structure favors the bulls.