SPX -TINAUnlimited money sloshing around means no end to upside in the markets. When the Fed finally lowers interest rates, all markets will go crazy. Calling for 7,500. Go big!!
USSP500CFD trade ideas

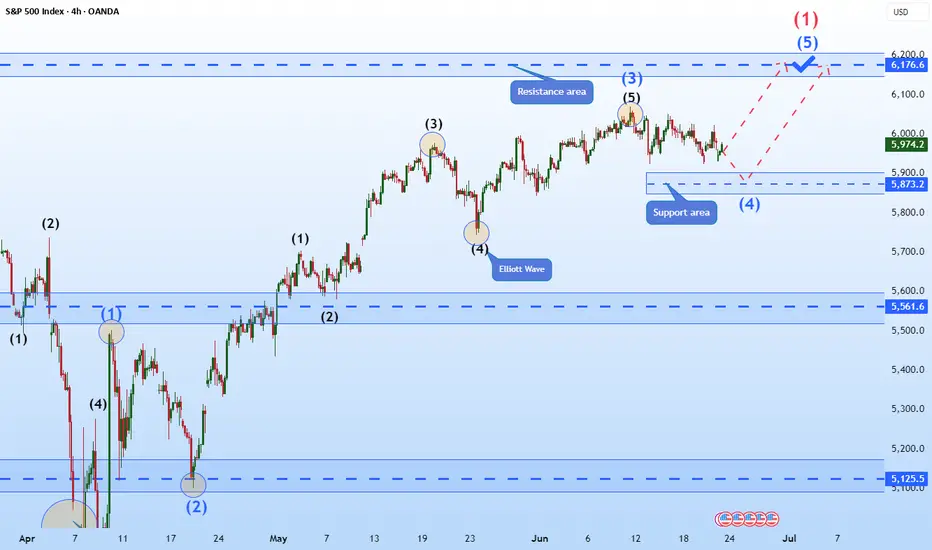
Hellena | SPX500 (4H): LONG resistance area of 6176 (Wave 1).Colleagues, the previous forecast remains essentially unchanged, and the target is still 6176, but I think the forecast can be updated because the price has been flat for quite some time.
I still expect the upward movement to continue in the large wave “1” and in the medium-order wave “5”.
A small correction to the support area of 5873 is possible.
Manage your capital correctly and competently! Only enter trades based on reliable patterns!
S&P500 and Nasdaq Short: Wave 5 <= Wave 3Based on the Elliott Wave rule that wave 3 is not the shortest wave, I gave a projection on where the peak of both S&P500 and Nasdaq could be. Based on these peaks, the stop is set above and the take profit target is where wave 4 was.

S&P. Has been struggling to keep a full bull/bear run.Setting todays fib circle I think it's going to balance out. especially with the fin levels.
Not just because of july.

SPX500 Macro Fibonacci Projection – Eyeing 7190+ 🗓️ Posted by Wavervanir International LLC | June 26, 2025
The S&P 500 continues to respect key Fibonacci zones on the macro scale. After a strong recovery from the recent correction near the 0.5–0.618 retracement region (4800–5100), price is now hovering near critical confluence at the 1.0 level (~6150).
We’re tracking a bullish extension path toward 1.382 and 1.618 Fibonacci levels, which gives us a primary upside target zone between 7,190 and 7,795 — aligning with the projected long-term wave expansion. This structure favors a continued institutional accumulation phase, supported by macroeconomic resilience and liquidity conditions.
🔶 Key Levels to Watch:
Major Support: 4838.28 (0.5 Fib Retest)
Immediate Resistance: 6170–6200
Target Range: 7190.71 → 7795.41
🧠 Bias remains bullish unless price breaks back below 5830 with volume.
This is not financial advice. Shared for educational and strategic insights.
Let me know your thoughts, traders!
—
#SPX500 #Fibonacci #WaverVanir #MacroTrends #StockMarket2025 #QuantitativeAnalysis

S&P 500 , UPDATE CHART Uptrend
I closed all my open positions when the price was near the All-Time High (ATH) and observed a bearish candle at the end of June 11th. Now, the chart is attempting to break the resistance (S/R) level again. However, I've noticed a divergence between the main chart and the Awesome Oscillator (AO), which leads me to believe we will either see a correction below this level or a pullback after a potential breakout. I am waiting for one of these scenarios to materialize before re-entering with new buying positions.

S&P 500 - Fibonacci Resistance Intermediate wave (5) up from the 04/07/25 bottom could be nearing completion.
Minor wave 5 of (5) is close to a Fibonacci relationship with Minor wave 1.
Using leeway around the 6,208 target gives a broad zone of 6,175 to 6,220. The SPX could reach this zone on 06/27/25.

52 W hi Capitalize on the around-the-clock liquidity of S&P 500 futures , and take advantage of one of the most efficient and cost-effective ways to gain market exposure to a broad-based, capitalization-weighted index that tracks 500 of the largest companies of the US economy
they'll losing they pants. we're selling gang
!!!!!!!!! Lol


Is Now a Good Time to Invest in the S&P 500? Is Now a Good Time to Invest in the S&P 500?
The chart shows the S&P 500 in a long-term upward trend, with clear channels indicating zones from "extremely cheap" (bottom green line) to "extremely expensive" (top red line). Currently, the index is trading near the upper part of the channel, in the "expensive" to "extremely expensive" area.
What Does This Mean for Investors?
The current price level suggests the S&P 500 is expensive compared to its historical trend, increasing the risk of a short-term correction.
Historically, buying near the top of such channels has offered less margin of safety and a higher probability of pullbacks in the following months.
Investment idea
It is a good time to start investing gradually (using a dollar-cost averaging strategy, investing a fixed amount each month) rather than making a lump-sum, “all-in” investment with your savings.
This approach allows you to benefit from long-term market growth while reducing the risk of entering at a market peak.
The risks currently outweigh the potential short-term gains, and we could see better prices in the coming months.
In summary:
Now is not the time to go all-in on the S&P 500. Gradually investing each month is a sensible approach, given the elevated risk of a correction and the possibility of better entry points ahead.

Bearish Wolfewave set upPrice has gone above the 1-3 line.
Short signal is when price enters back below the 1-3 line.
Target will be the 1-4 line.
Alternative targets are the magic lines.
An earlier entry is when the hourly SAR moves above price.
Earlier clues could be seen on the shorter timeframes.
Patterns can fail.
Do your own due diligence.

Market crash looming - Fractal Echo of 2007 - 2025 S&P 500 In what other case could the "market" be here if it wasn't centrally rigged?
Geopolitics aside. The 2025 vs. 2007 numerological equivalence ("9" year) shows the power of 9 taking over: the end of a rigged bull market.
Chart overlays the S&P 500 price action from 2023–2025 (white line) with that of the 2006–2008 pre-GFC period (red line), highlighting an uncanny fractal similarity in structure, tempo, and momentum. The visual suggests that 2025 (numerologically marked as a “9” year, like 2007) may be echoing the same setup seen before the 2008 financial crisis: just massively worse.

S&P500 Bullish breakout support at 6040 The US dollar hit a three-year low and Treasury yields declined after reports suggested Donald Trump may replace Fed Chair Jerome Powell earlier than expected. Investors interpreted this as a sign that rate cuts could come sooner, adding uncertainty to the outlook for the dollar and US bonds—already under pressure from tariff concerns and a growing fiscal deficit.
Oil Sector:
Shell ruled out a takeover bid for BP, putting to rest speculation of a potential mega-merger between the two energy giants. Despite BP's weak stock performance and activist pressure, Shell appears unwilling to pursue a deal.
Corporate Highlights:
Nvidia shares hit a record high, once again becoming the world’s most valuable company.
Xiaomi launched its first electric SUV, the YU7, aiming to challenge Tesla’s Model Y.
Shell denied reports of merger talks with BP, reaffirming its current strategy focus.
Key Support and Resistance Levels
Resistance Level 1: 6145
Resistance Level 2: 6178
Resistance Level 3: 6210
Support Level 1: 6040
Support Level 2: 6010
Support Level 3: 5978
This communication is for informational purposes only and should not be viewed as any form of recommendation as to a particular course of action or as investment advice. It is not intended as an offer or solicitation for the purchase or sale of any financial instrument or as an official confirmation of any transaction. Opinions, estimates and assumptions expressed herein are made as of the date of this communication and are subject to change without notice. This communication has been prepared based upon information, including market prices, data and other information, believed to be reliable; however, Trade Nation does not warrant its completeness or accuracy. All market prices and market data contained in or attached to this communication are indicative and subject to change without notice.

DXY, EURUSD & SP500 Daily Trade SetupsIn this update we review the recent price action in the Dollar, Euro & SP500 and identify the next high-probability trading setups and price objectives to target. To review today's video analysis, click here!

SPX500 Holds Above 6,098 | Bullish Bias Toward ATH at 6,143OANDA:SPX500USD OVERVIEW
S&P 500 Futures Subdued After Near-Record Close | Market Eyes Powell’s Comments
U.S. stock futures were muted on Wednesday after the S&P 500 closed near an all-time high, following signals from Israel and Iran that their air conflict has ended.
Investors now await further comments from Fed Chair Jerome Powell for clues on the monetary policy outlook.
TECHNICAL OUTLOOK – SPX500
The price remains in a bullish trend as long as it trades above 6,098, with upside potential toward the ATH at 6,143.
However, a 1H or 4H candle close below 6,098 would likely trigger a bearish correction toward 6,056 and 6,041.
Pivot Level: 6,098
Resistance Levels: 6,143 → 6,175 → 6,210
Support Levels: 6,066 → 6,041

S&P500Current COT data supports a bearish or cautious outlook on the S&P 500. Current Bias: Bearish / Cautiously Negative

SPX is overheated, a correction is necessary📉 Market Update: No, It Has Nothing to Do with Trump
This move has nothing to do with Trump’s dramatic announcements. The reality is simple: the MACD on the daily chart is overheated, and a healthy correction is needed — likely down to the 5,520 level — before resuming the uptrend.
Now, does it surprise anyone that Trump acts like a PR agent for his investors? He always seems to drop “bad news” at the exact moment the charts call for a pullback. My guess? They're shorting right now.
🪙 Bitcoin Stalling
CRYPTOCAP:BTC is also losing momentum, and looks like it’s in need of a short-term correction as well. This suggests a week of consolidation ahead for the whole crypto market.
But let’s be clear:
🚀 The Bull Market Is Not Over
The weekly charts remain very bullish, and this trend could last another 4–6 months. The macro bullish structure for crypto remains intact.
However, in TradFi, there are cracks:
🔻 20-year bonds sold at 5.1% — a major recession red flag
💸 Tariffs are putting pressure on global trade
📉 The entire traditional market is starting to de-risk
🔮 What to Expect
Short-term correction to ~5,518 (first bottom target)
A possible rebound after healthy consolidation
A continued uptrend in crypto unless key support breaks
I’ll publish a new update when conditions change.
📌 Follow me to stay ahead of the market. And as always: DYOR.
#CryptoMarket #Bitcoin #MACD #TechnicalAnalysis #CryptoCorrection #BullishTrend #RecessionWarning #TradFi #Altcoins #BTC #MarketUpdate #TrumpEffect #DYOR

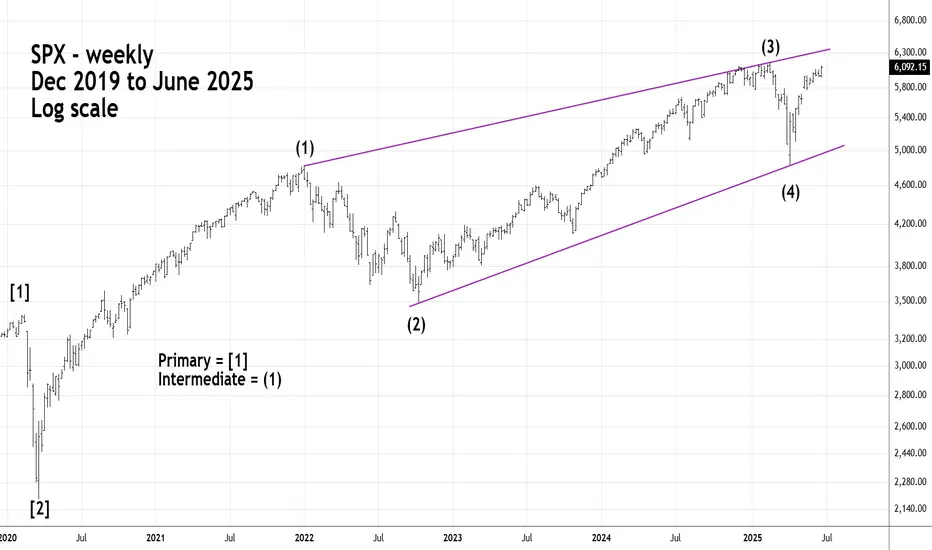
Long - Term S&P 500 - Elliott Imulse WaveThe S&P 500 - (SPX) could soon complete a five - year Elliott Impulse wave that began in March 2020.
Fibonacci resistance is in the SPX 6,200 area which could be reached on 06/26/25 or 06/27/25.
Nasdaq All-Time Highs, S&P Close, Blast Off or Breakdown?What an incredible melt-up since April 7 lows in the US markets.
Trump vs Musk - ignored
Iran vs Israel - ignored
High Valuations - ignored
FED Pausing - ignored
The US economy is resilient and it's a good thing because the world is performing really well (EX-US). Europe/China/India/Emerging Markets are outperforming the US by 15-16% YTD
The USD is having one its worst years ever in 2025
Gold, Silver, Bitcoin are great diversifiers in my opinion for 2025
Oil prices are incredibly volatile and energy stocks and commodities in turn are showing
volatility and big swings
As we near end of month and end of Q2, I have to believe the market is due for a small pause or pullback sooner rather than later - but we'll see
Thanks for watching!!!

Your investor profileEach investor has unique characteristics:
The amount of their current investments and savings
Their capacity to generate future income and allocate it to savings
Their personal and financial circumstances that may condition their liquidity needs
Their motivations and objectives for saving
Their discipline
Their willingness to learn
The time available for monitoring
Their knowledge and experience
Their risk aversion
All these characteristics are called investor profile .
Unless all these characteristics of your profile change, you must stay true to your investor profile. Bullish market environments are a temptation to take on more risk than we should.
It is also important to keep in mind that your investor profile changes with your life cycle .
While it’s great to share experiences, your investor profile is unique . When making your decisions, take advice based on your individual characteristics.
It is very important that you seek advice from trusted platforms and professionals and pay special attention to ensure that there is no clear commercial bias that could lead you to certain products or operations that may not suit your investor profile.
It is not a wise decision to copy from others : friends or forums created by entities with an obvious commercial bias, because your investor profile is unique.
Did you like it? Share with your friends.
by HollyMontt

rePOST - SPX Weekly Technical Breakdown – Week of June 22, 2025
SPX
Weekly Technical Breakdown – Week of June 22, 2025
After consolidating in a tight range earlier this month,
SPX
printed a subtle but significant outside day on Friday — breaking Thursday’s high by just 0.01 and forming a broadening formation. Like
QQQ
, this pattern reflects indecision and a potential shift in structure as bulls and bears battle for control. The short-term range is wide, with support at 5963.21 and resistance near 6026.68. Holding above 5963 can keep buyers in and opens the door for a retest of the psychological 6000 level, followed by 6059.40 (all-time high). However, a close back below 5963.21 could open the path for a quick flush toward 5900. Key intraday levels to watch include 5929, 5940.03, 5954.06, 5974.86, 5989.43, 6002.32, 6012.94, 6026.68, 6044.56, and 6059.21.
Technical Summary
• Structure: Outside day Friday formed a broadening formation
• Event Note: Slight break of Thursday’s high by 0.01 confirms outside bar structure
• Daytrade Pivots: 5929, 5940.03, 5954.06, 5974.86, 5989.43, 6002.32, 6012.94, 6026.68
• Macro View: SPX improves technically above 6000; breakout confirmed over 6026.68
• Downside Risk: Failure to close above 5963.21 could trigger fast move toward 5900
• Momentum Bias: Neutral to bearish until 6000+ is reclaimed and defended
Key Levels to Watch
🟢 Upside Resistance: 5974.86, 5989.43, 6002.32, 6012.94, 6026.68, 6044.56, 6059.21, 6059.40 (ATH)
🔴 Downside Support: 5963.21 (must hold), 5954.06, 5940.03, 5929
Trade Plan
• Hold above 5963.21 keeps upside scenario intact — look for reclaim of 5974.86 and 6000+
• Close below 5963.21 flips structure and may accelerate toward 5929, possibly 5900
• Scalps remain viable near 5954–6002 using intraday reactions at key levels
Decision Map
🟩 IF SPX HOLDS ABOVE 5963.21 → reclaim 5974.86 → target 5989.43 → 6002.32 → breakout toward 6026.68 → 6059.40 (ATH)
🟥 IF SPX BREAKS BELOW 5963.21 → watch 5954.06 → 5940.03 → 5929 → 5900 possible flush
Primary Trade Zone: 5954–6002
Alert Levels
Set alerts above: 5974.86, 6002.32, 6026.68
Set alerts below: 5963.21, 5940.03, 5929
This Week’s Key Catalysts for
SPX
This week’s economic calendar is packed with market-moving data that will likely influence
SPX
and broader risk appetite.
• Tuesday, June 24: Fed Chair Powell testifies to the House Financial Services Committee. His tone and guidance on future policy will be a primary driver for market direction. The same day also includes Consumer Confidence (June) and Fed commentary from Cleveland Fed President Beth Hammack — both potentially impactful.
• Thursday, June 26: Heavy data day with initial jobless claims, durable goods orders (May), core goods data, and the second revision of Q1 GDP. These reports will offer insight into both the labor market and the broader health of the U.S. economy.
• Friday, June 27: The most important inflation data of the week arrives with the PCE index and Core PCE (May). These are the Fed’s preferred inflation gauges and could shape expectations for a rate cut later this summer.
Overall, market participants will be closely watching Powell’s tone, inflation data, and any sign of slowing growth. Combined with Friday’s outside day and broadening structure,
SPX
is positioned for a move — the catalyst will determine the direction.

S&P500 1D Golden Cross, middle of 3y Channel, much upside to go!The S&P500 index (SPX) has been trading within a Channel Up since the final sell-off of the 2022 Inflation Crisis. The only time this pattern broke was for 4 days during the bottom formation (April 2025) of the recent Trade War.
Ahead of the first 1D Golden Cross since January 26 2023, the market looks more bullish than ever as it is trading within the 0.5 - 0.618 Fibonacci range of this Channel Up, suggesting that there is considerable upside before it tops.
The last Bullish Leg that started on the Channel Up bottom and peaked before a 1D MA50 (blue trend-line) test grew by +28.30%. Expecting a repeat of that, we may see the price targeting the 0.786 Fibonacci level at 6550 before the next 1D MA50 pull-back.
-------------------------------------------------------------------------------
** Please LIKE 👍, FOLLOW ✅, SHARE 🙌 and COMMENT ✍ if you enjoy this idea! Also share your ideas and charts in the comments section below! This is best way to keep it relevant, support us, keep the content here free and allow the idea to reach as many people as possible. **
-------------------------------------------------------------------------------
Disclosure: I am part of Trade Nation's Influencer program and receive a monthly fee for using their TradingView charts in my analysis.
💸💸💸💸💸💸
👇 👇 👇 👇 👇 👇

SPX500 Short There are multiple patterns on M15 and H1
All timeframes up to H4 are overbought
There are multiple double tops with divergence
This is at the all-time high, suggesting there will be a lot of resistance
Markets look like they are due for a drop after such a sharp move up\
Stop loss above 6130
