TradeCityPro | Bitcoin Daily Analysis #140👋 Welcome to TradeCity Pro!
Let’s dive into the Bitcoin analysis. Yesterday, the interest rate decision by the US Federal Reserve was announced, and once again, just like the past few months, it remained unchanged. Let’s see what impact it had on Bitcoin.
⏳ 4-Hour Timeframe
In the 4-hour timeframe, after the announcement of the unchanged interest rate and Powell’s speech, Bitcoin printed a red candle on the support zone and even wicked lower, but then recovered and the price returned back into the box.
✔️ Basically, we can say that this month’s rate decision had no real impact on the market, and Bitcoin is still moving inside its range box. The fact that the support zone wasn’t lost is a positive sign for the continuation of the trend.
⭐ But the important point is this: if the uptrend is going to continue, the price must print a higher high or at least a level equal to 120041, and in my opinion, if for any reason a lower high gets printed, the chances of breaking below 116829 significantly increase.
📊 I currently have no new position on Bitcoin, and all my entries are below 110000. But if 120041 breaks, I’ll open a long position for the next bullish wave that Bitcoin might start.
💥 A major trigger for starting a new leg is the 61.67 level on the RSI. As long as RSI remains below this level, there’s no bullish momentum in the market — and considering that the number of touches to 116829 has increased, the probability of a correction is also rising.
❌ Disclaimer ❌
Trading futures is highly risky and dangerous. If you're not an expert, these triggers may not be suitable for you. You should first learn risk and capital management. You can also use the educational content from this channel.
Finally, these triggers reflect my personal opinions on price action, and the market may move completely against this analysis. So, do your own research before opening any position.
USTBTC trade ideas

BTC - Rising Wedge testing previous Channel highBTC has made a strong recent runup and is now testing the high side of a recent consolidation channel.
A Rising Wedge making higher highs and higher lows is pushing BTC into overbought territory and if the attempts at the previous channel high fails, with price falling through the lower wedge support line, there could be a period of bearish exhaustion to previous support zones.
BTC LONG till 123ki am late on posting this BTC is bullish
#LONG
BTCUSDT #LONG till 123k and move upwards Mark My words

BTCBitcoin in bull-trend so entry in any correction.
EN: 117.300
SL:115.790
TP: 119.000 - 121.000 - 122.777
please control risk management

BTC SHORT SETUP INTRADAY ( 02 AUG 2025 )If you have doubt on our trades you can test in demo.
Details:
Entry: 113,680 $ - 113,450 $
Target Price: 112,300 $
Stop loss: 114,370 $
Trade Ideas:
Idea is clearly shown on chart + we have some secret psychologies and tools behind this.
What is required to Join VIP?
- Nothing just you have to share 10% of your profit with us at the end of the month which you earned from our signals. Yeah this is just the requirement, trade where ever you like your favorite broker or else you don't need to pay fees first or create account thru our link.
Trade Signal:
I provide trade signals here so follow my account and you can check my previous analysis regarding BITCOIN. So don't miss trade opportunity so follow must.
BINANCE:BTCUSDT BINANCE:BTCUSDT.P BINANCE:BTCUSD

Bitcoin’s Next Move? ETH Heating Up & Altcoin Liquidity Shifthey I’m Skeptic,
in this one we’re looking at BTC’s breakout attempt, the good & bad signs in the daily candle, and why ETH & other alts are moving while BTC is ranging.
also sharing my triggers for both BTC & ETH, plus what I’m watching on BTC.D for the week ahead.
manage your risk, don’t fomo — peace out :)

Sellers – the final bastion
summery
We will analyze Bitcoin on the daily timeframe regarding this critical week
Analysis
A daily candle that has drilled through the heavy resistance level of 120,000 up to around 123,000 can only mean one thing: if the candle closes in this manner, I anticipate a healthy bullish move in the lower timeframes this week .
However, we must remember that today’s candle needs to close green, and tomorrow’s candle should never be a weak or small one.
Trade Plan
You should be ready to open positions in the lower timeframes tomorrow, but never forget risk and capital management!
Disclaimer
This content is purely analytical in nature and should not be interpreted as financial advice or a trading signal. All trading decisions and their outcomes are entirely the responsibility of the trader. The cryptocurrency market is highly volatile and may lead to the loss of part or all of your capital. Always conduct your own analysis and apply proper risk and capital management before entering any trade.
#Bitcoin #BTC #CryptoAnalysis #TechnicalAnalysis #CryptoTrading #TradingPlan #PriceAction #CryptoMarket #CryptoStrategy #RiskManagement #Altcoins #CryptoSignals #MarketAnalysis #DayTrading #SwingTrading

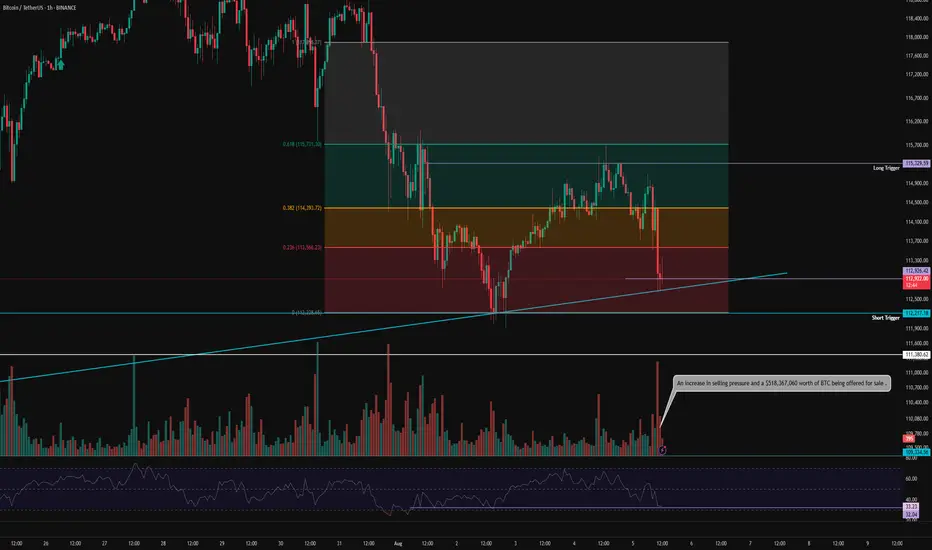
BTC - 1H Elliott Wave Analysis - 09.08.25Greetings and welcome to our next update for our Elliott Wave Count for Bitcoin.
The case is pretty much the same as yesterday in our last update so we'll try to keep it shorter today but feel free to check out our last analysis if you're interested in more details!
It'll be linked below in the notes :)
It is possible that we finished the green Wave 4 already and started moving up in the green Wave 5 but we think it is rather unlikely as the move up looks like a three wave move which indicates that it is corrective. It looks more like the correction extends a bit in the turquoise ABC a possibility we already mentioned yesterday.
We got the turquoise A in and the B was an overshooting Wave B and it seems we started working on the C Wave down. The targets for the turquoise Wave C are the 1 to 1 FIB at 116'164 USD, the 1.236 FIB at 115'753 USD, the 1.382 FIB at 115'499 USD which would also be in confluence with the 0.382 FIB of the Wave 4 support area and finally the 1.618 FIB at 115'088 USD which is right on top of the 0.5 FIB of the Wave 4 support area.
Keep in mind it still could be the bigger ABC displayed in red which would reset the green Wave 4 but we think the green count is more likely for now. First indication would be breaking the green Wave 4 support area.
Thanks for reading.
Would really recommend to check out the last analysis too for a better in depth view of the count and scenarios. :)
NO FINANCIAL ADVICE.

BTC: The Cycle isn't over! 175k-224k is the mark!!Taking our previous cycle fib levels, we can see we are having a similar stall at the 1.382 fib, before explosively making it's move to the extended 1.618 range and then some. With that said, we can safely attest to BTC reaching 175k to 224k. Nonetheless, once the upper trendline is reached, this should be the topping of this cycle. Thank you for taking your time to read this and I hope you have a wonderful day

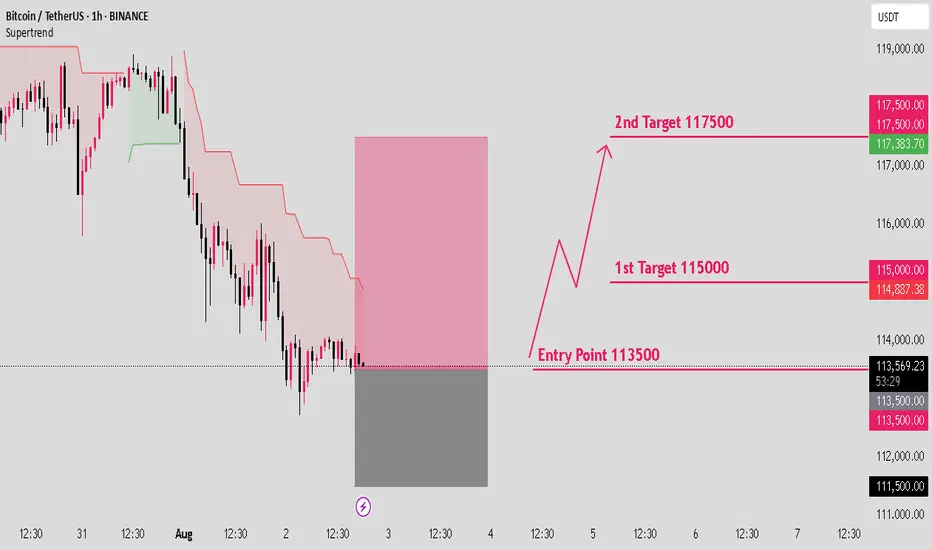
BTCUSD long setup: Targeting the next bull move.Hello IGT FOLLOWERS
Here is my BTCUSD overview, Bitcoin is showing bullish momentum after holding strong support near $112,000. A breakout above the $115000 resistance suggests buyers are regaining control. RSI is turning upward, and volume is increasing on green candles signaling demand. As long as price holds above $113,000, bulls may push toward the $117,500 target.
Key points :
Entry point : 113500
1st Target : 115000
2nd Target : 117500
Follow me for more latest updates and signals
Bitcoin: Expected Cool-Off or Cause for Concern?After rallying more than 25% off the June lows, Bitcoin is finally taking a breather with a much-anticipated pullback. But as expected, the fear meter is spiking, especially across CT.
Was this cool-off really a surprise? Not quite.
The signs were there: price stalling at upper extremes, responsive sellers stepping in at perceived overextensions, and inefficient zones left behind during sharp impulsive moves.
Of course, reading it in real-time is easier said than done. Emotions always complicate execution , but that’s a separate conversation.
In this post, let’s break down the current structure in detail —using volume profile, TPO charts, and market structure analysis, to give you a clearer picture of what’s unfolding. We’ll also explore a few scenarios worth watching as the next move shapes up.
Let’s dive in!
Table of Contents
➺ Volume Profile
➺ TPO
➺ Key Technical Insights
➺ Market Structure
➺ Trade Scenarios and What to Watch
➺ TLDR
⦿ Volume Profile
Currently, we’re seeing two key zones of balance : one broad range that held for over 60 days and a tighter 21-day structure that formed at higher levels. These are classic areas of value where buyers and sellers found temporary agreement, establishing balance.
The sharp move from ~111,000 to ~122,000 was largely impulsive , with little volume built along the way, suggesting initiative buying in early July. As is often the case with such thin zones, they tend to get revisited once momentum fades. That’s exactly what we’re seeing now.
As price dips into this low-volume pocket, the key question is:
Will the market accept this zone and begin building value here, or will it reject and bounce back toward higher ground?
Looking at the Volume Range Visible Profile (VRVP) since June 7th, the nearby Value Area High (VAH) sits around ~111,000 . If current support doesn’t hold, this becomes the next major volume magnet. That said, there’s also a low-volume node (LVN) just above 111,000 , which could act as a demand pocket and trigger a responsive bounce.
In simple terms:
– Acceptance into the LVN could lead to new range formation at lower levels
– A sharp bounce off ~110,000 might reestablish the prior higher balance, or create a fresh range between the two existing areas
The next few sessions will reveal whether the market is hunting for new value or just shaking out weak hands.
⦿ TPO
Zooming into the 4H TPO chart, we can clearly see the evolving monthly profiles from May through August. And as is often the case, the market found resistance right where you’d expect: at the extremes.
The upper end of July’s profile became a battleground. Buyers attempted multiple pushes above that upper balance, but each effort was consistently faded by responsive sellers , signaling growing exhaustion at the top.
Eventually, that pressure gave way to an impulsive breakdown, driven by initiative selling. Notably, price didn’t rotate gently back into the previous range, but it sliced straight into a thin zone of prior low participation.
Now, the market is sitting at the low-volume region , and the next key battle is shaping up. Additionally, The 108,000 to 110,000 area carries weight as it served as the Value Area High (VAH) for both the May and June profiles. If buyers are going to respond, this is one of the more likely places for them to step in.
⦿ Key Technical Insights
▸ Failed Acceptance Above 21-Day Balance
Repeated attempts to hold above the short-term balance were rejected, signaling buyer fatigue and a lack of conviction at higher levels.
▸ Initiative Sellers Took Control
Once demand dried up, sellers stepped in aggressively. The thin participation during the recent rally left little structural support, allowing price to drop quickly.
▸ No Value Built Below Yet
The zone currently being tested saw minimal trading earlier. If bulls want to reclaim control, they’ll need to build value here and establish a new base.
▸ Prior Balance High as Potential Support
Price is now retesting the top of the 60+ day balance area from above, a classic setup where previous resistance can become support. This area also aligns with a known demand shelf.
▸ Deviation Below the 200 MA Cloud
Price has slipped below the 200 MA cloud and is nearing a key flip zone. A test of the 110,000 level next week wouldn’t be surprising. That area could serve as a strong support zone where a new accumulation phase begins.
⦿ Market Structure
The broader market structure points to a transition in progress. After spending over two months in balance , price broke out to the upside —only to form another short-lived range at higher levels. That, too, gave way to a swift breakdown.
This kind of “failed acceptance at higher prices” is often an early signal that the market may revisit prior zones of interest, typically areas where value was last built.
All eyes now shift to the 110,000–111,000 zone , the high of the previous 60-day balance.
We’re in a classic test-retest phase, where the market is probing for conviction . These moments often set the stage for the next significant move, either continued distribution lower, or the beginning of a re-accumulation phase.
⦿ Scenarios & What to Watch
As Bitcoin pulls back into key structural zones, several scenarios are in play. Here's what to monitor in the coming sessions:
Scenario 1: Re-Acceptance into 21-Day Balance
▸ If price reclaims and holds above ~116K, we could see a rotation back toward the upper end of the short-term balance near ~120K.
▸ This would suggest the recent breakdown was a failed auction or bear trap, not the start of a broader trend reversal.
▸ Watch for initiative buying above the demand shelf with follow-through volume.
Scenario 2: Choppy Mid-Balance Activity
▸ Price remains range-bound between ~110K and ~116K, forming a new short-term balance zone.
▸ Expect slower movement and back-and-forth behavior as the market decides its next direction.
▸ Patience is key here. Watch volume and initiative behavior to gauge strength.
Scenario 3: Rejection and Continuation Lower
▸ If price fails to hold above ~110K, there’s potential for a move down to the POC near ~104K, or even deeper toward ~100K (Value Area Low).
▸ These are low-volume zones, which rarely offer strong support unless new value is built.
▸ This would signal a continuation of the current imbalance and potentially mark a structural trend shift.
I’m primarily focused on Scenario 1 and 2 , as we appear to be in a late bull phase. A deeper pullback toward 100K increases the risk of a broader trend change, making it less attractive from a risk/reward standpoint.
⦿ TLDR
▸ Buyers failed to hold the top of the 21-day balance. Clear signs of exhaustion.
▸ Price dropped into a prior low-volume zone, which now acts as potential demand.
▸ This area has never been accepted before - either buyers step in, or we go lower.
▸ Reclaiming ~116K could fuel a move back toward 120K+.
▸ Failure to hold ~110K opens the door to 104K, maybe even 100K.
What happens next week will likely set the tone for the next major move. Watch how the market responds to acceptance vs rejection zones, and let price action confirm your bias before you act.
If you found this analysis helpful, share it with someone who trades Bitcoin. 🥰
What’s your read on the current structure? Let me know in the comments! 📉
⚠️ Disclaimer
As always, this post is purely for educational purposes. I am not a financial advisor, and nothing here should be taken as financial advice. Always consult your financial advisor before making any investment or trading decisions. Or at the very least, consult your cat. 🐱

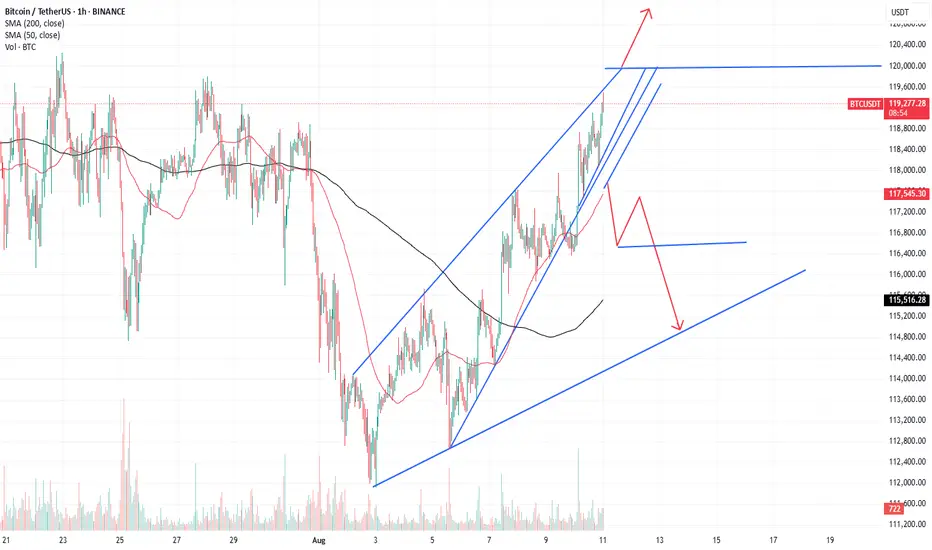
BTC 1H Analysis – Key Triggers Ahead | Day 2💀 Hey , how's it going ? Come over here — Satoshi got something for you !
⏰ We’re analyzing BTC on the 1-hour timeframe .
👀 After the strengthening of the US dollar , Bitcoin experienced a drop and formed a short-term support bottom around the $113,000 level . It is currently completing a pullback to the levels of this recent decline .
🎮 Our Fibonacci retracement is drawn from the breakout zone to the $112,200 bottom . Bitcoin broke below the 0.236 level and then found support . The best potential entry trigger, based on Fibonacci, is at the 0.382 level, or around $115,000 . If Bitcoin breaks above this level , it could form a higher high and a higher low in this timeframe .
⚙️ The RSI is showing a support level around 32 , which is currently preventing Bitcoin from entering the oversold zone . However , if this support is lost , Bitcoin could move into oversold territory .
📈 Our long position trigger is at the 0.382 Fibonacci level . A confirmed breakout of this level , combined with RSI overbuying and increased volume , would be our entry signal .
📉 Our short position trigger is around $113,000 . If this support breaks , we may open a short position . However, the main short trigger is at the 0 Fibonacci level ( support at $112,200 ) . If selling pressure increases and RSI enters the oversold zone , we will consider entering a short position with confirmation .
❤️ Disclaimer : This analysis is purely based on my personal opinion and I only trade if the stated triggers are activated .
BTCUSDTlet see what will happen my expactation it is. it is doing w and high. there is idm level and below of it exist fvg and order block when you check daily and weekly you will see the level which i mention.

BTC Breaks the Cage – Is $125K Next? (With Built-In Invalidation🔥 Welcome to The Wick Syndicate 🔥
The $118K prison bars just snapped — and Bitcoin didn’t even pause to look back.
We’ve been shadowing this move for days, waiting for the exact moment the door would swing open.
Now it’s here — a textbook continuation setup for those who know how to ride the current.
In a bull run, pullbacks aren’t fear.
They’re the market leaning in, asking quietly: “Care for another bite before we run?”
📊 BTCUSDT.P – Long Setup
🎯 Direction: Long
📍 Entry Zone: $119,800 – $120,200 (Breakout base retest + POC support)
🩸 Stop Loss: $118,500 (Below base & liquidity sweep)
🎯 Take Profits:
• TP1: $122,500 (Intraday liquidity)
• TP2: $124,000 (HTF extension)
• TP3: $125,000 (Round number + major liquidity)
📐 RR Ratio: ~1:2.6
🧠 Logic: HTF breakout above $118K range, spot-led buying pressure, OI rising, low resistance ahead. Bull run momentum favors shallow pullbacks & fast legs higher.
⏱ Trust Meter: ████████▒▒ 80%
⸻
⚠️ Execution Rules – Read Before You Ape
We never enter without confirmation.
For this trade, confirmation means:
• Price retests $119,800–$120,200 and holds above with a clear bullish M15–M30 CHoCH/BOS or footprint/CVD absorption.
• A clean 30m close below $118,500 = setup invalidated, bias flips to neutral until new structure forms.
No confirmation = no trade. Fakeouts in bull runs are savage — trade smart, not desperate.
⸻
Candle Craft | Signal. Structure. Execution.

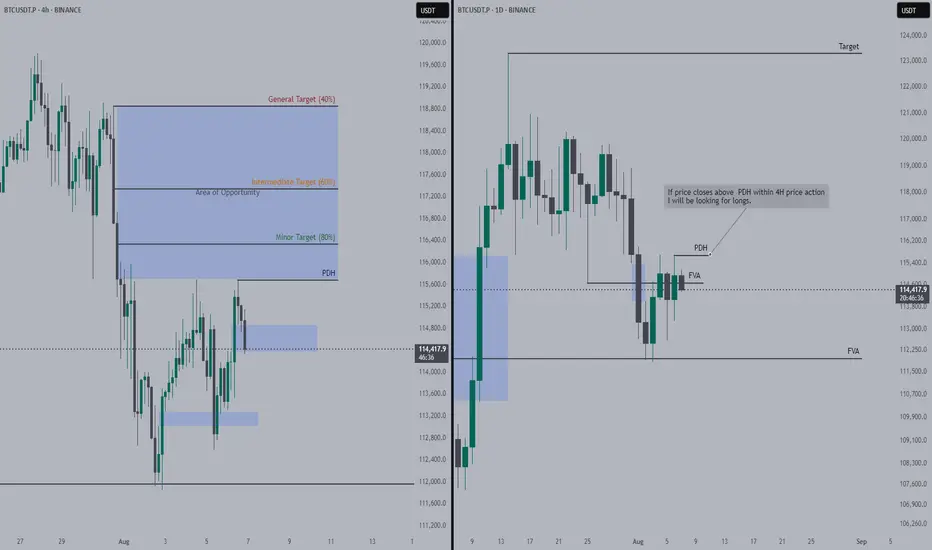
If Bitcoin holds up the pullback, longs incomingBullish imbalance on 4H holds price to not submit to the lows.
I will engage once the PDH gets run through and 4H candles closes above. Only engage within the Area of opportunity.
Targets have been outlined with their success rates.
$BTC - LTF OutlookCRYPTOCAP:BTC | 1h
On lower timeframe, we want 115.6k (monthly open) to hold.
If you're currently short, might take partial profit if we bounce and break above 116.8k
Short remains safe below 116.8k. If 115.6k (monthly open) breaks, eyeing for 114.2k-113.3k (mondayLow) for long re-entry.

BTC Price Prediction and Elliott Wave AnalysisHello friends,
>> Thank you for joining me in my analysis.
* For the biger imagination of the BTC path, we are still moving into the Orange wave A of the final Green C for ABC from its begining.
* For the smaller imagination of the BTC path, we are still moving into the Blue wave C of the final Green C for the upper Orange wave A.
* For the tighter imagination of the BTC path, I think we are still moving into the correction wave B for the upper Blue wave C.
>> Now we are moving in this Pink wave C for this correction B wave.
Keep liking and supporting me to continue. See you soon!
Thanks, bros

BITCOIN.BITCOIN , On 4hr we found a rejection using our 4hr line chart candle close and took advantage of the sale. The secret is to chart multiple brokers ,brokers candle stick closes are 100% different from line chart perspective while trading any thing in the financial market...(stocks,bonds,crypto,forex)
since we rely on the structure of the market for forward guidance we chart multiple broker for variation in candle closes .
the price action is watched in Realtime for a close into another structural buy zone .the current break out could retest 116k-117k and set up a buy wave based on the principles of break and retest.
the goal is to see if we break and sustain above 123k and look at 124k and 130k ascending trendline acting as dynamic supply roof and resistance to upswing which the current all-time high is a victim of the top layer supply roof .
united state economic data report will give a clear direction and signal into next FOMC OUTLOOK.
THE CPI measures the Change in the price of goods and services purchased by consumers, excluding food and energy
Core CPI m/m forecast 0.3% previous 0.2%
CPI m/m forecast 0.2% previous 0.3%
CPI y/y forecast 2.8% previous 2.7%
FOMC Member Barkin Speaks
14th
the core PPI m/m measures the Change in the price of finished goods and services sold by producers, excluding food and energy
Core PPI m/m forecast 0.2% previous 0.0%
PPI m/m forecast 0.2% previous 0.0%
Unemployment Claims forecast 225K previous 226.
this DATA will affect the 10 year treasury bond yield and dollar index as the signal will be watched by FEDS.
TRADING IS 100% PROBABILTY
LOWER YOUR EXPECTATION
RISK TO REWARD RATIO SHOULD BE IN YOUR CHECKLIST AND TRADE REASON.
ANY GOOD TRADE CAN TURN TO A BAD TRADE.
A TRADER WITHOUT LIQUIDITY IS A DEMO TRADER
A HUNTER GUN WITHOUT BULLET IS A TOY GUN.(HUNTERS MINDSET)
PROTECT YOUR CAPITAL.
GOOD LUCK
#BTC #BITCOIN

Analysis no 75 btc 1hWelcome to King BTC. The price of Bitcoin is expected to move towards 115,700 with a stop of 119,950 and a second target of 112,700. This is just a possibility.

BTC – Summer chop arrived?Some rotations I'm looking for BTC.
Volatility is slowly cooling off, also noticeable in options premiums so I'm not expecting any big moves and mostly focussing on intraday moves.
That doesn't mean we can't mark more htf POIs of course.
1. Clean up the bad lows we left yesterday, but protect the low from CME open this week. Gives a really nice setup and RR
2. Take a stab lower into 110-111k. I think the sweep can be frontran here, so it's possible we have to stay alert and enter a bit sooner.

BTCUSD 09.08.2025+ Positive crypto news: President Trump wants more cryptocurrency in 401(k) retirement savings plans.
*Usually, I'm not sure about taking trades on weekends due to lower volume, but looking at how ETH was reacting, I thought, "Then, why not BTC as well?".

Stablecoins: Stability in a World of VolatilityIn the cryptocurrency space, everything changes rapidly: trends form within hours, and assets can rise or fall by double-digit percentages in a single day. In such conditions, traders need a tool that allows them to preserve capital and act without haste. That tool is the stablecoin — a digital asset with a fixed price.
They serve as a kind of “safe harbor” in the storms of the crypto market. Even if Bitcoin or Ethereum face a sharp correction, a stablecoin theoretically remains equal to 1 US dollar (or another pegged currency).
What is a Stablecoin
A stablecoin is a token whose value is pegged to a base asset at a 1:1 ratio. Most commonly, this peg is to the US dollar, but there are stablecoins linked to the euro, gold, or even a basket of assets.
The idea is simple: combine the convenience of cryptocurrencies (fast transfers, no borders, transparency) with the predictability of traditional money. This allows traders to quickly move capital between positions or exchanges without losing value to volatility.
Main Types of Stablecoins
1. Fiat-Backed
The issuer holds actual dollar reserves in bank accounts.
The peg is maintained by allowing token holders to redeem them for fiat at any time.
Examples: USDT (Tether), USDC.
Pros: high liquidity, easy to understand.
Cons: reliance on the issuer and a centralized structure.
2. Crypto-Backed
Backed by other cryptocurrencies used as collateral.
Collateral often exceeds the token’s face value to protect against volatility.
Example: DAI by MakerDAO.
Pros: decentralization and blockchain transparency.
Cons: risk of a sudden drop in collateral value, which can trigger liquidations.
3. Algorithmic
The peg to the dollar is maintained via smart contracts that regulate the supply of tokens.
Tokens are minted when the price rises and burned when it falls.
Examples: former UST (Terra) before its 2022 collapse.
Pros: decentralization, no need for real reserves.
Cons: highly vulnerable to market panic.
Why Stablecoins Matter to Traders
Locking in Profits
Closed a profitable ETH long? Instead of cashing out to fiat, you can convert to a stablecoin and preserve purchasing power until your next entry.
Protection from Volatility
When the market looks overheated or uncertain, stablecoins allow you to “go into cash” without leaving the crypto ecosystem.
Liquidity and Transfer Speed
A traditional bank transfer may take days, while moving USDT or USDC takes minutes — crucial for arbitrage or quick reactions to news.
A Tool for Margin Trading
Many futures platforms use stablecoins as the base currency for settlements, simplifying profit and loss calculations.
Risks and Pitfalls
Regulatory Pressure
Centralized issuers can freeze addresses or restrict operations in response to government requests.
Losing the Peg (Depeg)
If confidence in the issuer or system drops, the stablecoin’s price may deviate from $1. Algorithmic stablecoins are particularly vulnerable.
Centralization
Fiat-backed tokens depend on the issuing company, which controls reserves and redemption processes.
💡 Practical Use with CV_Pro
When trading crypto futures with CV_Pro, stablecoins can serve as a “parking spot” between trades. Closed a profitable position? Move funds into USDT, wait for the next signal, then re-enter. This reduces the impact of volatility and gives you time to make thoughtful entries.

BTC Breakout Without Volume⚠️ Watch Out – Breakout Without Volume
Price is testing the resistance zone again, but look closely at the volume bars — there’s no real participation behind this move. Without strong buying volume, it’s unlikely the market can sustain a bullish breakout.
Low-volume breakouts often result in false moves or quick pullbacks as there’s no fuel to keep driving price higher. I’ll be watching closely for confirmation before committing to any long positions.
📌 Quick Technical Note:
In breakouts, volume is the fuel that powers price movement. A breakout backed by strong volume shows that many market participants agree with the move, adding conviction and sustainability. When volume is low, it suggests limited interest — meaning fewer buyers to keep the price climbing, increasing the probability of a reversal or retest.
What do you think — is this breakout already losing steam, or do you see hidden strength here?
