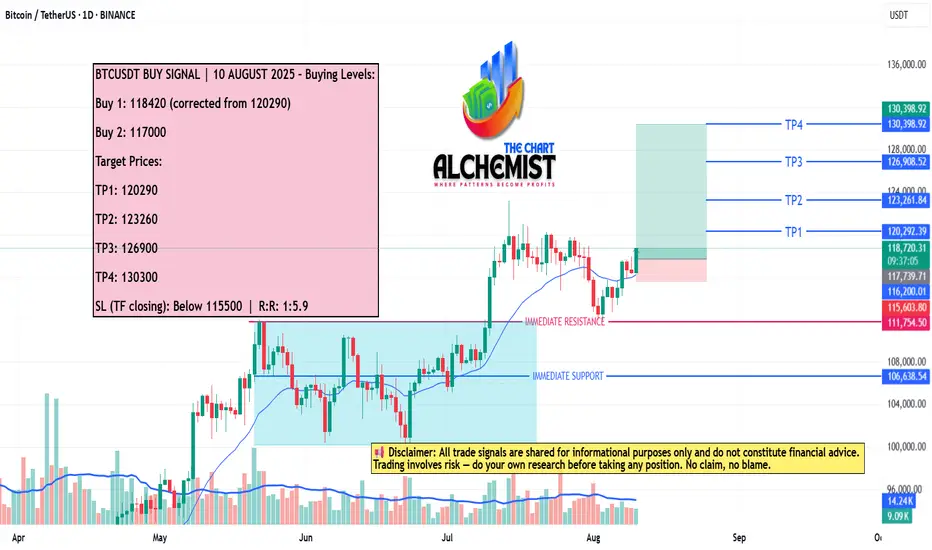
BTCUSDT BUY SIGNAL | 10 AUGUST 2025 BTCUSDT BUY SIGNAL | 10 AUGUST 2025
We previously gave a buy call for BTCUSDT, which achieved all its targets. The coin had consolidated in a bull flag pattern, retested the breakout level at 111880, and then moved upward. We now expect continued bullish momentum towards multiple quantified displacement targets.
USTBTC trade ideas
bitcoin the breakout of the supply roof will be watched .if we have a sustained buy pressure we may hold on the lower level buy zone and target 123k current all time high and print a new all time high.
trading is 100% probabilty.

BITCOIN WATCH the price action and manage your risk.
the inflow of liquidity is pushing price to retest the current all time high
#btc #bitcoin #crypto


Bitcoin (BTC): Bullish Start of Week | Eyes on $110KOur attentions are currently at $110K on BTC, where we maintain the bullish plan as long as we are above that zone.
This zone is marked as the BOS area for us, where currently we are seeing the price has retested it and bounced right off again, leading the price back to upper zones here.
So once again, as long as we maintain that area, we are bullish; if we break it, we are going to look for that Bollinger Bands middle line!
Swallow Academy

BTC(20250808) market analysis and operationAugust 8th BTC Contract Technical Analysis:
Today, the daily chart closed with a small bullish candlestick pattern, with prices rising above the moving average. The accompanying indicator formed a death cross and showed shrinking volume. The overall upward trend is currently dominant. Although there was a significant pullback at the beginning of this week, it has not continued. However, the upward trend continues, with consecutive highs broken. Positive news and data are driving prices higher. The short-term hourly chart currently shows a series of bearish candlestick patterns and a death cross. This suggests a strong intraday pullback, with support at the 115,500 area. This is a level to watch during the European session. Furthermore, today, Friday, is a cautious market.
Today's BTC Short-Term Contract Trading Strategy:
Sell at the current price of 116,500, with a stop loss at 117,300 and a target of 115,500. Buy if the price does not break below 115,500, with a stop loss at 115,000 and a target of 117,000.

BITCOIN TRADE 07.08.2025After a correction by 10% from ATH, BTC finally closed a huge gap on CME on $114.000 level, we are ready to see another wave of growth. I was waiting for BTC to break out EMA-200 level on 4-hour timeframe, after seeing how the price was consolidating below of EMA-200 and trying to break out a few times in a row, I opened a long position on $115280. So far I'm expecting to see the price to break out the upper channel and then we can expect BTC to try to hit new ATM since there is a lot of liqudity from short traders, but for your calmness, you can completely close your position on $120.000.

BTC, the clock is tickingLet the chart speak for itself. BTC will make new ATH before the Fed Pivot. After the pivot however, panic will occur and there will be blood on the streets.
You have been told.
P.S Not financial advice.
BTC/USDT Analysis — First Signs of Buyer Support
Hello everyone! This is the daily market analysis from the CryptoRobotics trading analyst.
Yesterday, Bitcoin experienced another wave of decline but failed to reach the local low. A strong absorption of sell orders occurred, and a local support zone formed at $113,300–$112,700. We currently interpret the resulting volume as being positioned for buying.
We are now waiting for a retest of two local support zones:
$114,500–$114,000 (mirror volume zone)
$113,300–$112,700 (local absorption of selling pressure)
From there, we consider local long entries.
The movement potential is aimed at the next sell zone.
If price drops further and shows no reaction within these zones, it's important to closely monitor the price reaction near the $112,000 level.
Buy Zones:
$114,500–$114,000 (mirror volume zone)
$113,300–$112,700 (local absorption of selling pressure)
$110,000–$107,000 (accumulated volume)
Sell Zones:
$115,000–$116,300 (mirror volume zone)
$117,600–$118,600 (accumulated volume)
This publication is not financial advice.

Bitcoin Go 140kAfter a fake exit and a trick, it goes strongly towards the ascending channel and liquidates everyone. The target for Bitcoin is 140,000.

Bitcoin fixed above the $112k ┆ HolderStatOKX:BTCUSDT is recovering after touching the $111,940 zone, now confirmed as strong support. The price is reversing from the lower wedge boundary, suggesting renewed momentum. A clean push could retarget $122,250 in coming sessions.

BTC/USD) Bullish trend analysis Read The captionSMC Trading point update
Technical analysis of (BTC/USDT) on the 4-hour timeframe, using Smart Money Concepts and a falling channel breakout approach.
---
Technical Breakdown:
1. Market Structure:
Price has been moving within a descending channel, forming lower highs and lower lows.
BTC just bounced strongly from the Fair Value Gap (FVG) zone, marked in yellow, and the lower boundary of the channel, suggesting a potential trend reversal.
2. Key Levels:
FVG (Demand Zone): Between ~112,000–114,000 — price reacted from this zone with clear bullish momentum.
200 EMA (114,799.70): Price is currently below it, but if it reclaims this level, it will strengthen the bullish setup.
Target Point: ~123,287–123,327 — aligns with the upper boundary of the channel and previous resistance.
3. Projected Price Path:
Step 1: Price is expected to retest the mid-channel resistance and potentially break above.
Step 2: If confirmed, BTC may rally toward the 123k+ target zone, continuing the trend reversal.
4. RSI (14):
RSI is currently at 42.70, moving up from oversold territory (33.05 low), which supports a bullish reversal.
No bearish divergence seen, indicating room for upside.
Mr SMC Trading point
---
Trade Idea Summary:
Bias: Bullish
Entry Confirmation: Strong bounce from FVG and bullish candle close above 114,800 (EMA)
Target Zone:
TP1: 118,000 (channel midline)
TP2: 123,327.97 (channel top / resistance zone)
Invalidation: Close below 112,000 or breakdown of channel and FVG
Indicators: RSI recovery + strong volume bounce supports bullish scenario
plesse support boost this analysis)

Bitcoin (BTC): Looking Back At Last Analysis | Buyers DominateSince last time we looked at the 4-hour timeframe, we have had a good 7% upside movement, where price is now back in our sideways channel, giving us another opportunity for a potential breakout to happen and proper buyside movement to start!
So we wait out today, and if buyers maintain current zones, we are going to look from a different angle!
Swallow Academy

BTC Buy / Long SetupWait for the entry till London Session, and Hold the trade, Must use SL with proper risk management.

btc buy midterm"🌟 Welcome to Golden Candle! 🌟
We're a team of 📈 passionate traders 📉 who love sharing our 🔍 technical analysis insights 🔎 with the TradingView community. 🌎
Our goal is to provide 💡 valuable perspectives 💡 on market trends and patterns, but 🚫 please note that our analyses are not intended as buy or sell recommendations. 🚫
Instead, they reflect our own 💭 personal attitudes and thoughts. 💭
Follow along and 📚 learn 📚 from our analyses! 📊💡"

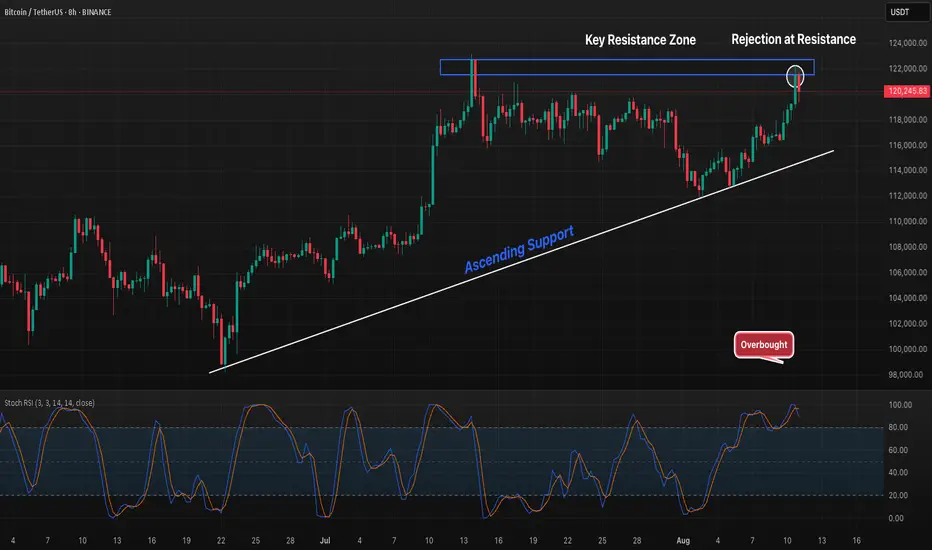
BTC 8H Ascending Support Test, But Will Resistance Reject Again?Bitcoin has been climbing along a steady ascending support line, now testing a key resistance zone around $122K that has previously acted as a strong rejection point. The Stoch RSI is deep in overbought territory, suggesting potential short-term selling pressure. A breakout above this resistance with strong volume could open the door to further upside, while another rejection may send price back toward the trendline for a retest.
BTC Plan 2025 - 2026BTC is making the double top pattern and GANN pattern. I am expecting it down to 108k-110k target in play. After hitting this target, it will bounce back to 135k-155k target for wave 5 to complete this bull market cycle.
lets wait and play.

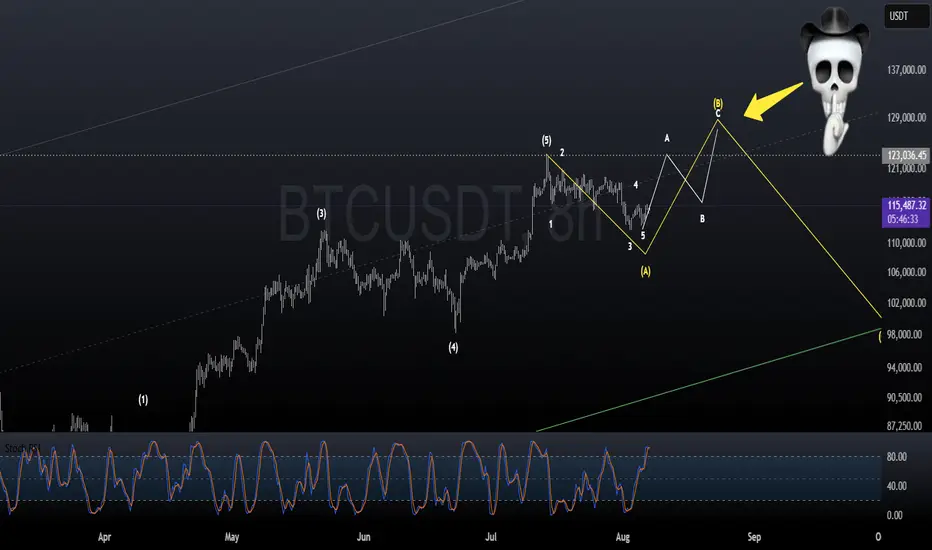
Bitcoin Overall: look for 9 wave impulseThere has been no retracement within the current price range. As a result, this is looking very much like a classical Elliot wave impulse. This one should have nine waves before another corrective phase.
BTCUSDT LONG- Signal: LONG
- Entry: BTCUSDT 118,460 ~ 118,500
- Take Profit: 118,940 / Stop Loss: 118,380

BITCOINBITCOIN ,THE STRUCTURE ON 4HR provided an ascending trendline and we have seen buyers keeping that dynamic support for buy .
we will monitor the current supply roof breakout for better buy confirmation after seeing a 2hr ascending trendline cross providing a support that took us to 118k if correction into 116-117k hold and the broken supply becomes demand than 123k all time high retest is on the desk.
trading is 100% probability.
manage your risk.
#btcusdt #bitcoin #tbc #crypto

BITCOIN BTC BITCOIN ,THE STRUCTURE ON 4HR provided an ascending trendline and we have seen buyers keeping that dynamic support for buy .
we will monitor the current supply roof breakout for better buy confirmation after seeing a 2hr ascending trendline cross providing a support that took us to 118k if correction into 116-117k hold and the broken supply becomes demand than 123k all time high retest is on the desk.
trading is 100% probability.
manage your risk.
#btcusdt #bitcoin #tbc #crypto

#BTC hits neckline resistance and pulls back📊#BTC hits neckline resistance and pulls back✔️
🧠From a structural perspective, we've retreated after hitting resistance at the neckline, as expected. If the current structure continues to decline rapidly, we could potentially retest support near 112,000, or perhaps break below the previous low to sweep liquidity before rebounding.
➡️The resistance zone remains clear. Only if the neckline resistance zone is broken and stabilizes for a day or so can we maintain a positive bullish stance.
Let's see 👀
🤜If you like my analysis, please like 💖 and share 💬 BITGET:BTCUSDT.P

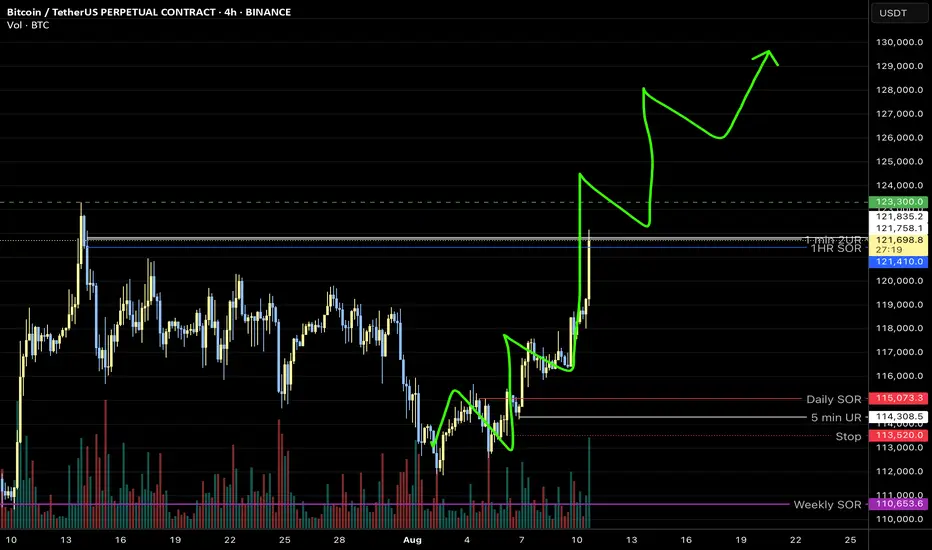
New Bullish Rally About To Start Toward The 130k🔥 Well, the previous update played out perfectly — the price dropped to the $12K support area and bounced back strongly. Now, let’s talk about my next plan for Bitcoin
📥 At the moment, there’s a clear bullish flag forming on the chart. Price has bounced from the 1.618% PRZ (Potential Reversal Zone), which I’ve labeled as wave C of the larger corrective ABC structure.
📈 From here, I’m expecting a new bullish rally, with the next major target around $130K.
