BTCUSDT – 1H Chart Analysis |Critical Retest at Broken trendline
📅 \ Date:\ August 5, 2025
⏰ \ Timeframe:\ 1H
📍 \ Exchange:\ MEXC
💱 \ Pair:\ BTC/USDT Perpetual Futures
---
\ 📉 Trendline Breakdown and Retest\
BTC has broken below the ascending trendline and is now retesting it from the underside. This setup often signals a \ bearish retest\ , especially when momentum is weak and rejection wicks appear near previous support turned resistance.
Last rejection came around \ \$114,800\ , right at the underside of the broken trendline.
---
\ 🔍 Key Technical Levels\
* \ Resistance:\ \$114,800–\$115,000 (confluence of trendline + supply zone)
* \ Support:\ \$113,300 (horizontal green zone, strong historical demand)
Failure to reclaim the trendline might open the path toward \ \$113,300\ . A strong breakout above the trendline may flip bias short-term bullish.
---
\ 📊 Indicators Overview\
\ MACD\ :
• Bearish momentum is fading
• Bullish crossover is forming but not yet confirmed
• Needs clearer separation and histogram recovery for confirmation
\ RSI:\
• Currently at \ 49.43\ , struggling to cross the midline
• Facing resistance near \ 53.14\
• Neutral to slightly bearish momentum
---
\ ⚠️ What to Watch\
🔺 \ Bullish Scenario:\ Break and close above \$115,000 → continuation toward \$116,200
🔻 \ Bearish Scenario:\ Rejection at trendline → decline toward \$113,300
---
\ 🧭 Conclusion\
BTC is at a decision point. The next few candles will likely confirm whether this is a failed breakdown or a clean rejection. Watch volume and candle closes carefully.
\ Patience is key – confirmation is everything.\
---
\ #Bitcoin #BTCUSDT #TechnicalAnalysis #Trendline #MACD #RSI #SupportResistance #CryptoTrading\
USTBTC trade ideas

BTC-----Sell around 114500, target 113500-113000 areaAugust 5th BTC Contract Technical Analysis:
Today, the daily chart closed with a small bullish candlestick pattern, with prices remaining high. However, the accompanying indicator forms a death cross. While the broader trend remains bearish, the market is still trending downwards. However, yesterday's significant upward trend suggests a range-bound trend in the short term. Without a continuation of the trend, a significant unilateral move is unlikely. On the hourly chart, yesterday's intraday gains continued in the European and American sessions, but prices failed to break above the previous high. The current candlestick pattern shows consecutive bearish candlesticks, with prices trading below the moving average and the accompanying indicator forming a death cross. Therefore, continued support is crucial for the day, with the strength and potential breakouts of the European session also key.
Today's BTC Short-Term Contract Trading Strategy:
Sell on pullbacks to the 114,500 area, with a stop-loss at 115,000, and a target of 113,500-113,000.

BTC PA📊 Price Action Analysis
Rejection at Major Supply Zone ($120K)
Price reached a strong supply/sell zone between $120K and $123K, marked in red.
$120,000: Psychological round number — major supply area.
Price got rejected after multiple days of consolidation under this level.
Support, Resistance Levels and Trendlines
$116,010: Horizontal S/R — acted as temporary support, now resistance.
$111,999.79: Key horizontal support.
Blue PA (D)s trendline has been broken bearishly — indicating a change in short-term market structure.
Momentum is currently in a pullback/retracement phase after strong rally from late June to mid-July.
Volume Analysis
Volume is declining during the pullback — typical of retracements and not full-blown reversals.
No major volume spike indicating panic selling.
Fibonacci Retracement Analysis (Recent Swing High to Swing Low)
Key levels:
0.786: $117,820.25 — Rejected here.
0.618: $113,626.61 — Currently testing this level, price slightly above.
0.5: $110,681.08 — Next support if rejection at 0.618 persists.
0.382: $107,735.54
0.236: $104,091.07
0%: $98,200.00 — Full retracement base.
Price is showing hesitation at the 0.618, which is a crucial level in Fibonacci theory. A break and hold below this could accelerate the drop toward $110.6K and beyond.
RSI Analysis (Daily)
RSI is around 46.46 — moving below midline (50), showing weakening momentum.
Bearish divergence confirmed: price made a higher high while RSI made a lower high → bearish reversal signal.
Bullish if:
BTC reclaims $116K, closes above $120K — invalidates rejection.
RSI bounces from current level with volume support.
Bearish Bias:
Currently, structure broke down.
Testing 0.618 Fib level; failure here likely brings price to: $110,681

BTC-Stay Sharp. Self RegulateBTC Update
👀All Eyes on These Levels 👇
We’re back in A zone.
The level? 115,727.
This isn’t just any line on the chart — this is the same trendline that flipped from major resistance to support back to resistance on the same date of the infamous #bUCKmOON pump.
📈 If BTC breaks this level with strength and volume — I’m in long.🟢
No volume? No conviction. No entry.
But let’s not get carried away — resistance lurks right above at 117,000 — the former Exhaustion Zone Support now turned resistance.
A classic case of "what once held you up now wants to drag you down."
And if the bulls somehow clear that hurdle?
They'll run headfirst into the Exhaustion Zone Resistance — the real boss fight.
These are stacked walls — one after the other. No easy wins here.
🧠 As a chartist, I’m not here to write about what happens if we break through every ceiling like it’s some fanboy fantasy. That’s not analysis — that’s hopium.
🥂 Yeah yeah but— it’s fun to daydream about all the champagne showers, yacht parties, laser eyes, and the sudden urge to start a DAO that changes the world.
We all picture it.
We all love it.
And sure, when BTC rips through all resistance like butter, we’ll act like we "knew all along."
But anyways — snap back to reality...
There’s another level we can’t ignore:
112,388
👀 Even a 4-hour close below this level?
Just check the chart.
That’s when the bears come storming out of hibernation — angry, hungry, and ready to feast.
🎯Bottom line:
Stay sharp. Self Regulate.
The chart is the map. Discipline is the treasure.

Quick Bitcoin Analysis – 30-Minute TimeframeQuick Hey friends 👋
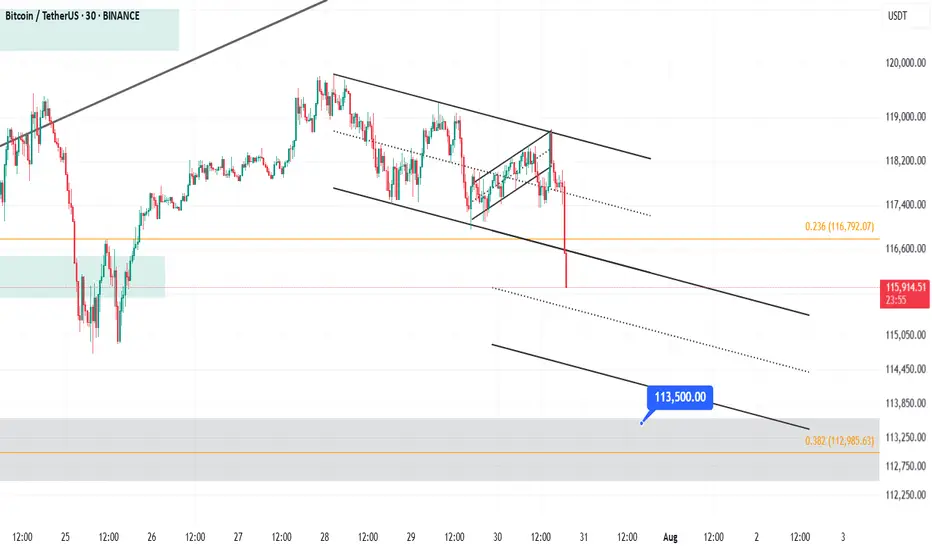
Bitcoin was recently moving inside a weak upward channel on the 30-minute chart. But now, it has broken below the channel with a strong bearish candle. This suggests we’re entering a short-term correction.
🔹 However, don’t forget — the overall trend is still bullish.
This drop looks more like a healthy pullback, not the start of a full downtrend.
🎯 Possible Targets for This Correction:
✅ Target 1: Around $114,500
(This comes from measuring the width of the broken channel.)
✅ Target 2: Strong support near $113,500
(This level has shown solid buyer interest in the past.)
📊 The RSI is also approaching the oversold zone, which means we might see a small bounce or slowdown in the drop soon.
📌 In short:
This is likely just a dip in a bigger uptrend. Be patient, watch key support zones, and don’t rush into trades.
Always stick to proper risk management! 💼
Bitcoin Analysis – 30-Minute Timeframe
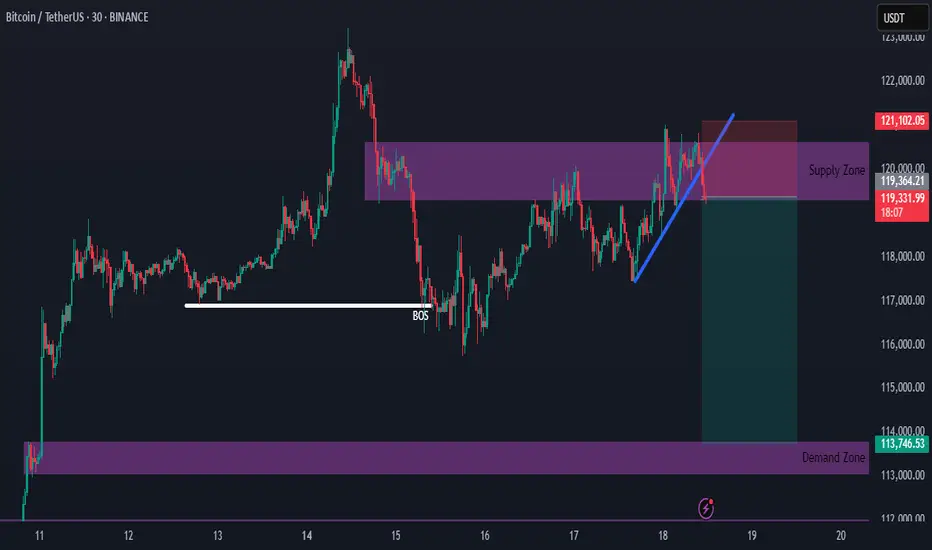
Bitcoin Supply Zone Intact — New Short Setup DevelopingHello everybody!
The supply zone we discussed in the previous idea is still holding.
We have a new opportunity to go short upon the break of the upward trendline.
The most likely target is around 114,000.
#BTC enters neckline resistance zone📊#BTC enters neckline resistance zone⚠️
🧠From a structural perspective, we hit the daily neckline support and began to rebound. Unfortunately, it's about $170 away from the overlapping support zone I'm focused on, and the rebound didn't establish a 1-hour bullish structure. This suggests a high probability of encountering resistance and a pullback after this rebound. Therefore, don't chase the rally at the neckline resistance zone! Only if we can break through the neckline resistance zone and stabilize for a day or so should we actively consider a bullish move.
➡️Support is clearly around 120,000. Even if it falls below this level, as long as the 4-hour closing price is above it, this support level will remain valid. Extreme support is still around 110,000!
🤜If you like my analysis, please like 💖 and share 💬
BITGET:BTCUSDT.P

"BTC Moves Down — Scenario Confirmed"As expected, the market couldn’t sustain the overheating.
Over the past few days, Bitcoin has shown clear signs of weakness. The rally from $105K to $118K happened too quickly, without proper correction, and with noticeably declining volume toward the end of the move. In such situations, the market often loses footing — and that’s exactly what we’re seeing now: BTC has corrected down to $114,000.
If you've been following my analysis, you know I pointed out signs of overheating earlier: strong deviation from moving averages, weak reaction at key resistance levels, and upward wicks without volume confirmation. My indicator gave an early warning of trend weakening around the $117–$118K zone. That’s when it became clear momentum was fading.
This isn’t a crash or panic — it’s a normal, healthy market correction. Overleveraged long positions are getting flushed out, and late entries at the top are being shaken off. In such phases, it’s crucial not to react emotionally but to follow a clear system.
The key point: markets don’t reverse “suddenly.”
Everything happening now was visible in advance — if you were looking not just at price, but at the structure of the movement.


BITCOIN BULLISH POSSIBLE VIEW🧠 Key Observations (Smart Money Concepts - SMC Style)
🔄 Market Structure:
MSS (Market Structure Shift): Price recently made a MSS after a BOS (Break of Structure), indicating a shift to bullish structure.
BOS (Break of Structure): Seen on the move up from the demand zone.
SSL (Sell-side Liquidity) taken before the recent bullish move — classic liquidity sweep behavior.
📦 Zones:
Demand Zone: Between ~$111,000 and ~$113,000
4HR Supply Zone: Around ~$115,000 to ~$116,000 — where price is currently reacting.
Golden Zone (Entry/POI): Near the origin of the move that caused the BOS.
📍 Entry & TP/SL Setup:
Buy Limit: Placed at 111,931.32, right at the edge of the demand block.
Stop Loss (SL): Set just below at 110,453.42
Take Profit (TP): Targeting 113,676.39, right before the next resistance.
📊 Volume Analysis:
Large bullish volume spike aligns with the most recent BOS.
Diminishing sell volume during retracement suggests exhaustion of bearish momentum.
✅ Trade Idea (Based on Chart Setup):
Bias: Bullish
Entry: 111,931.32 USDT
Stop Loss: 110,453.42 USDT
Take Profit: 113,676.39 USDT
Risk/Reward: ~1:1.5 to 1:2
🔍 Additional Notes:
Liquidity Sweep: SSL cleared → indicates potential for long setups.
BOS + MSS Confluence: Bullish intent confirmed.
BB (Break of Block): Indicates intent to move higher if resistance is broken.
ERL Target: Final target is shown far above current price, near 123,280.88, could be a longer-term swing target if price holds structure.
🔄 Next Steps (as per typical TradingView publish ideas):
Set alerts at the demand zone.
Monitor price action when it taps into the Buy Limit level.
Watch for confirmation candle or volume spike before manual execution (if not using limit orders)

Market - BTC - ETH Analysis
💎 Market - BTC - ETH Analysis💎
🟠 Current Market Status: ⚠️ / Low Risk-Reward ❗️ / Avoid Overtrading 🚫
🔷 BTC/USDT (Multi-Timeframe Analysis)
• Weekly (HWC): Last week’s red candle tapped into a buyer zone. A balance or sideways movement is likely this week.
• Daily (MWC): Minor retracement in a downtrend. No clear bullish reversal yet.
• 4H (LWC): Still in a downtrend. For a bullish reversal, we need a Higher Low (HL) followed by a break of the previous High.
• 1H: Breakout above level 116 would signal a short-term trend reversal. Breaking the upper channel confirms bullish continuation in the lower timeframe.
✅ Strategy Outlook:
• HWC: Bullish
• MWC: Bullish
• LWC: Bearish
→ We're not shorting based on LWC unless it turns bullish or MWC flips bearish.
🕒 Conclusion: Stay on the sidelines until the structure shifts clearly.
🔶 BTC Dominance (BTC.D)
• Currently rejected in the 4H chart, but not yet a confirmed bearish structure.
🧭 Two setups to watch before rotating into altcoins:
1. Clear lower highs and lower lows in 1H and 4H
2. Box formation and breakdown in lower timeframes
🚨 Key Level: A break below 60.40 may trigger sharp altcoin rallies.
🌐 TOTAL / TOTAL2 / TOTAL3
• All three charts share a similar structure.
• 1H TOTAL: Break of 4.72 confirms a V-pattern and may trigger upside momentum.
• TOTAL2: Watch 1.42 as a critical level.
→ Until then: No action – Wait for breakout confirmation.
💵 USDT Dominance (USDT.D)
• Ideally should not retrace beyond 4.64 – if it forms a top here, that’s a bullish sign for the market.
• Level 4.44 is less relevant for now.
• Failure to reclaim 4.53 increases the importance of 4.64.
• If it starts dropping, enter before a breakdown of 4.13 to stay ahead of bearish pressure.
🟠 ETH/BTC
• Consolidating in a 4H box.
• Break of 0.03278 is a trigger for long ETH exposure — ideally hold post-breakout.
• Wait for SMA7 on the Daily to turn upward for stronger confirmation.
• Break of 0.03288 on ETH/BTC likely aligns with $3850–$4000 breakout on ETH/USDT.
→ Position should be taken before this breakout to catch the move early.
📌 Final Note:
We are in a low momentum, low R/R environment.
Only trade confirmed breakouts and structural shifts.
Avoid overtrading, keep risk exposure limited, and rely on higher-timeframe confluences for clearer direction.

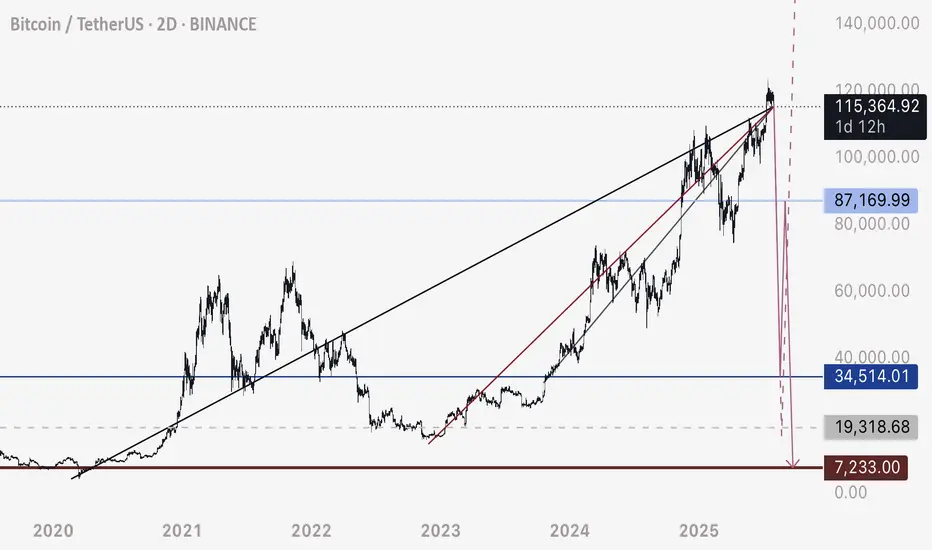
BTC - Not the End of the DropRather the beginning. Bitcoin has fallen below this bearish intersection. Anticipating price to fall rapidly on one of these two pathways to the Uber low liquidity levels.
DXY is retesting a major bearish breakdown - this is the conduit that will justify a flash crash of this magnitude prior to a 3-5 year bull run.
Happy trading.
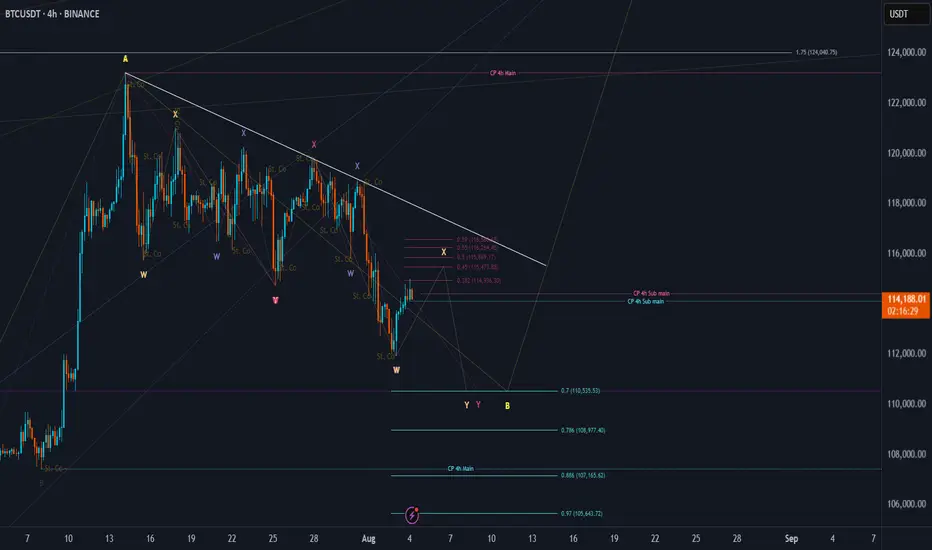
BTC Price Prediction and Elliott Wave AnalysisHello friends,
>> Thank you for joining me in my analysis. I think we need to extend the pink wave Y as wxy in purple counting => W, and then XY as orange counting. This all happened after getting the green D with not preferred closing as I mentioned yesterday.
Keep liking and supporting me to continue. See you soon!
Thanks, bros
BTCUSDT – Key Support Holding! Next Targets if 115,827 BreaksBitcoin is currently holding above a crucial support zone around 115,220. After a recent drop to the 114,979 area, buyers stepped in strongly, preventing further downside.
📊 If price stabilizes above 115,220 and successfully breaks through the resistance at 115,827, I expect bullish continuation towards the following targets:
🎯 Target 1: 117,900
🎯 Target 2: 119,076
These zones acted as strong resistances previously, and breaking through them could open the path to further upside.
⚠️ However, if BTC closes below 114,500, we may see a bearish breakdown with potential downside towards 108,000 – 106,000 range.
📌 Personally, I hope Bitcoin holds this support as it’s a key level to maintain bullish momentum.
Let’s see how the market reacts in the next few candles! BINANCE:BTCUSDT

BTCUSDT: A Bullish Foundation Meets Fibonacci FirepowerBTCUSDT: A Bullish Foundation Meets Fibonacci Firepower
BTCUSDT is currently at a critical juncture, navigating a significant upward trendline and a key Fibonacci retracement level. The chart highlights the ongoing battle between buyers and sellers following a strong multi-month rally. Price action is testing a major confluence zone, which will likely determine the immediate future direction of the market.
1. The Bullish Foundation (Late March - July):
• Long-Term Uptrend Line (White): A prominent upward-sloping trendline originating from the late March lows has defined the bullish narrative. Price has consistently found support on this line, demonstrating a strong underlying buying interest and a disciplined ascent. This trendline has been a reliable gauge of the market's health and a key area for bulls to defend.
• Fibonacci Retracement Levels: When we apply the Fibonacci retracement tool from the recent swing low to the all-time high, several potential support areas are identified. These levels are critical for understanding potential pullbacks and market structure.
2. The Current Inflection Point (Late July - August):
• Confluence Zone: The market is currently engaging with a high-stakes confluence zone. This area is defined by two key technical indicators:
o The Long-Term Uptrend Line: Price is testing this foundational support line for the first time since the July peak. A bounce from this level would reinforce the long-term bullish bias.
o The 0.236 Fibonacci Level (~$111,804): This is the first level of support in the Fibonacci sequence. The market is finding temporary footing here, and a decisive break below this level would be a bearish signal, suggesting a deeper retracement is likely.
3. Potential Scenarios:
• Bullish Continuation : The most optimistic scenario involves a successful defense of the current confluence zone. A strong bounce from the white uptrend line and the 0.236 Fibonacci level, backed by increased buying volume, would signal that the bulls are still in control. In this case, a re-test of the recent all-time highs would be the next logical target.
• Bearish Retracement : If the confluence zone fails to hold, and BTCUSDT breaks decisively below the trendline and the 0.236 Fibonacci level, it would suggest a deeper correction is underway. The next major support zone to monitor would be:
o The 0.382 Fibonacci Level (~$104,666) : This level has historically acted as both support and resistance, making it a critical psychological and technical area. A drop to this zone would likely be met with renewed buying interest.
o The 0.5 Fibonacci Level (~$98,897) : A move to this level would signal a more significant correction, potentially testing the psychological $100,000 mark.
Conclusion:
BTCUSDT is at a pivotal moment. The market's reaction to the current confluence of the long-term uptrend line and the 0.236 Fibonacci retracement level will dictate the short-to-medium-term direction. A bounce from here would confirm the strength of the uptrend, while a break lower would open the door for a deeper retracement toward the next key Fibonacci levels. Traders should closely monitor price action and volume at these critical levels for confirmation of the next directional move.
Disclaimer:
The information provided in this chart is for educational and informational purposes only and should not be considered as investment advice. Trading and investing involve substantial risk and are not suitable for every investor. You should carefully consider your financial situation and consult with a financial advisor before making any investment decisions. The creator of this chart does not guarantee any specific outcome or profit and is not responsible for any losses incurred as a result of using this information. Past performance is not indicative of future results. Use this information at your own risk. This chart has been created for my own improvement in Trading and Investment Analysis. Please do your own analysis before any investments.

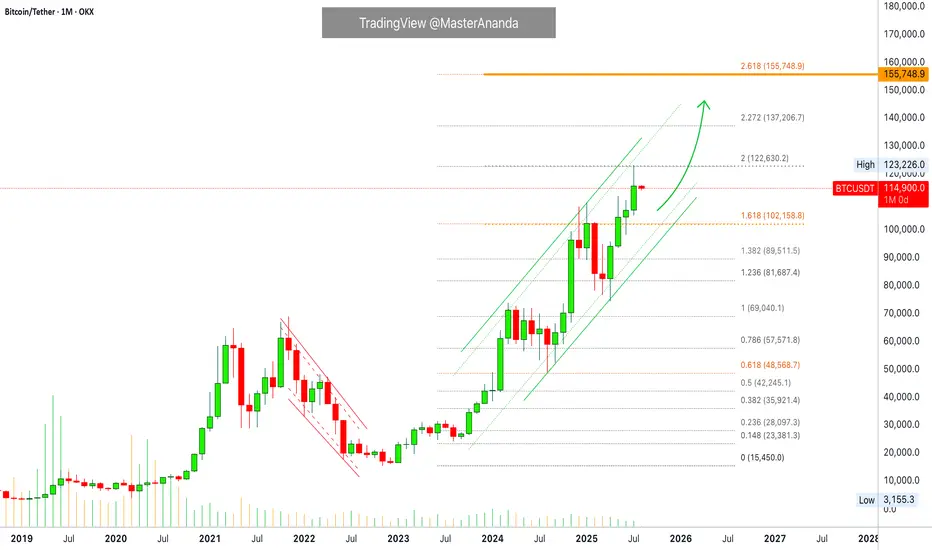
Bitcoin Monthly · Parabolic Rise ContinuesLast month Bitcoin produced its best numbers ever. The highest wick and close, a new all-time high at $123,226.
Bitcoin is not exhausted on the monthly timeframe but there is room for a retrace before the month ends. Think of the first part of the month being mixed, neutral or even bearish while the second half becomes full time bullish.
The levels that are relevant are $122,000 on the bullish side and $102,000 on the low. Right now the action is happening close to the middle so anything goes.
In 2020 Bitcoin produced 7 monthly candles growing and this was repeated again in 2023. In 2025 we have so far four green candles which means that Bitcoin can easily continue to grow. It has been known to produce more than four months green many times but there can be exhaustion at some point.
Bitcoin has been moving within a strong uptrend and is likely to continue rising. Bullish until the chart says otherwise. We are going up. Short-, mid- and long-term.
As Bitcoin consolidates near resistance, the altcoins will continue to build strength in order to grow. Remember, we are still looking at bottom prices across thousands of altcoins. Only a few moved ahead and are trading at all-time highs, the rest will catch up. The time is now, late 2025. The best is yet to come.
Namaste.
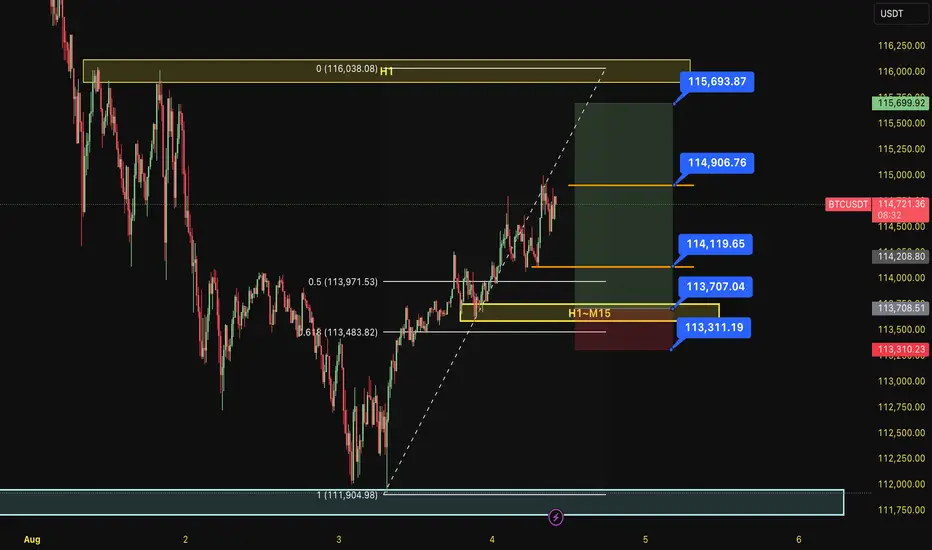
BUY BTC 4.8.2025Confluence order: BUY at H1~M15
Type of order: Limit order
Reason:
- The current top is not touching anything, expected to rise to the H1 above.
- M15~FIBO 0,5-0,618 (same position)
Note:
- Management of money carefully at the last bottom (114,119)
Set up entry:
- Entry buy at 113,707
- SL at 113,311
- TP1: 114,119 (~1R)
- TP2: 114,906 (~3R)
- TP3: 115,963 (~5R)
Trading Method: Price action (No indicator, only trend and candles)
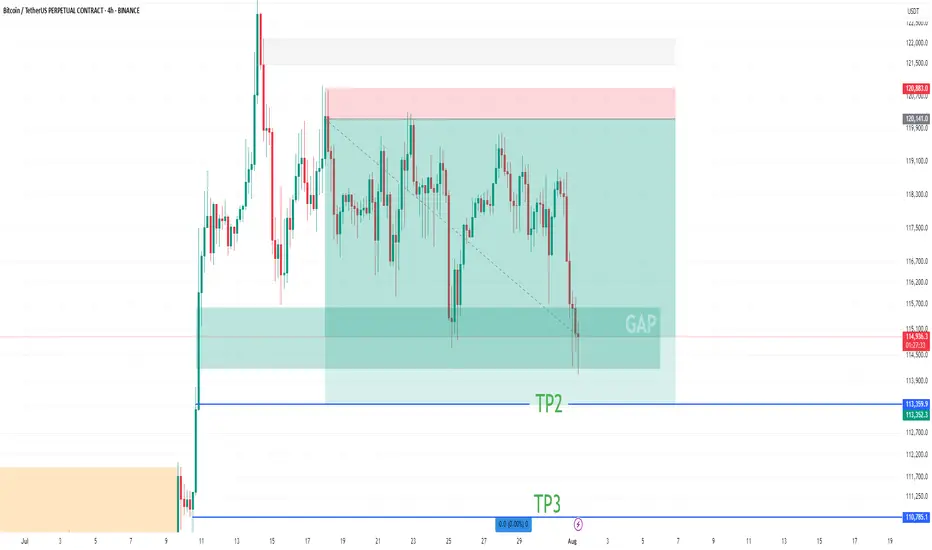
BTC Short Update Hello ❤️
Bitcoin
Let's have an update on Bitcoin analysis
💁♂️ First Target 🔥
Near Second Target
According to the analysis I posted on the page, Bitcoin touched the first target and is now near the second target
It is a good place to save profits. The price gap is filled
Please don't forget to like, share, and boost so that I can analyze it for you with more enthusiasm. Thank you. 💖😍
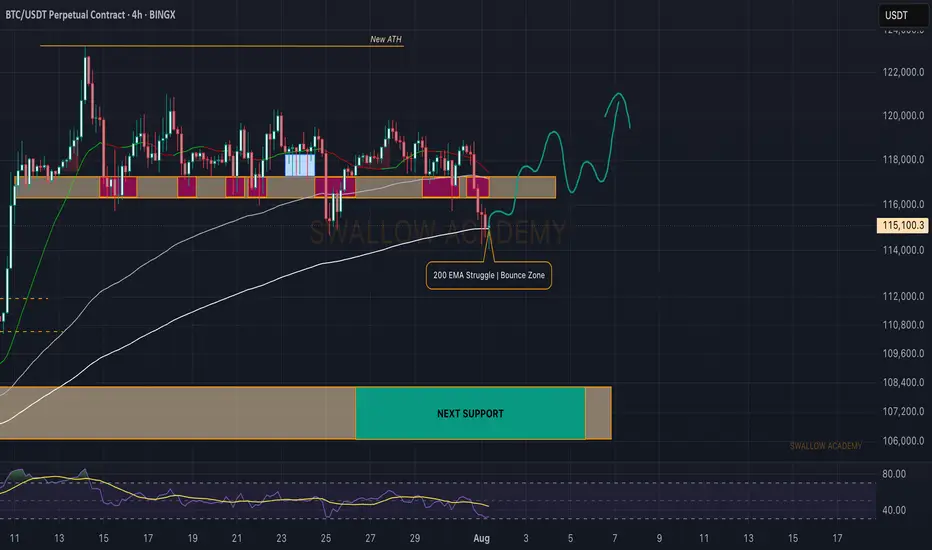
Bitcoin (BTC): 200EMA is Key Are Currently | Red Monthly OpeningBTC had a really sharp start to the month, and we are back near $115K, which was a key zone for us last time (due to huge orders sitting there).
Now, we see a similar struggle like last time but not quite the same, as the 200EMA has aligned with the $115K area. We are now looking for any signs of MSB, as we think we might get a recovery from here.
Now if we do not recover right now (by the end of today), we are going to see a really deep downside movement during the weekend most likely!
Swallow Academy
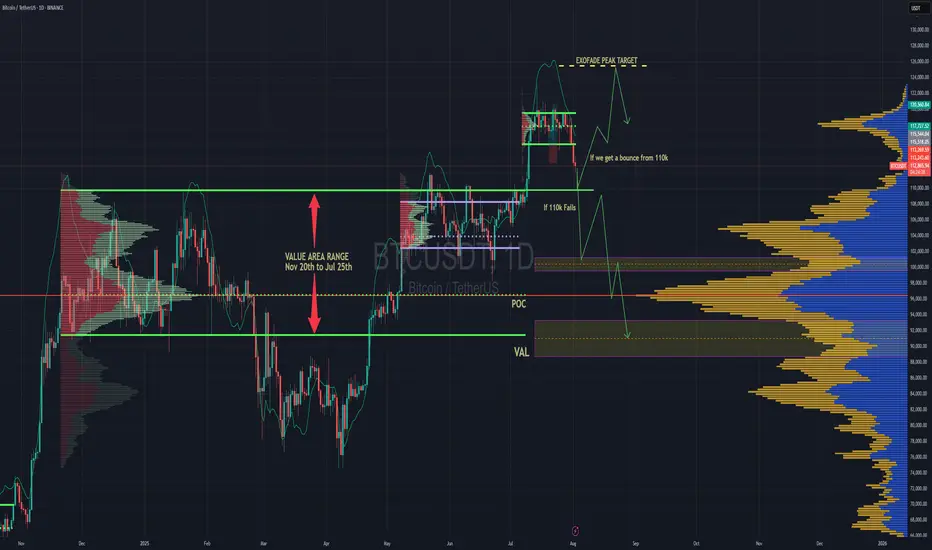
BTC Forecast For August & September. The Only Roadmap You Need !This is one is so obvious, its a no brainer , and would likely be very easy to trade as long as you follow this road map i have provided.
The Value Area High at 110k price range is most important upcoming battle line between bull vs bear. If bulls fail to get a strong bounce from 110k and we close at least 2 daily candles below it. Then it would mean bears have full control and the implication of that is that since we would at that point be closing back inside an established Value Area range, formed between Nov 20th to Jul 25th, then it would mean the probability of price selling all the way down to re-test the VAL (value area low) at $91.6k would instantly become very very high.
After re-testing $91.6k we'll watch and see what happens.
It'll either hold after grabbing some liquidity below and stay in the Value Area Range until further notice Or we lose it and the sell off continues. Bear market will be in full swing if that happens and you can bet a ton of weak hands will start to exit due to max pain & cascading long liquidations. Fear index will be back in the red at that point as capitulation starts to set in. Alot of new alts and meme coins will be completely obliterated.
Bullish Continuation Scenario
If bulls get a strong bounce from 110k and don't close back inside the Value Area Range below, then we could continue up to a make a new ATH for a classic trend pullback continuation trade. Once we get back above 115.4k, the dream of a new ATH will become much more realistic. There is an UFA(Unfinished Auction) at 120.8k which is only visible to traders using the market profile or footprint chart. This make poor high and needs to be taking out at some point.
For the Price target to the upside, we would be using the peak formation line of the ExoFade indicator.
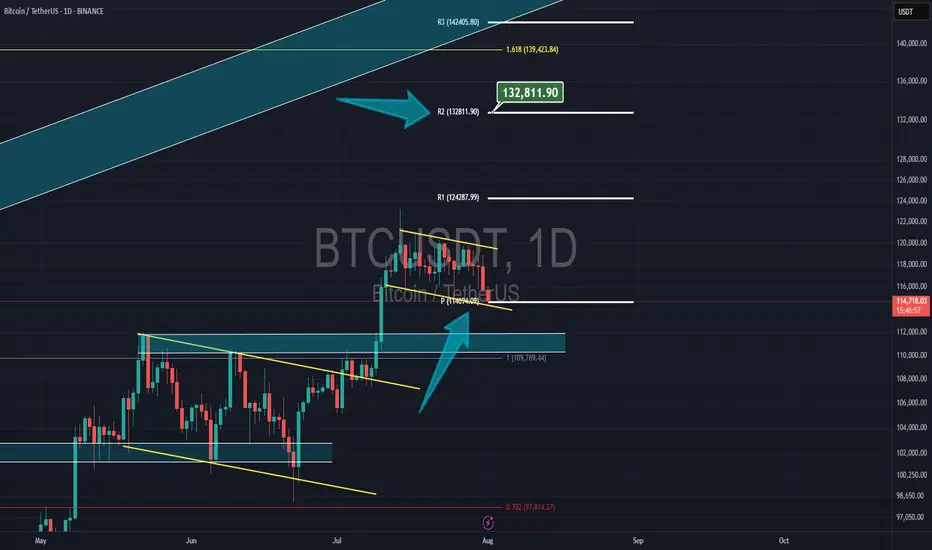
Bitcoin & NEW monthly PivotBitcoin had a correction yesterday but now its still above the new monthly pivot at $14,700 and my target is the 2nd resistance of the pivot at $132,800
Bitcoin : Stay heavy on positionsBitcoin : Stay heavy on positions (2x)
Short-term overbought is noise. Focus on the bigger picture.
For new Bitcoin entries, now is the time.
If you're using leverage, I’d wait for a scale-in signal before jumping in.

BTCUSDT: Trend in daily time frameThe color levels are very accurate levels of support and resistance in different time frames.
A strong move requires a correction to major support and we have to wait for their reaction in these areas.
So, Please pay special attention to the very accurate trend, colored levels, and you must know that SETUP is very sensitive.
BEST,
MT
