BTC, ETH & Market Structure Outlook – Is the Pullback Over or Ju
💎🚀 BTC, ETH & Market Structure Outlook – Is the Pullback Over or Just Beginning? 🔥♦️
🧠 Dow Theory | Multi-Cycle Technical Breakdown | Index Watch
👉 Don't forget to LIKE, FOLLOW, and COMMENT to support the content!
♦️ BTC/USDT Analysis
🔻 The key support at 115,725 was broken – but has the macro trend turned bearish? Not yet.
📉 From the HWC (1D) perspective, BTC has dropped only ~4.5%, which still looks like a pullback.
🟥 However, if price stabilizes below 109,000, we will begin shifting to a bearish macro bias.
🧠 Weakness in trend is present but not confirmed.
🔄 MWC (4H) – Sideways, Then Breakdown
📊 After a strong rally, BTC ranged for about 17 days, then broke below the range support.
🔽 The 4H trend leans bearish, but it's not a strong or confirmed downtrend.
⏱️ LWC (1H) – Clearly Bearish
📉 Lower highs and lower lows are forming. The trend is decisively downward in 1H.
🚀 Bullish Scenario:
If BTC bounces from 112,000, we need:
• A strong new high
• A healthy pullback
• A breakout of the new high → then long entries are valid
❗ Bearish Scenario:
If 109,000 breaks with volume → strong bearish continuation likely.
♦️ ETH/USDT Analysis
🔸 The 3538 level is key.
✅ If ETH shows clear reaction, followed by a breakout, a long position becomes valid.
⚠️ But only after a confirmed trend shift on the 4H timeframe.
♦️ Top Altcoins
⭕ Most alts are in an uncertain phase.
🕒 It's best to wait until new highs/lows and a valid structure are formed.
♦️ BTC Dominance (BTC.D)
💥 BTC.D broke through the critical 62.22 level.
🟡 Now we wait: Will it hold above or fake out and reverse?
🔻 If BTC is dropping while BTC.D is rising →
👉 Result: BTC drops moderately, but alts drop much harder.
♦️ USDT Dominance (USDT.D)
📉 This chart reflects market fear & greed.
Currently showing reduced greed (risk-off behavior).
🔸 Next resistance levels: 4.63 and 4.72
❗ If these break → bearish bias becomes dominant.
⭕ However, a fakeout here could create a fast early entry opportunity.
♦️ TOTAL Market Cap
📍 Market is sitting on a major support level – but BTC remains the key driver.
❗ No confirmed long setups until BTC structure shifts bullish.
♦️ Strategic Outlook
1️⃣ Not a good time to open fresh positions – wait for clear 4H structure formation
2️⃣ Bias remains bullish overall, but waiting for confirmation
3️⃣ Until BTC trend clearly reverses, we are not focused on BTC.D reversals – they remain secondary
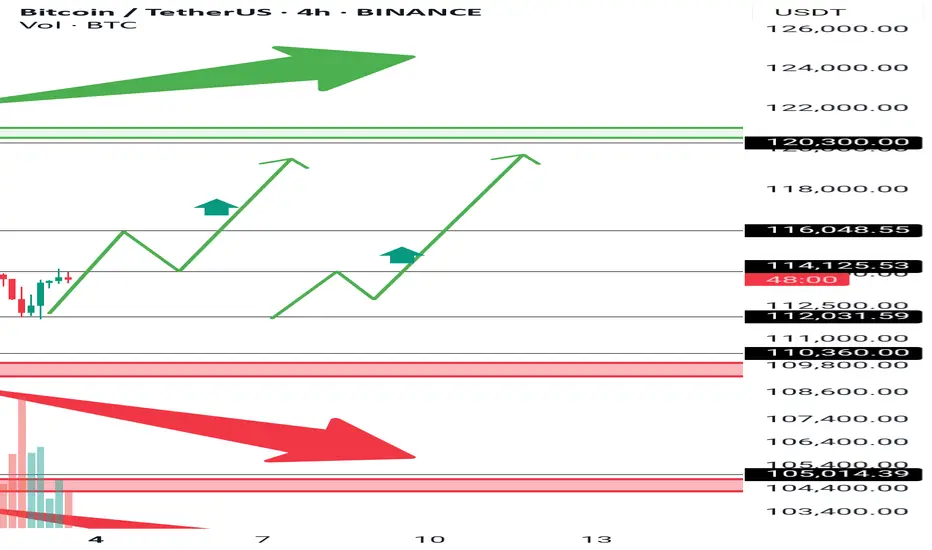
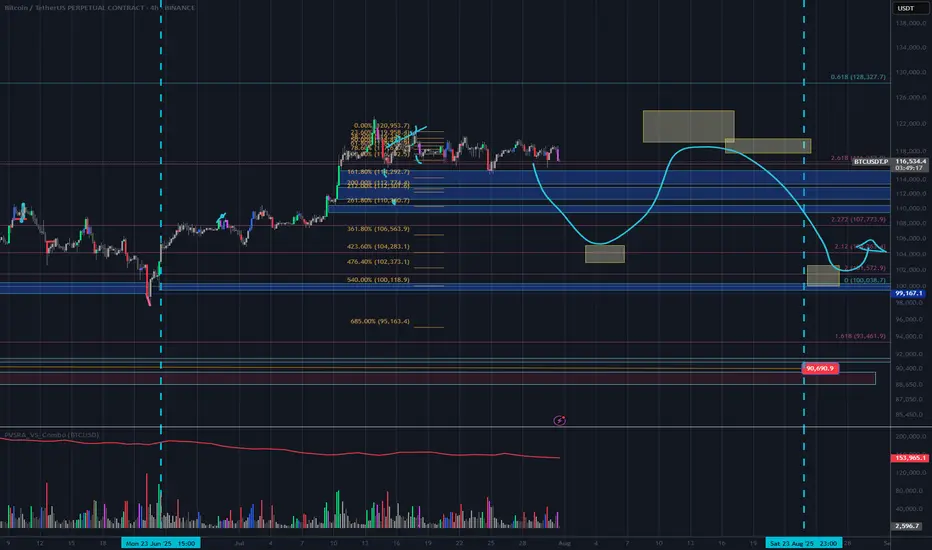
4️⃣ On the Bitcoin chart, you can see another red zone — breaking the first one will invalidate the bullish outlook, and breaking the second one will trigger a search for short positions.
5️⃣ To return to a strong uptrend, breaking the green zone around 120,000.00 is essential.
6️⃣ I’ve drawn two green upward paths on the chart. I’ll be looking for such a path for an early long entry.
💎 Stay cautious, manage risk, and follow structure!
🚀 Smash that ROCKET, leave a LIKE, and hit FOLLOW for daily crypto insights!
USTBTC trade ideas
Bitcoin at Key Support - Watching for Bullish ShiftHello everybody!
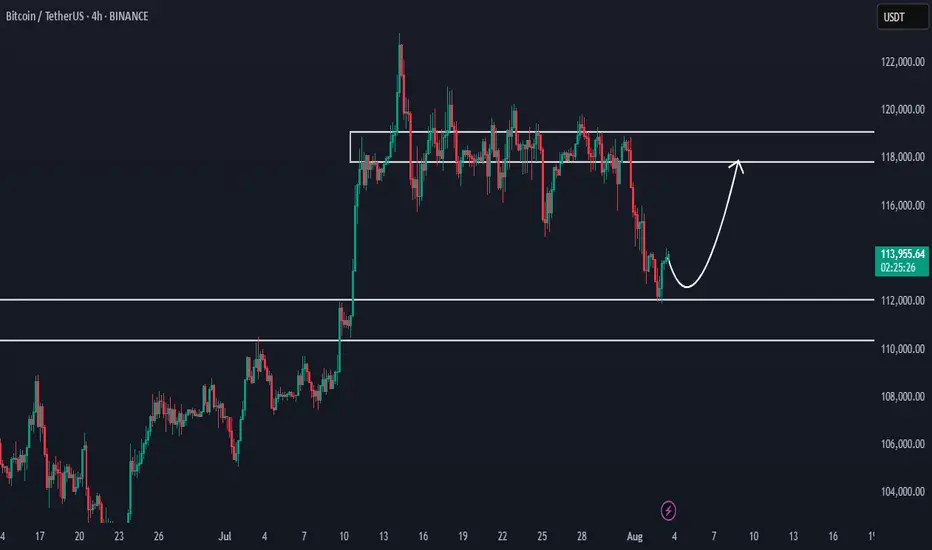
Bitcoin has reached a very important demand/support zone between 110,000–112,000.
If this area holds, we could see bullish momentum building on the chart.
Currently, we are waiting for confirmations.
We're watching closely for any change in market structure or a trend shift.
If it happens, we can expect the price to move up to around 118,000.
Manage your risk and trade safe!
BTC 4H – Support Tapped 2x After Breakout, Will Bulls Step In?Bitcoin is retesting a major demand zone that launched the last breakout. After a sharp impulse move, price has ranged tightly and just tapped this support area for the second time.
A clear double bottom attempt is forming, but failure to hold $115K could open the door to deeper downside. Bulls want to see a quick reclaim of $117K to confirm structure still holds.
Clean levels. Clear reaction zones. Let’s see who takes control.

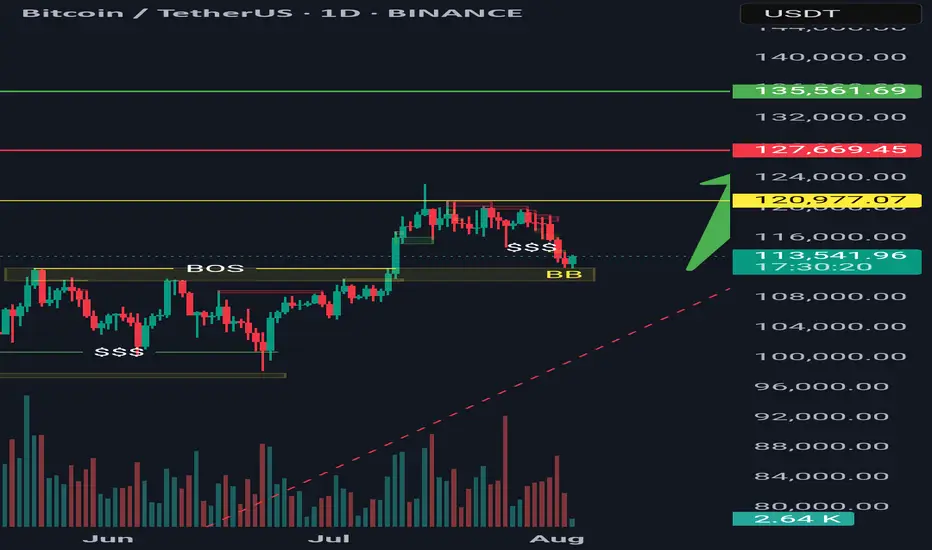
Bitcoin possible bullish momentPrice has pulled back into the Bullish Order Block.
A bounce from the 113K–111K zone is expected.
Targeting next levels of imbalance and liquidity:
TP1: 120,977 USDT
TP2: 127,669 USDT
TP3: 135,561 USDT
BTC NEW LOOKBtcusd sell from 115,000
Target1 114,000
Target2 112,000
Target3 110,000
Stope Lose 116,500
TRADE AT YOUR OWN RISK

Bitcoin Overall: Still Expecting new ATHIndicated are the supports I’m watching. If price goes below the ‘invalidation leg’ I consider the btc bull market to be over.

How to Capture Reversals/Breakouts with MAD IndicatorBTC/USDT 15M – Market Anomaly Detector (MAD) Captures Reversals & Breakouts
⸻
Description:
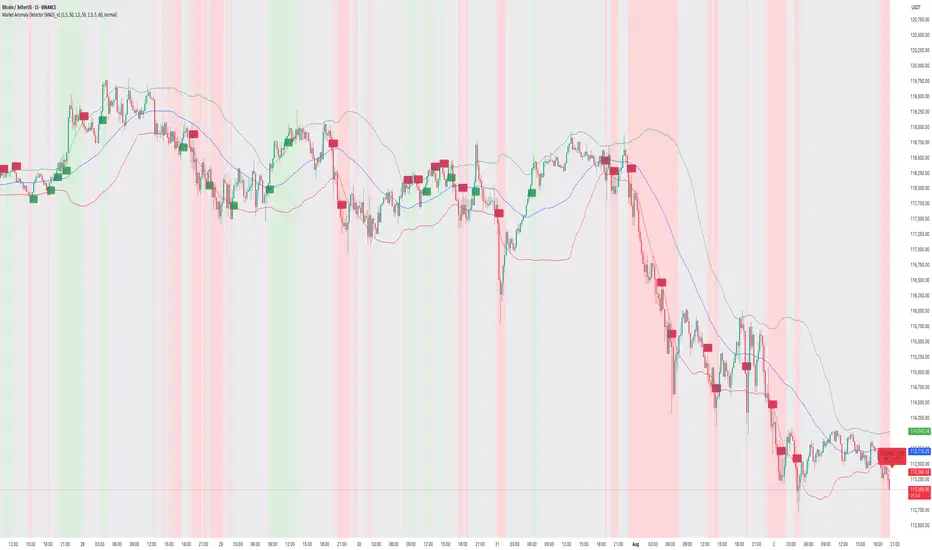
On this BTC/USDT 15-minute chart, the Market Anomaly Detector (MAD) is actively highlighting high-probability market turning points and anomaly zones.
Key Observations from the Chart:
1. Green & Red Zones = Expected Price Range
• Green Line (Upper Band): Expected top of the range.
• Red Line (Lower Band): Expected bottom of the range.
• Price usually travels green → red → green, forming a natural oscillation.
2. Buy/Sell Signals = Breakout + Reversal Detection
• Buy Signal: Triggered when price closes above the green line or recovers from below the red line.
• Sell Signal: Triggered when price closes below the red line or rejects from the green line.
• This reverse psychology logic helps catch false breakouts and stop-loss hunts.
3. Performance on This Chart:
• Signals aligned with key reversals during the sideways-to-downtrend transition.
• The strong downtrend in the second half of the chart shows multiple accurate sell signals, confirming trend continuation.
• Sideways movements had minimal false signals due to cooldown + volume filter.
4. Unique Advantage (USP):
• Statistical approach using Z-Score & Standard Deviation.
• Multi-filter confirmation with RSI, volume, and higher timeframe trend.
• Visually clear anomaly zones:
• Green background = Bullish anomaly
• Red background = Bearish anomaly
• Gray background = Neutral range
Takeaway:
MAD helps traders anticipate anomalies rather than react late, offering high-probability trade entries and reversals in trending and volatile conditions.
Three White Soldiers & Three Black CrowsHello, Traders! 😎
In technical analysis, not all candlestick patterns are created equal. While some merely hint at indecision or short-term corrections, others shout with conviction: "Trend reversal is coming…" Two of the most powerful momentum candlestick formations are the Three White Soldiers and the Three Black Crows. When they appear, traders PAY ATTENTION. In this article, we’ll dive deep into: What do these patterns look like? Why do they form? What do they tell us about market psychology? How to trade them?+ Their limitations 👇🏻
What Are Three White Soldiers and Three Black Crows?
These Are Multi-Candle Reversal Patterns That Suggest A Strong Shift In Market Sentiment:
Three White Soldiers. A 🐂bullish reversal pattern that occurs after a downtrend. It consists of three consecutive long-bodied green (or white) candles, each closing higher than the last, and ideally opening within the previous candle’s real body.
Three Black Crows. A 🐻bearish reversal pattern that shows up after an uptrend. It’s made of three consecutive long-bodied red (or black) candles, each closing lower than the last and opening within the previous candle’s real body. They signal not just a change in price, but a shift in power, from sellers to buyers (or vice versa).
Candles With a Message
Unlike most one-candle signals or minor patterns, these sequences tell a real story. They show that one side has taken clear control over the market — not for an hour, not for a single day, but for multiple sessions. And that kind of shift, especially on higher timeframes like daily or weekly charts, is something seasoned traders pay close attention to.
Let’s get into the psychology for a second. Imagine you’re a trader who just watched BTC drop for two weeks. Then out of nowhere, three strong green candles appear, each more bullish than the last. You’re seeing buyers push through resistance levels like they don’t even exist. That’s not just a bounce, that’s confidence. That’s the kind of thing that makes people FOMO back in, or finally close out their shorts. Same with the Black Crows. If the price has been climbing and suddenly sellers start hammering it for three days straight? That’s not retail panic. That’s big money exiting.
Now, How do Traders Trade Them?
Well, a lot of people jump in right after the third candle closes. If you’re going long on the Three White Soldiers, you’re betting that the breakout has legs. Same for shorting the Black Crows.
But, and here’s the trap, not all of these patterns play out. Sometimes, that third candle is the climax, not the beginning. So confirmation matters. Volume should increase. The move should break a recent key level. Indicators like RSI or MACD should support the shift. Otherwise, you might just be catching the end of a move, not the start of one.
Another mistake? Ignoring context. These patterns mean nothing if they’re forming in the middle of chop or during low-volume holiday trading. They work best when they signal the end of exhaustion.
And let’s be honest. Even if the pattern is clean, you still need a plan. Stops should go below the first green candle (for bullish setups) or above the first red one (for bearish setups). If price moves against you, it means momentum never really shifted. That’s your cue to get out fast.
Final Thoughts
Three White Soldiers and Three Black Crows are powerful tools in the hands of a patient trader. Of course, these patterns aren’t perfect. They don’t account for time, so a 3-day move might seem powerful, but if it happens slowly over 12-hour candles, it’s not as strong as the same pattern on a daily chart with volume.
The takeaway? These are patterns worth knowing, not because they’re magic, but because they reflect a real shift in market behavior. When Three White Soldiers or Three Black Crows show up in the right place, at the right time, with the right confirmation… that’s when charts stop being random and start making sense. But remember. They are indicators, not guarantees. The best traders use them in conjunction with other tools and a clear trading plan.

BTC AI Prediction Dashboard - 6h Price Path (31.07.25)
Prediction made using Crypticorn AI Prediction Dashboard
Link in bio
BTCUSDT Forecast:
Crypticorn AI Prediction Dashboard Projects 6h Price Path (Forward-Only)
Forecast timestamp: ~14:00 UTC
Timeframe: 15m
Prediction horizon: 6 hours
Model output:
Central estimate (blue line): -118,124
Represents the AI’s best estimate of BTC’s near-term price direction.
80% confidence band (light blue): 117,836 – 118,977
The light blue zone marks the 80% confidence range — the most likely area for price to close
40% confidence band (dark blue): 117,650 – 119,908
The dark blue zone shows the narrower 40% confidence range, where price is expected to stay with higher concentration
Volume on signal bar: 177.26
This chart shows a short-term Bitcoin price forecast using AI-generated confidence zones.
Candlesticks reflect actual BTC/USDT price action in 15-minute intervals.
This helps visualize expected volatility and potential price zones in the short term.

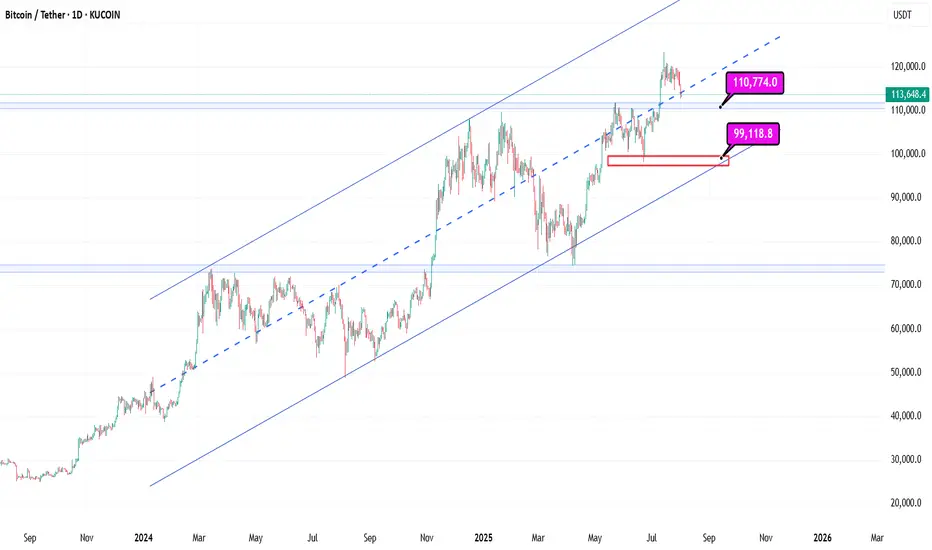
Bitcoin Support: Midline Channel Support at 114kBitcoin
1D
Bitcoin Support: Midline Channel Support at 114k and then Blue Line 110k
With these supports holding in the long term, progress is still possible
BITCOIN - Price can turn around and start to move upHi guys, this is my overview for BTCUSD, feel free to check it and write your feedback in comments👊
The price reversed its prior downtrend with a decisive breakout from a falling channel.
This breakout triggered a strong upward impulse, which then began to consolidate into a large symmetrical pennant.
However, the price recently failed to hold the lower support trendline of this pennant and broke to the downside.
The asset is currently trading just below this broken trendline, in what appears to be a liquidity grab.
To continue upwards, buyers must now overcome the immediate resistance located at the $116300 level.
I expect that this breakdown was a fakeout, and the price will soon reverse, break through the $116300 resistance, and continue its rally toward the $121000 target.


Bitcoin is Coming to it's Support #BitcoinHello Trader's
Here's some info about selling pattern formed in Bitcoin
Check out this level..
How many off you traded this selling

BTC 108K - 112K ZONE Why 108k to 112k zone is important?
Bitcoin recently made a new all-time high and is now undergoing a healthy correction — nothing to worry about.
The $108,000 to $112,000 zone is a key support area due to three major factors:
1. Strong previous support level
2. A daily trendline aligning with this zone
3. 50% Fibonacci retracement of the recent impulse move
If this support holds, there's a strong possibility Bitcoin will form a new ATH around $130,000 to $140,000.
DON'T PANIC wait for confirmation and see the magic 🚀 🚀

BITCOIN & 134KAfter Bitcoin rallied on July 8 and consolidated for two weeks, this bull flag remains valid, targeting $134,000.

Targets and their point in timewe use the threshold breaks to determine targets AKA areas of liquidity. we also utilize pattern detection paired with the threshold breaks to validate cycles and where we are in said cycle.
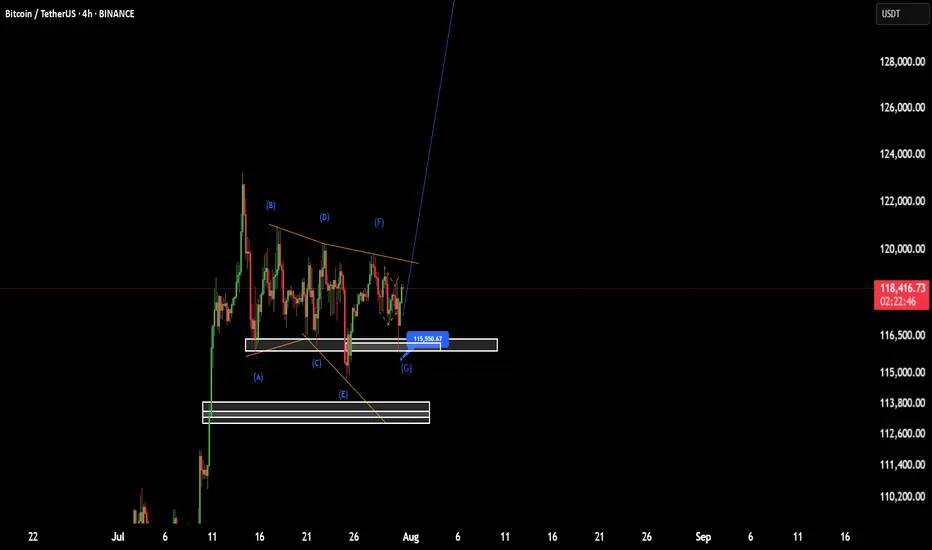
BTC(based on NEo wave)I think wave G is finished and soon it will pump to 138K.
stop loss is 115500.
attention:138K is the first target of these bullish waves.
Daily Bitcoin AnalysisBitcoin is at support at $115,000. Personally, I think this support will not hold and it will reach the next level of 112,000. Why? Because the downward momentum of the price is high.
This is not financial advice

2 Scenarios for BTCNow that the cup and handle formation has been reached and the correction finished, I think we have 1 more leg up.
It's also possible that we fall from here, but I think another fakeout upwards is likely as bearish divergence forms on the month, but isn't quite there yet (RSI needs 1 more higher high to confirm bearish divergence)
Either way, my short targets are the 0.618 fibs. I am expecting the typical -70-75% crash by 2027 before the next cycle begins

BITCOIN PREDICTION: NOBODY IS WATCHING THIS PATTERN !!!(warning)Yello Paradisers, I'm updating you about the current Bitcoin situation, which is extremely dangerous for crypto noobs that will get rekt again very soon!
It's going to be a big move soon. I'm telling you on a high timeframe chart we are doing multi-time frame analysis and on a high timeframe chart I'm updating you about the RSI indicator, the bearish divergence, the moving average reclaim, and the channel reclaim that we are having right now.
We are observing a shooting star candlestick pattern, which is a reversal sign, and I'm telling you what confirmations I'm waiting for to make sure that I can say with the highest probability that we are going to the downside. On a medium timeframe, I'm showing you two patterns: one is a head and shoulders pattern, then a contracting triangle, and on a low time frame, I'm sharing with you the ending diagonal because on a high time frame chart, we are either creating ABC or impulse, and I'm telling you what the probabilities are for the zigzag, which is a corrective mode wave, or the impulse, which is a motive mode wave.
I'm sharing with you what's going to happen next with the highest probability. Please make sure that you are trading with a proper trading strategy and tactics, and that's the only way you can be long-term profitable.
Don't be a gambler. Don't try to get rich quick. Make sure that your trading is professionally based on proper strategies and trade tactics.

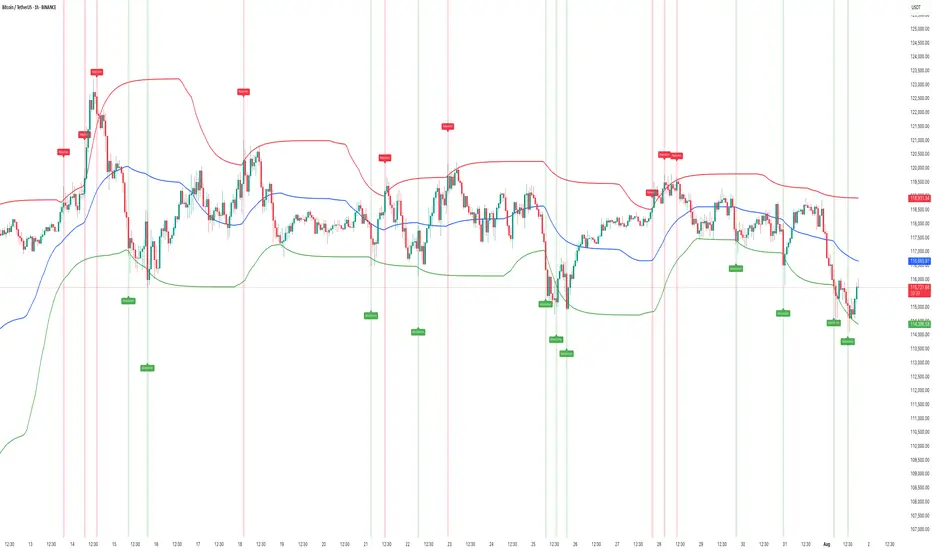
HOW TO Spot Liquidity-Driven Reversals & Market TrapsAdaptive Liquidity Pulse
🎯 Spot Liquidity-Driven Reversals & Market Traps
The Adaptive Liquidity Pulse is designed to help traders detect high-volume rejections and absorptions, revealing where big players are likely defending or accumulating positions. This indicator is especially useful for spotting market traps, liquidity sweeps, and swing reversals.
⸻
🧠 How It Works
1. Dynamic Liquidity Zones
• Red Band (High EMA) → Potential supply/rejection zone
• Blue Band (Mid EMA) → Equilibrium / magnet zone
• Green Band (Low EMA) → Potential demand/absorption zone
2. Signal Labels
• 🔴 Rejection → Price spikes into high liquidity with volume → Bearish bias
• 🟢 Absorption → Price flushes into low liquidity with volume → Bullish bias
3. Volume-Weighted Detection
• Only triggers signals when volume exceeds a configurable threshold
• Filters out weak moves, highlighting true liquidity events
⸻
📊 Best Use Cases
• Scalping & Intraday Trading: Identify early reversal points
• Swing Trading: Track absorption/rejection cycles to time entries/exits
• Liquidity Sweep Detection: Spot where false breakouts occur with volume confirmation
⸻
⚡ Trading Tips
• Use Rejection (Red) for short entries or take-profits near highs
• Use Absorption (Green) for long entries or short exits near lows
• Combine with support/resistance zones or trend structure for higher accuracy
• Midline (Blue) often acts as a mean-reversion magnet in ranging markets
⸻
📢 Alerts
• 🔴 Rejection Alert → Strong selling pressure at liquidity zone
• 🟢 Absorption Alert → Heavy buying at demand zone
⸻
🧠 Why Traders Love It
• ✅ Visualizes hidden liquidity interactions
• ✅ Highlights trap zones before reversals occur
• ✅ Works across crypto, indices, forex, and commodities
• ✅ Designed for confluence with other strategies
⸻
This script gives you a real-time pulse of liquidity shifts, allowing you to trade like institutions and avoid falling into retail traps.
⸻

BTC bullish div.Bullish divergence on the 15m and 1H chart 📈
Liquidity grabbed 📈
Expecting a small move up = 1.6%
Long scalp trade if youre interested
