BTCUSD WILL FLY HIGHAccording to H1 analysis BTCUSD is in flying pressure from last few days and market break the resistance level and make RBS resistance become support
market will be falling soon and reached at support level if you want then go long from support level
TRADE AT YOUR OWN RISK
USTBTC trade ideas

BTC Breaks 116k!We did break the 116k level. But it is not clear yet whether the breakout is bullish or not.
Plotted range extremes let's see

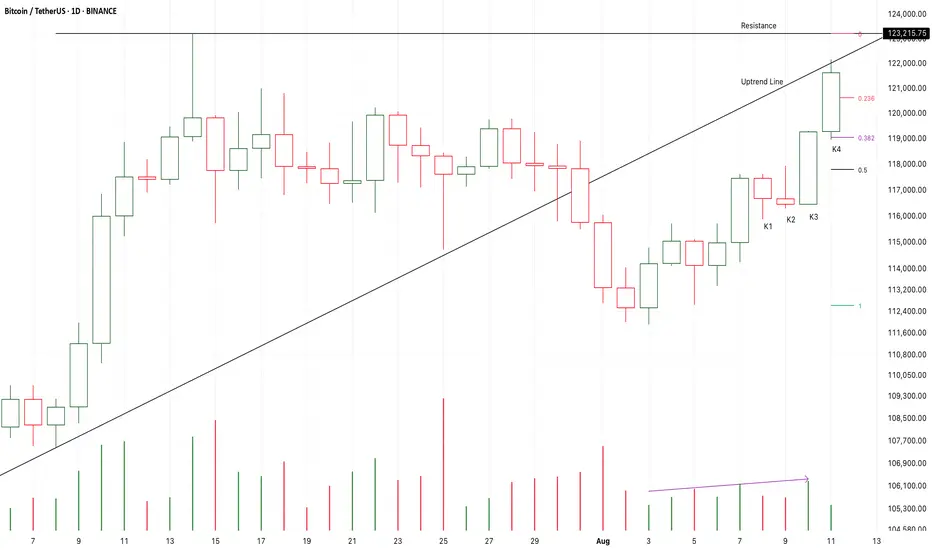
Chart Pattern Analysis Of Bitcoin.
K3 and K4 verified an accelerating motive wave of a short-term uptrend.
I am leaving from 119K to 123K.
I am expecting a consolidation around the resistance.
If the following candles fall to test 0.5fib area,
I will try to buy it there.
Long-118K/Target-125K/Stop-116.5K
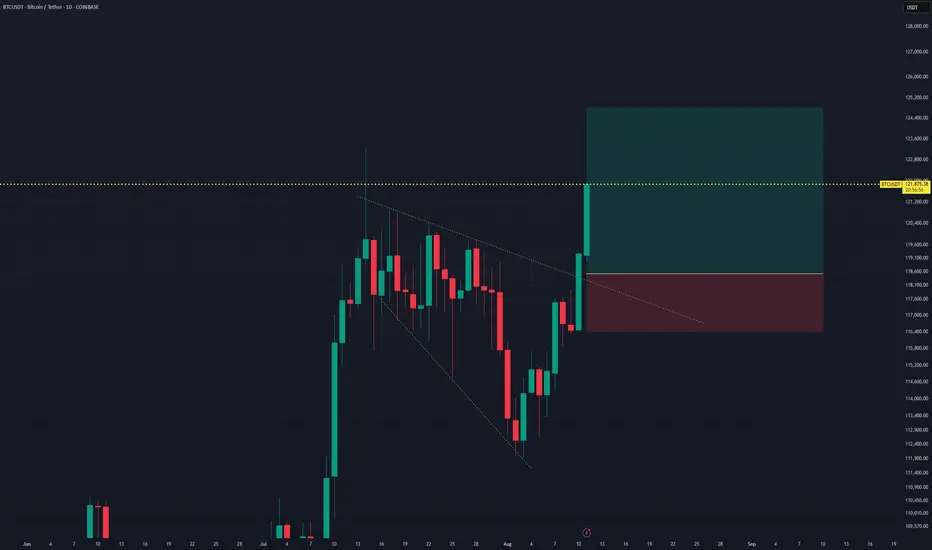
BTCUSDT Bullish Breakout Setup From Descending TriangleTrade Setup Analysis
- Timeframe: Daily (D1)
- Position Type: Long (Buy)
Entry Point: 118,530.49
Positioned immediately after a breakout from a descending triangle pattern, aiming to catch early bullish momentum.
Stop Loss (SL): 116,429.15
Placed below recent swing lows and under the lower trendline of the triangle. A break below this level would invalidate the bullish breakout thesis. Risk exposure is approximately -1.77% from entry.
Take Profit (TP): 124,868.05
Target set at a key resistance zone, offering a potential upside of around +5.30% from entry.
Risk/Reward Ratio: 2.99
A strong setup with nearly three times the reward compared to the risk, suitable for short-term swing trading.
Technical Outlook:
BTCUSDT has broken out of a descending triangle formation with a strong bullish candle, indicating possible continuation. The entry at 118,530 positions the trade close to the breakout point, maximizing profit potential if momentum holds.
Bullish Scenario: Sustained price action above 118,530 could lead to a rally toward the 124,868 target.
Bearish Invalidation: A breakdown below 116,429 would invalidate the bullish setup, potentially resuming the prior downtrend.
Summary:
This trade captures a breakout confirmation with a well-placed stop below structural support and a target aligned with the next resistance level. Monitoring for follow-through buying pressure is key to validating the trade.
BTCUSD : Long levelHere is a great entry point for those who scalp this instrument or pips. The level is marked with a green arrow. It will be active until I report. It may become inactive over time.
Watch out for trading on the news.

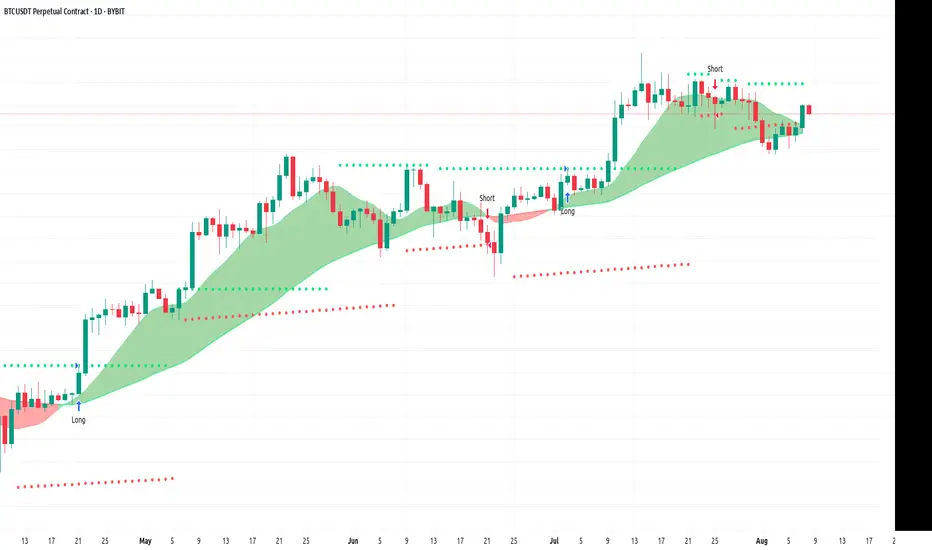
BTC Overall: Grinding higherBTC continues to grind higher, however, another (at least smaller) corrective phase should occur soon. We may hit the important supports below after all or we may hold the local low. After this process completes we should see new ATH. Corrective phases are difficult to predict unfortunately!

4RR (short)This is a risky trade, it is based on a continuation of the previous laddering down. We are approaching the Real leg of the move. If there’s going to be a reversal, it should happen quite soon. It has a good risk reward, so only take it for a small amount risk. Theoretically price should move below the indicated take profit as well in three waves..

BTC retracement levelsWe have broken out of a downtrend however I think BTC might see a bit of a pullback early in the week.
Observing a bearish div. And looking at a break inthe RSI uptrend.
There is a liquidity Zone between 114.7K - 115.7K which would also coincide with the 618 fib.
I think that one lf two paths is likely to play out:
1) a bounce off the 0.5 fib and said downtrend.
2) a bounce off the 618 fib which would bring back underneath the downtrend before eventually moving up again to the 120K region.
I think option 2 is more likely as there is liquidity here to grab and would also fake-out the bulls.
Both options are expected to happen approximately by Wednesday.
Once we get to the 120K zone I think this will send BTC into a parabolic run into end of the Q4.

Bitcoin Btc usdt Daily analysis
Time frame daily
As you can see byc is moving up and down in the green tunnel
My last target (yellow rectangle) is touched and byc couldn't break the upper side of tunnel
Now, my target is 120.000 $ ( red rectangle)
If this time , btc can break the green uptrend line as resistance line , my next target is 145.000$,
👉👉Important notice 👈👈
Here is not suitable Time for entry the long or short position because btc is in the middle of the tunnel

BTCBtc usdt Daily analysis
Time frame hourly
Risk rewards ratio =2
Target 107.000$
LS is very tightly so I have no problem with stop hunters
Btc is charging its energy to pump and reach the new high

Navigating CPR's on BTCNavigating CPR's on BTC - Focusing mainly on narrow CPR's and following what they predict

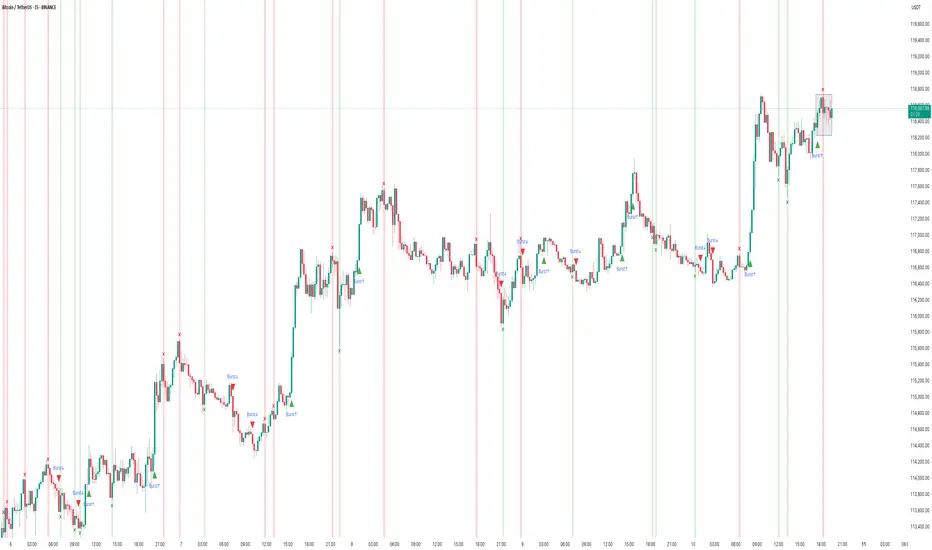
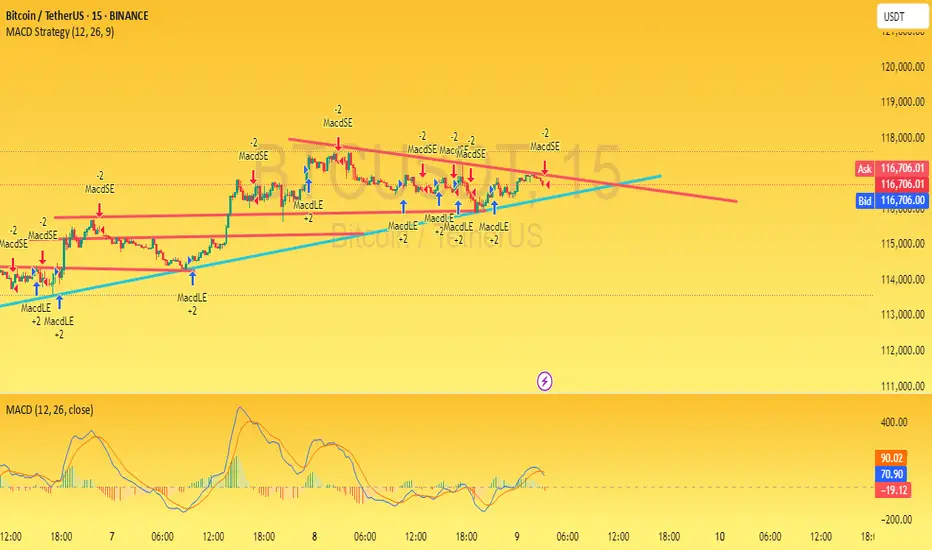
How the PCCE + False Breakout Detector Performed in BTCChart: BTC/USDT (15m – BINANCE)
Tool Used: PCCE + False Breakout Detector
Type: Educational – How to interpret breakout and trap detection.
🟢 What the Indicator Does:
The PCCE + False Breakout Detector blends two core functions:
1. Price Coil Compression & Expansion (PCCE): Finds tight volatility compression zones and signals when price bursts out with strength (Burst↑ or Burst↓).
2. False Breakout Detection: Flags bull and bear traps when breakout moves fail to hold beyond recent swing levels.
This pairing gives a setup phase (compression), a confirmation phase (burst), and a risk filter (trap detection).
✅ Recent Performance Highlights:
📈 Early Session:
• Several Burst↑ and Burst↓ signals emerged during small compression ranges.
• A Burst↑ around 06:00 marked the start of a steady climb, confirming breakout alignment with volume/trend filters.
📉 Mid Session:
• A Burst↓ appeared, but price quickly reversed upward.
• The reversal was flagged as a bear trap (green ❌), warning traders of a failed breakdown.
📈 Late Session Rally:
• Around 15:00, a compression zone formed before a strong upward move.
• The breakout printed a Burst↑ and continued into a multi-hundred-dollar rally.
• Shortly after, a bull trap (red ❌) was flagged at the top — price stalled and pulled back within minutes.
🔍 Interpretation:
• Burst↑/↓ = Entry cues from high-probability volatility expansions.
• ❌ markers = Real-time warnings that a breakout may fail, helping avoid false momentum plays.
• Combined Effect : Captures early move potential while filtering risky breakouts.
⸻
📚 How to Apply in Trading:
1. Mark coil zones and prepare for potential expansion.
2. Confirm breakouts with Burst signals and, optionally, trend/volume filters.
3. Heed trap markers — they often precede reversals or consolidation.
4. Pair with higher-timeframe analysis for trend bias.

$BTC Breakout LONGI am critical glued to my chart now awaiting the big breakout on this BYBIT:BTCUSDT.P .
If this candle closes just above the trendline, I'm due for some good profit and the breakout will return us to around the 122,000 zones.
This m,eans so much to all holders and will especially usher us into a profitable week.
Note: This is not a financial advice. Do with it, whatever you wish!

The top of the bull market may be nearWe have strong resistance above us that Bitcoin must overcome. There is also strong support below, which determines the boundaries of the range. I see it this way: if the market remains positive for a while longer and no unexpected fundamentals come, we could overcome that resistance over time. Then I see the next ATH and strong resistance at the level between 131,000 and 132,000 USD. I have drawn exactly where I think it works out on the chart. However, it is possible that this will also be the top of this year's bull market.
I have also drawn a possible swing trade that could work with this setup.

BTCUSDT — D1 Bottom Still Not Complete?BTCUSDT — D1 Bottom Still Not Complete?
The market’s process works with precision. Not yet means exactly that — even if price pushes higher, it will eventually return to complete the bottom formation.
On the D1 timeframe, BTCUSDT began forming its bottom on July 24, 2025 at $118,300.
On the W timeframe, BTCUSDT started its upward leg on May 12, 2025 (W’s third peak).
On the M timeframe, BTCUSDT began its upward leg on October 1, 2023 and is now in the process of forming a top before a potential decline.
Our strategy is patience: let BTC complete this final D1 peak.
Potential long entries:
Around $115,500
Or when BTCUSDT officially completes its D1 bottom formation — at which point we can also long altcoins to ride the next wave of capital inflow.

5 RRThis may be a very Nice trade on bitcoin! It looks like it is still trying to reach higher in the short term.

BTCUSDTBTC/USDT Price Chart Analysis
1. Chart Type and Instrument
The provided chart is a line chart that displays the price movement of the BTC/USDT instrument on the Binance exchange. The timeframe used is daily (1D), covering the period from approximately October of the previous year to August of the current year.
2. General Trend
Overall, the BTC/USDT chart shows a very strong and sustained upward trend (uptrend) throughout the displayed period.
* Phase 1 (October 2024 - March 2025): A significant uptrend occurred, with the price of Bitcoin rising from below $60,000 to reach its peak at around $120,000. During this period, there were phases of correction and consolidation (e.g., around March), but the main trend remained upward.
* Phase 2 (April 2025 - August 2025): After the correction in March-April, the price resumed its upward trend. This rally brought the price back to the area of the previous peak.
3. Significant Support and Resistance Levels
* Support: Significant support levels can be identified in a few areas:
* Short-Term Support: The psychological level around $110,000, which served as a consolidation area before the price continued its climb.
* Mid-Term Support: The level around $100,000, which previously acted as resistance and now has the potential to become strong support.
* Long-Term Support: The area around $80,000, which was the base for the price recovery from the April correction.
* Resistance: The most crucial resistance level right now is the area around $120,000. The current price, $116,822.78, is attempting to approach and break through this resistance level. This level represents the all-time high (ATH) or a new historical peak.
4. Important Price Patterns or Formations
The chart shows a repeating pattern of price increases, where a strong upward movement is followed by a correction or consolidation, before continuing the rally. The most relevant event currently is that Bitcoin's price is retesting its historical peak level around $120,000. This movement indicates very strong bullish momentum.
5. Technical Indicators
Although the chart is not equipped with technical indicators, the price action itself provides a clear signal. The price is currently trading near its historical peak, which shows buyer dominance.
6. Specific Reasons for Entry
The BTC/USDT chart is at a critical juncture, attempting to break through the historical resistance level of approximately $120,000. There are two primary scenarios for an entry decision:
* Scenario 1 (Confirmed Breakout - Bullish Entry): The reason to enter a long position is to wait for a valid breakout confirmation. If the price successfully breaks and holds (closes a daily candle) above the $120,000 level, this could be a very strong signal that the uptrend will continue to higher levels. This breakout would indicate that buying pressure is strong enough to overcome selling pressure at the resistance level, opening the way for a significant price increase.
* Scenario 2 (Pullback - Safer Bullish Entry): Another option is to wait for the price to undergo a correction or a pullback to the nearest support level, for example, around $110,000 or $100,000. If these levels successfully hold the price and show signs of a bounce, this could be a safer entry point with a lower risk.
7. Risks and Watch-outs During Entry
* Potential for Failed Breakout (False Breakout): The biggest risk is if the price fails to break through the resistance and instead experiences rejection. The price could rise slightly above $120,000 (as the chart shows) and then quickly reverse, forming a "false breakout." This would lead to losses for traders who entered a buy position without confirmation.
* High Volatility at Resistance Area: Historical resistance areas like $120,000 tend to be zones of high volatility, where a fierce battle between buyers and sellers takes place. Price movements can be very erratic.
* Divergence or Trend Exhaustion: Although this chart does not show indicators, it is important to watch out for signs of trend exhaustion, such as bearish divergence on momentum indicators (RSI, MACD), if you were to use them.
Summary of Entry Decision:
The entry decision at this time is highly dependent on how the price reacts to the $120,000 resistance level. It is not an opportune time to enter aggressively because the risk of a rejection is very high. The best strategy is to wait for confirmation.
* Wait for a confirmed breakout: If the price breaks and holds above $120,000, consider entering a long position.
* Wait for a re-test: If the price experiences a correction (pullback) to the nearest support level ($110,000 or $100,000) and shows signs of a bounce, this could also be a good entry point.

Bitcoin : Stay heavy on positionsSame view as before. No change.
Bitcoin : Stay heavy on positions (2x)
For new Bitcoin entries, now is the time.
If you're using leverage, I’d wait for a scale-in signal before jumping in.

BTCUSDT – Key Resistance Breakout or Rejection? (15-Min AnalysisIn the 15-minute chart of BTCUSDT , the price is currently approaching a significant resistance level. Based on the MACD indicator, bullish momentum is gradually building up, which may lead to a breakout above this resistance. If the breakout occurs with strong volume, the price is likely to move higher, potentially opening the way for short-term bullish opportunities.
However, if the price fails to break above this level and faces rejection, it could signal a shift in market sentiment, leading to a potential downside move. In such a case, we might see the market testing lower support levels in the short term.
Traders should monitor the breakout zone closely and wait for confirmation before entering a position. Managing risk with a proper stop-loss is essential given the volatility on lower timeframes.
$127K Bitcoin in SeptemberBitcoin bullishly moving through major TA areas may be signs its ready for its next leg up. $127k is a FIB extension target.

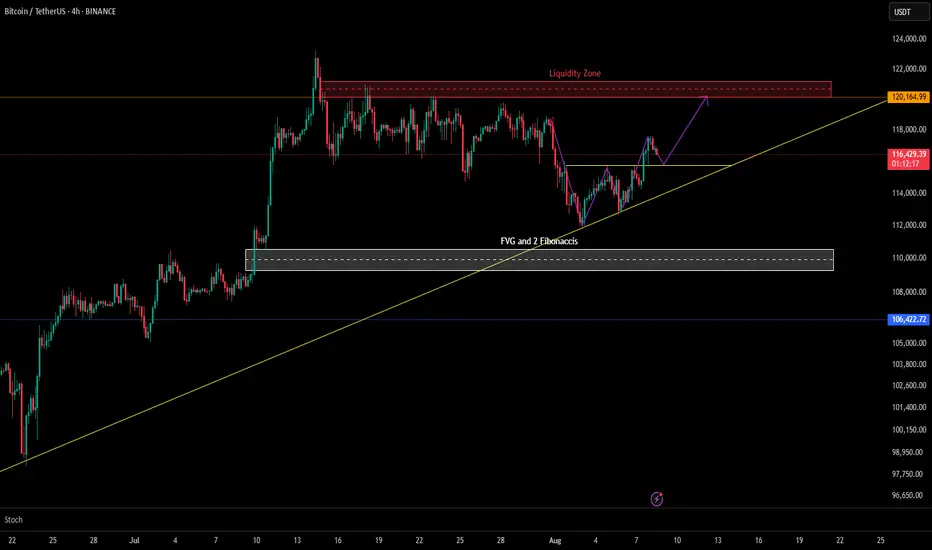
BTC/USDT – 4H Bullish Structure Aiming for Liquidity Grab at $12On the Daily timeframe, BTC is consolidating under a major Liquidity Zone with a strong FVG + Fibonacci confluence below price.
Now, zooming into the 4H chart, we can see the structure more clearly:
🔹 Liquidity Zone (~$120K) – Marked in red, this area is likely loaded with buy stops from shorts. A push into it could be a classic liquidity grab before any reversal.
🔹 FVG + Dual Fibonacci Confluence (~$109K) – Marked in grey, this zone remains a high-probability demand area if price pulls back.
🔹 Bullish Structure – Price has been respecting the ascending yellow trendline. The recent bounce suggests bulls could target the liquidity zone before deciding the next move.
Possible Scenarios:
✅ Bullish Path: Hold above trendline → Push toward $120K liquidity zone.
🔁 Bearish Path: Break of trendline → Deeper retrace into the FVG/Fib confluence zone.
Bias: Short-term bullish unless trendline breaks. Watching $120K for reaction.
Note: This 4H view builds directly on my recent daily chart post for BTC, giving a zoomed-in perspective for shorter-term traders.
Our refinement gives result!After implementing major improvements to our trading system, we got an excellent result:
+8.5% in July - and this without increasing the risks!
How did we achieve this?
🔸In-depth Analysis: for a long time we have been studying already good result of our trading and have long begun to notice a number of patterns related to unrealised pnl.
🔸Using data systematization: AI models allowed us to find clear patterns that we managed to turn into a list of specific improvements to the trading system.
🔸 Risk control: we have not only preserved, but also reduced the level of risk with increasing profitability!
What does this mean for our investors?
✅ More profit is stable and more predictable. New average monthly profit target is now 5%. First month is ahead of him.
✅ Less risk - safety and comfort of investing remains one of our top priorities.
✅ Proven solutions - comprehensive tests were conducted before implementation of improvements, which confirmed the operability of improvements.