Multi-timeframe analysis, strong momentum, FOMC risk/reward plan__________________________________________________________________________________
Technical Overview – Summary Points
__________________________________________________________________________________
Strong momentum and bullish consensus confirmed across all timeframes.
Key support/resistance : 114k–116k (critical support), 123k (major pivot).
Healthy organic volume , no extreme peaks except isolated moments (30min/15min).
Risk On / Risk Off Indicator : Dominant bullish signal, neutral only on 15min.
Multi-timeframe structure : Perfect alignment daily/4H/2H/1H, caution on 15/30min (slight inflection but no abnormal divergence).
__________________________________________________________________________________
Strategic Summary
__________________________________________________________________________________
Global bias : Structural bull market, intact dynamic.
Opportunities : Tactical buys on pullbacks (114–116k), swing on breakout 123k.
Risk areas : Below 114k = risk of invalidation, targets 111k–105k.
Macro catalysts : FOMC imminent (high volatility expected), watch geopolitical tensions.
Action plan : Favor swing/cautious trading ahead of FOMC, dynamic stops, act on first post-Powell trigger.
__________________________________________________________________________________
Multi-Timeframe Analysis
__________________________________________________________________________________
1D : Active range 114k–123k; strong supports, momentum maintained; Risk On / Risk Off Indicator strongly bullish.
12H/6H/4H : Clean bullish structure, no excesses or divergence; price sits within major horizontal clusters.
2H/1H : Healthy impulse/correction phases; key intermediate supports 114.6k, 117.5k to watch.
30min/15min : Slightly weaker momentum but constructive microstructure, no immediate sell threat; localized volume spikes on support reactions.
ISPD DIV : No behavioral stress observed throughout.
Cross-timeframe summary : Bullish confluence dominant; caution on short-term reversals tied to FOMC and on-chain volatility spikes.
__________________________________________________________________________________
Multi-timeframe Cross Analysis & Decisional Rationale
__________________________________________________________________________________
As long as BTC > 114k = bullish bias, buying pullbacks, swing target 123k.
Active management post-FOMC strongly advised (enter/reduce after first H4 close).
Increased volatility risk in case of Fed/geopolitical shock; mandatory stops.
Sector momentum (Risk On / Risk Off Indicator) and volume underpin the bullish case unless exogenous alert.
Invalidation below 114k = prudent, neutral, or tactical shorts towards 111k–105k.
__________________________________________________________________________________
Macro, On-chain & Economic Calendar
__________________________________________________________________________________
FOMC July 29th : pivotal event, any surprise = strong intraday move (BTC sensitive to Powell speech).
US Macro: strong fundamentals but caution on trade war, inflation "contained."
On-chain : realized cap BTC >$1T, high open interest in derivatives = leveraged risk, beware speculative altcoin excess.
Global risk : market remains buyer until bearish Fed/geopolitical shock; swing trading favored, tight stops recommended.
__________________________________________________________________________________
Action plan
__________________________________________________________________________________
Favor buying/reloading on pullbacks to 114.6k–116k (stop <114k).
Break above 123k = bull confirmation, further extension likely to 126–128k depending on FOMC outcome.
Prioritize strict risk management; monitor liquidity/supports on macro/on-chain volatility peaks.
__________________________________________________________________________________
USTBTC trade ideas
Daily BTC, ETH & Market Index Analysis💎🔥 Daily BTC, ETH & Market Index Analysis & What Comes Next? 🔥💎
Smash the 🚀, FOLLOW for daily updates, and drop your thoughts in the comments!📈💬
♦️ Hello everyone!
Here’s what you can expect from this page:
🟡 Every Day: BTC & ETH analysis + complete market index overview
🟡 Every Sunday: Top 10 Altcoin breakdown (excluding BTC & ETH)
🟡 🆕 Coming soon: Weekly Watchlist every Sunday!
💛Your likes and follows are what keep this crypto routine going 💛
⭕️ 24-Hour Market Crash – Summary for Crypto Traders
Let’s break down what happened 👇
1️⃣ A massive wave of liquidations in futures and derivatives triggered heavy selling pressure.
2️⃣ BTC Dominance dropped, but capital also exited altcoins and flowed into BTC – a clear fear response and move toward safer assets.
3️⃣ Institutional players reduced exposure to altcoins to limit risk, causing deeper price drops.
4️⃣ On Ethereum, over $2.3B ETH is queued for unstaking, raising the chance of near-term sell pressure.
5️⃣ Ongoing pressure from investor sentiment shifts and global uncertainty is pushing money out of high-risk assets like crypto.
6️⃣ ⚠️ But this is a technical correction, not a fundamental collapse. For long-term thinkers, this could be a buy-the-dip opportunity.
🔥❗️Heavy Crypto Sentiment Week Ahead
As mentioned yesterday, we’re at a critical point across key crypto indexes:
♦️ BTC, ETH, major altcoins, and indexes like BTC.D, USDT.D, TOTAL, TOTAL2, TOTAL3.
🚨 Tomorrow brings a major crypto-impacting event — the Fed interest rate decision.
Most forecasts suggest no change. However, with rising stock indexes, there’s no clear pressure to cut inflation.
Any unexpected comments or decisions by Powell may drive new waves in the crypto space.
♦️ BTC
🗓 Monthly candle closes in 2 days — be cautious around this point.
🔑 $120,300 is still the main breakout level.
If it breaks with BTC Dominance rising, altcoins may stall (unless paired bullishly with BTC).
If it breaks while BTC.D drops, expect strong altcoin momentum.
⚔️ Two scenarios for entries:
1️⃣ Entry at $119,500 – higher risk of getting stopped out but tighter SL.
2️⃣ Entry above $120,300 – more reliable but wider stop due to breakout wick.
🟡 Key Support: $115K–$117.3K – still valid, but repeated testing weakens the zone.
❗️❓️Why does it get weaker?
Because each test drains buy orders. Sellers eventually overwhelm this level as buyers lose firepower.
♦️ BTC Dominance (BTC.D)
Trend isn't clearly bullish yet, but the recent drop has slowed down.
Structure is shifting – two key levels to watch:
1️⃣ 60.83 – rejected yesterday.
2️⃣ 60.42 – if this breaks down, alts may push higher.
♦️ TOTAL (Crypto Market Cap)
Stuck at the $3.91T resistance.
💥 Breakout = strong volume and momentum injection. Be positioned accordingly.
♦️ TOTAL2 (Altcoins excl. BTC)
At the $1.53T key level – breakout or rejection will shape altcoin direction.
♦️ TOTAL3 (Altcoins excl. BTC & ETH)
Still eyeing the $1.08T resistance zone.
♦️ USDT Dominance (USDT.D)
If 4.44% breaks and holds – bullish structure in BTC & alts will be in danger.
Until then, focus on long setups.
📌 Make sure you’re positioned before 4.13% breaks — alts typically begin moving before that confirmation.
♦️ ETH/USDT
If ETH closes below $3,480, expect extended correction or range.
♦️ Trading Outlook
1️⃣ Today may be quiet – market awaits reaction to tomorrow’s index events (Fed, BOJ, Powell).
2️⃣ These updates can create new moves or shift bias toward short setups.
💎 If this helped your crypto planning, hit the 🚀, FOLLOW for more daily setups, and share your thoughts in the comments! 🔥📊

BTC Accumulation, Bullish Breakout Signs💎 BTC PLAN UPDATE
1. Key Chart Features:
Currently, the BTC/USD price is at $118,893.
The chart shows a strong upward trend recently, and we are seeing accumulation with short-term corrections.
2. Fibonacci Levels:
The Fibonacci retracement levels are drawn from the lowest point ($114,460) to the highest point ($119,809).
At the moment, the price is hovering near the 0.5 retracement level ($113,000), which is a key support level.
If the price holds above this level, a rebound is likely.
3. Trendlines and Price Patterns:
The trendlines (dashed blue lines) are indicating a descending triangle pattern, which could lead to a breakout if the price surpasses resistance levels.
A potential Head and Shoulders pattern might be forming, though it is not yet clear and needs confirmation by breaking key resistance.
4. Breakout and Retest Zone:
The breakout zone (red area) is around $119,000.
If the price breaks and holds above this level, we may see a continuation of the uptrend toward the next target around $122,792 (Fibonacci 1.618 level).
After the breakout, the price might retouch (retest) this support area before resuming the upward movement.
5. Technical Indicators:
• Moving Averages (MA):
• The red MA (long-term) is below the current price, indicating a strong uptrend.
• The yellow MA (medium-term) is near the current price, providing support for the uptrend if it holds.
• RSI Indicator:
The RSI has not yet reached overbought levels, suggesting that the market still has potential to rise without being overheated.
6. Conclusion:
If the price breaks above the $119,000 resistance and maintains that level, BTC/USD could continue its strong bullish trend, potentially targeting $122,792 or even $127,941.
Note: If the price fails to hold above $119,000 and drops back below, a pullback to the nearest support level at $114,460 may occur.

BTC AI Prediction Dashboard - 6h Price Path (29.07.25)
Prediction made using Crypticorn AI Prediction Dashboard
Link in bio
BTCUSDT Forecast:
Crypticorn AI Prediction Dashboard Projects 6h Price Path (Forward-Only)
Forecast timestamp: ~09:00 UTC
Timeframe: 15m
Prediction horizon: 6 hours
Model output:
Central estimate (blue line): -118,729
Represents the AI’s best estimate of BTC’s near-term price direction.
80% confidence band (light blue): 118,724 – 119,346
The light blue zone marks the 80% confidence range — the most likely area for price to close
40% confidence band (dark blue): 118,151 – 119,894
The dark blue zone shows the narrower 40% confidence range, where price is expected to stay with higher concentration
Volume on signal bar: 95.57
This chart shows a short-term Bitcoin price forecast using AI-generated confidence zones.
Candlesticks reflect actual BTC/USDT price action in 15-minute intervals.
This helps visualize expected volatility and potential price zones in the short term.

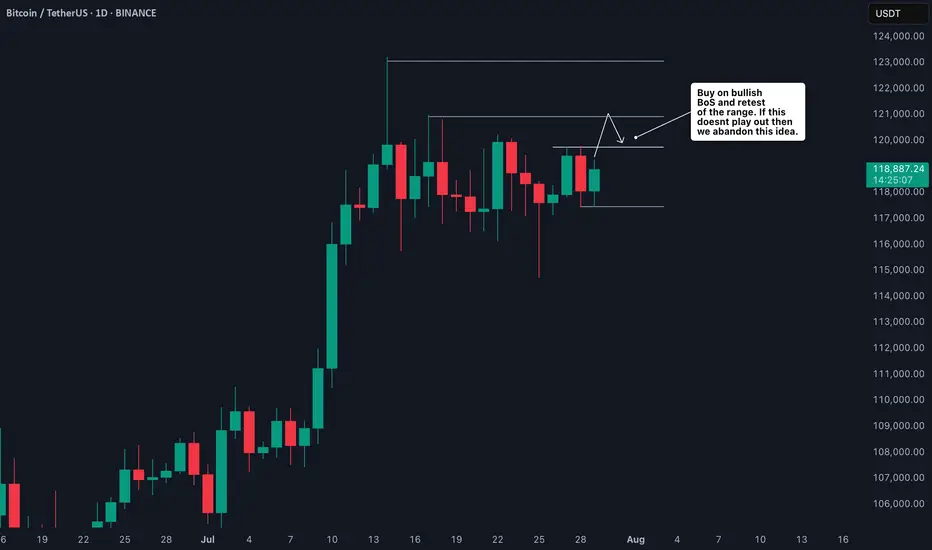
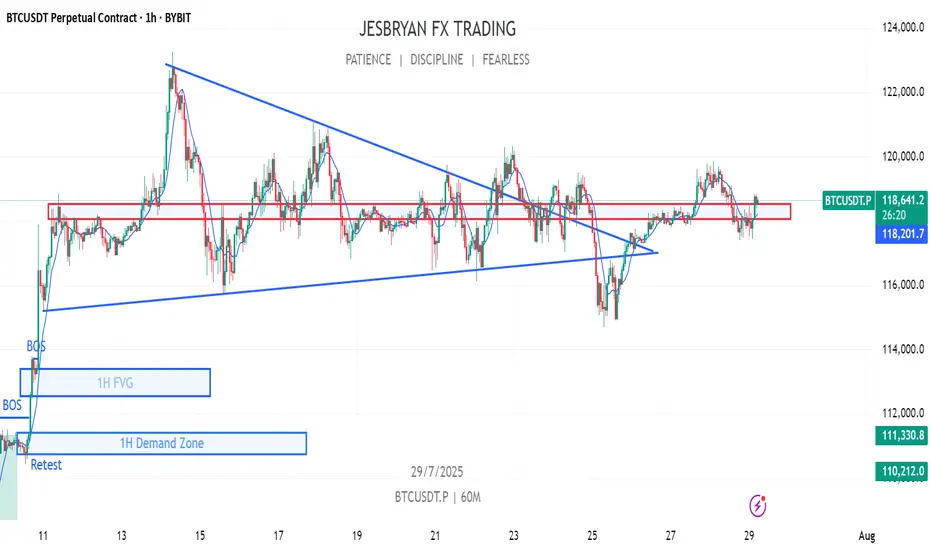
BTC Trade Plan: Watching for Break and Retest Above Daily Range🟠 Bitcoin (BTC) is currently trading range-bound on the daily timeframe ⏳📉📈. I’m monitoring price action for a bullish break and retest 🔓🔁 of the current range to confirm a potential long entry 🎯.
📍 Key levels are already marked on the chart 🗺️—
🛑 Stop-loss would sit just below the previous swing low,
🎯 Target aligns with the higher price zone marked out to the left of the chart 🔼👈.
This is a classic range breakout setup—patience and precision are key.
🧠 As always, this is not financial advice.
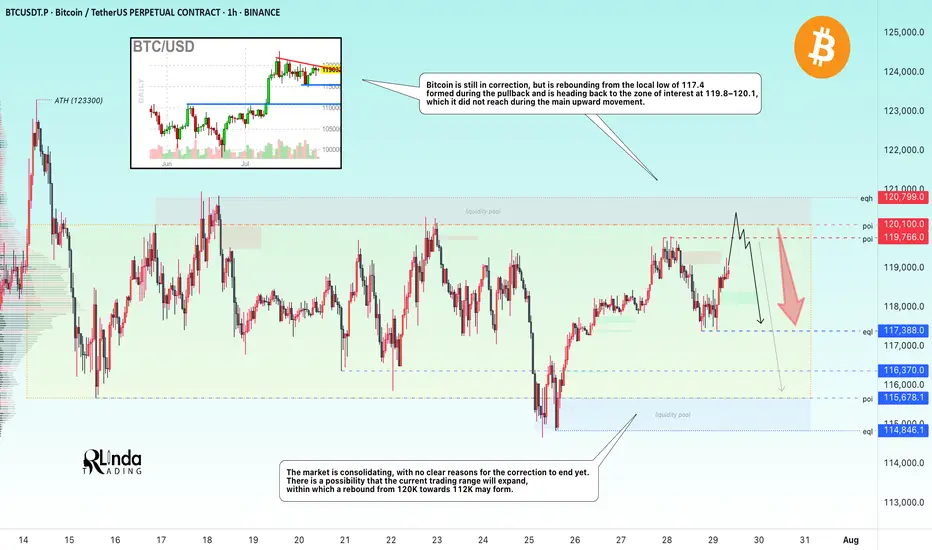
Hunting for liquidity. Retest resistance before a fallBitcoin is still in correction, but is rebounding from the local low of 117.4, formed during the pullback, and is heading back up towards the zone of interest at 119.8-120.1, which it did not reach during the main upward movement. I see no fundamental or technical reasons for the correction to end and for growth beyond 121K. I expect a rebound from the resistance zone towards 115-114K. However, in the medium term, I expect the market to attempt to close half or all of the gap between 112K and 114.8K, thereby expanding the key trading range.
Resistance levels: 119.77, 120.1K, 120.8K
Support levels: 117.4, 116.37, 115.68
Technically, a false breakout (liquidity capture) of key resistance and price consolidation in the selling zone could trigger bearish pressure on the market, which in turn would lead to a correction.

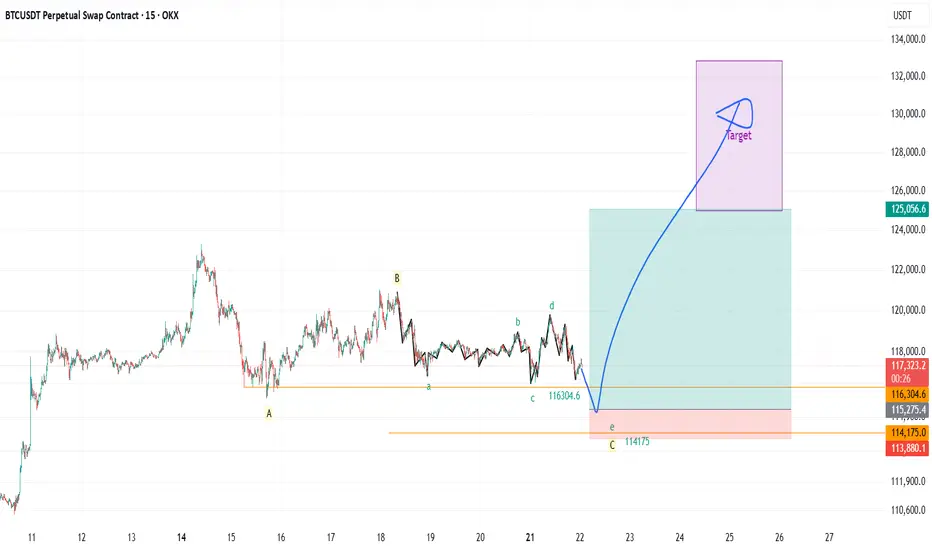
#BTC Update #11 – July 29, 2025#BTC Update #11 – July 29, 2025
Bitcoin continues to move within the channel and has completed several corrections of its last impulsive move. It is currently undergoing a correction within a correction. There was a liquidation zone around the $117,000 level, which was mostly filled, triggering a reaction.
From what we can observe now, Bitcoin is facing rejection from the upper boundary of the channel. If it manages to break out of the channel and continue its climb, I believe it will target the high liquidity zone near $122,000.
At this stage, Bitcoin is not in a suitable position for either long or short trades.

BTC OUTLOOK Bitcoin returns to $119,000 after a CME gap fill as new Galaxy Digital exchange transactions fail to sway the market mood.
Nerves over “OG” BTC sales seem to have passed after last week’s 80,000 BTC transaction.
Trading circles still see the potential for another BTC price dip.

BITCOIN → Hunting for liquidity. Retest resistance before a fallBINANCE:BTCUSDT.P continues to consolidate after a strong rally. There is no strong driver yet, and Bitcoin is reacting weakly to economic data. There is a possibility of a continued correction...
Bitcoin is still in correction, but is rebounding from the local low of 117.4, formed during the pullback, and is heading back up towards the zone of interest at 119.8-120.1, which it did not reach during the main upward movement. I see no fundamental or technical reasons for the correction to end and for growth beyond 121K. I expect a rebound from the resistance zone towards 115-114K. However, in the medium term, I expect the market to attempt to close half or all of the gap between 112K and 114.8K, thereby expanding the key trading range.
Resistance levels: 119.77, 120.1K, 120.8K
Support levels: 117.4, 116.37, 115.68
Technically, a false breakout (liquidity capture) of key resistance and price consolidation in the selling zone could trigger bearish pressure on the market, which in turn would lead to a correction.
Best regards, R. Linda!
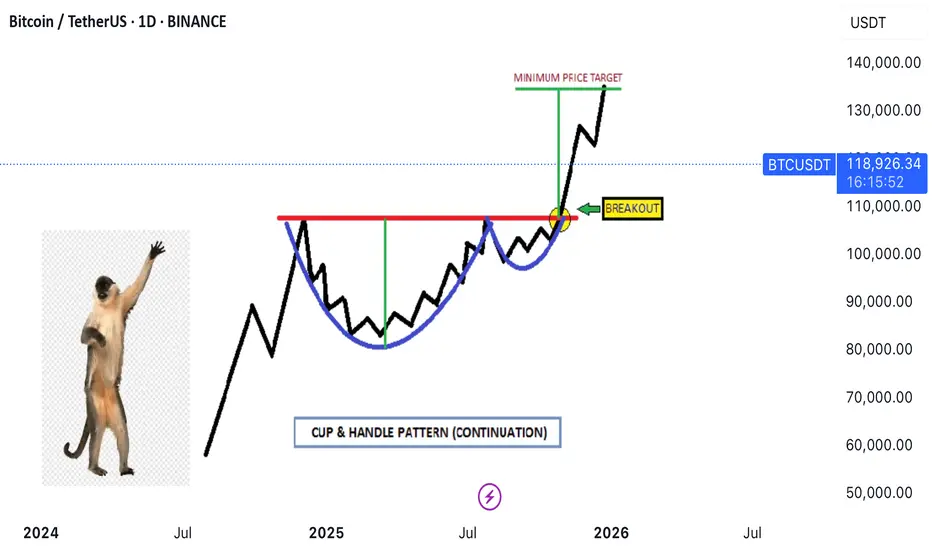
Thea **Cup and Handle** pattern✨ **Imagine the market serving profits in a teacup!**
Thea **Cup and Handle** pattern isn’t just a technical term—it’s the market whispering, *“Get ready for liftoff!”* Let’s break it down in an engaging way:
### ☕ The Cup
- Picture a graceful drop in price that curves back up, forming a U-shape.
- It’s like the market takes a sip, then refills—symbolizing recovery and building strength.
### 🛠️ The Handle
- After the cup fills, the price dips slightly again, forming a small slope downward.
- This is the “handle”—a moment of consolidation, often with lower trading volume.
- It’s the calm before the bullish storm.
### 💡 Bullish Signal
- When the price **breaks above the handle’s resistance**, it’s like the market pulls the trigger.
- This signals a potential buying opportunity as the trend resumes upward.
### 📆 Duration
- The cup can take weeks or even months to form, while the handle is shorter and more subtle.
- Patience pays off, as the breakout often leads to explosive momentum.
---
🏆 *Want proof?* Check the comments—one of our past trades using this exact pattern scored a massive win of **100,000 pips**! 🚀
Technical analysis isn’t just charts and numbers—it’s decoding the market’s rhythm.
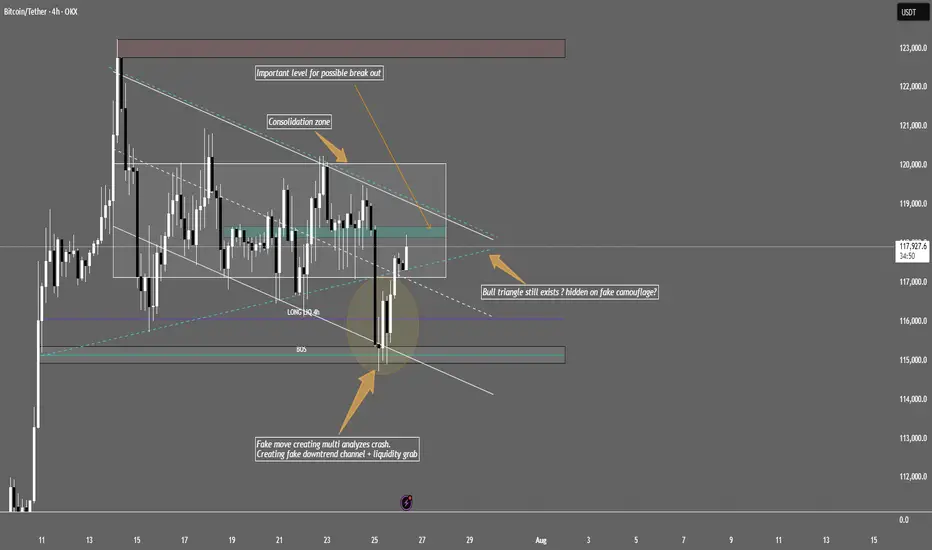
BTC/USDT Bull triangle still exists ? Hidden on fake camouflage?Bitcoin is moving sideways in a tight consolidation range between $117,000–$120,000 . Institutional players are accumulating positions here based on recent on-chain whale inflows, positive funding, and OI increase.
Key points with real chart zones:
The big drop down was likely a "fake out": Price wicked down to ~$115,000, triggering stop losses below this support, letting smart money buy cheaper.
Strong bounce back:
After the sweep, price quickly reclaimed the range, returning above ~$117,300–$118,000 , indicating strong buyer presence.
Bullish triangle is still valid:
Structure holds as long as price trades inside/bounces between $117,000 (lower zone/fake-out base) and $120,000 (upper resistance/consolidation top). Watch for volume spikes around $118,000–$120,000 as signs of institutional accumulation or breakout intent.
If price breaks above the range:
If we see a proper H1/H4 close above $120,000, expect a strong move to the next resistance: $123,000–$124,000 zone.
If price breaks down and holds below:
Sustained price action below $117,000, especially after another fake-out, could lead to a drop toward previous demand/stop zones at $115,000, and if that fails, further down to $110,000–$113,000.
Bottom line:
BTC sits in a “make-or-break” zone between $117,000–$120,000. Break out above $120k opens the path to $124k+. Loss of $117k/115k support risks further downside. Order flow and on-chain favor bulls for now, but always use stops – low volatility ranges can quickly resolve with liquidity grabs.
Tip:
Don’t chase every breakout or drop. Watch closely how price reacts near $120,000 (upside) and $117,000/$115,000 (downside). It is crucial to follow macroeconomic news, especially FED updates – trade safely and always do your own research!
This is not financial advice!
Bitcoin BrokeBitcoin broke below the support area to liquidate high-leverage positions. The price has now regained the $118,000 area and is expected to move upward. The key resistance level is at $120,000.
$BTC Daily OutlookBINANCE:BTCUSDT.P
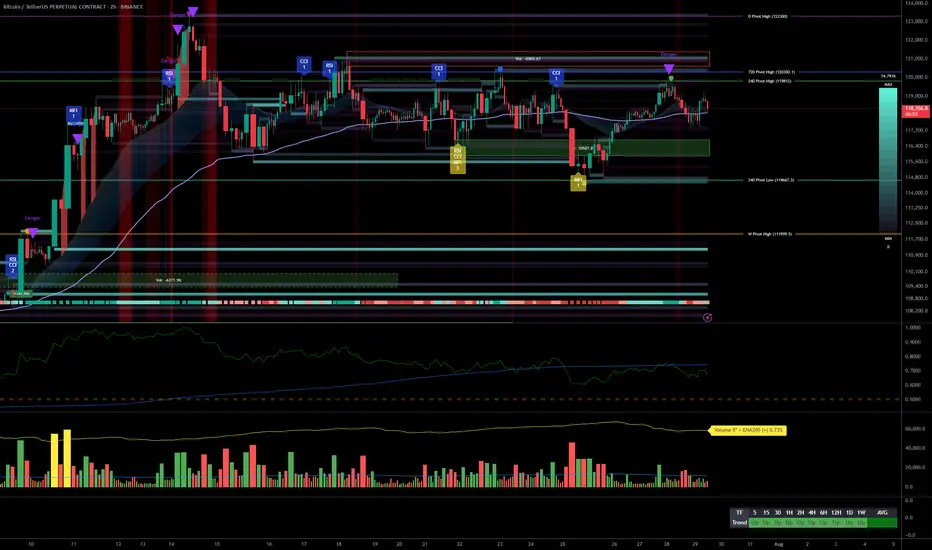
Weekly Chart:
Bitcoin has now printed three consecutive weekly closes above the former higher-high threshold at $111 960. That series is enough to confirm a clean breakout of the prior HH-HL range and keeps the long-term bias pointed firmly higher.
That said, a near-term pullback is still on the table:
• First support — the breakout shelf at $111 960 (re-test of structure).
• Deeper support — the next V-level around $98 115.
Why the caution?
Last week’s candle left a small Failed Auction just above the new high, and Footprint data shows a cluster of aggressive buy-delta trapped in that wick. Those buyers may need to get washed out before the trend resumes.
Big picture: weekly structure is bullish; any dip into the levels above is a potential reload zone while the breakout holds.
Daily Chart:
Price action remains firmly bullish: multiple Failed-Auction rejections at the $116 860 higher-low vLevel keeps supply thin and reinforce the up-trend toward the prior ATH.
That said, remember Auction Market Theory rule #5: “When time or volume builds at the edge of balance, price often pushes through.”
• Each failed auction is absorbing resting bids.
• If sellers lean in again with size, the level can flip from support to resistance very quickly.
In practice that means:
•Base case – continuation to the highs while the Daily structure holds.
•Risk scenario – a clean break of $116 860 would open room for a deeper weekly pullback toward $107456.0
For now we treat the current weekly pullback as a fresh opportunity: scouting intraday longs as price reacts to the 1-Hourly zone.
From the footprint read-out, today’s bar finished with a neutral delta, but note where the profile is stacked: both the Value Area Low and the POC sit right at the bottom of the candle. That tells us the bulk of volume printed down at the session lows and it skewed negative, sellers were leaning hard, trying to extend the move lower.

Update: Bull or Bear?I optimized and updated my trend lines. We have a fake breakout on there
What's your Idea? Bull or Bear?

Bitcoin's Unpopular ScenarioI don't think this scenario is likely to happen. What do you think?? The analysis that I think is most likely to correct the price is the one I posted a few minutes ago.

Bitcoin ready to fall?!??I think this is the best analysis that can be made of Bitcoin. I don't see any strength in its trend and I feel that it is going to correct to the specified areas, but our trend is completely bullish.

EP 01: BTC correction near completionAfter the impulse to last ATH we got a 3 wave correction, last wave being formed by 5 waves, so all together coming to completion. We should visit the liquidation area under last low and swipe that liquidity and aim closer to last ATH if not exceeding it. When the market gives us more information we will go for episode 02.
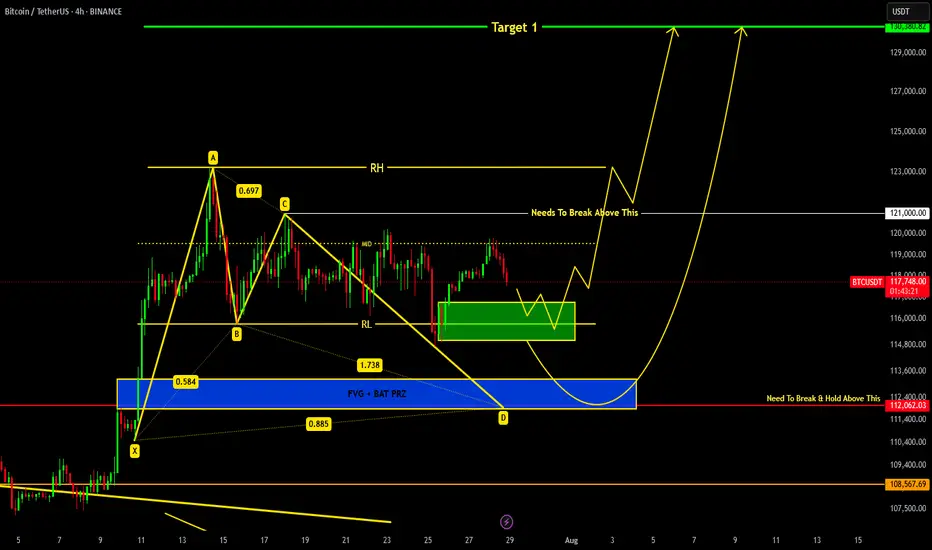
BITCOIN Current Update !!!we are heading towards support region around 116.8k-115k from where we can expect a reversal.
If price breaks down 115k level then a bat harmonic pattern is also forming which indicates it's PRZ at 113-112k region...
Remember 121k is key level which needs to be broken in order to remain bullish !!!
BTC MACD Liquidity Tracker Strategy – High Timeframe Long CallsThis BTC 8H chart shows how the MACD Liquidity Tracker Strategy has tracked trend structure cleanly across multiple long signals — each aligning momentum and EMA bias on the mid-to-high timeframe.
First long: Triggered at ~64,565 and exited near 99,560 as momentum peaked
Second long: Re-entry at 83,419 after reclaiming structure, closed near 111,958
Third long (active): Triggered at 108,342 and currently holding above 117,000 with trend still intact
Color-coded bias (blue/pink) helps confirm context at a glance. The combination of MACD momentum shifts + 60/220 EMA filters prevents early entries and helps capture large legs without excessive noise.
Want to explore or customize the strategy?
Search “MACD Liquidity Tracker Strategy ” and run your own backtests to refine parameters per asset.

Btc sell for In the lower timeframe, Bitcoin is showing oversupply and has the potential to correct to the specified level.

Btc is fallingHello, considering the breakdown of the upward trend line and the pullback to the downward trend line that I drew, the price will most likely fall to the specified support level and we will enter a resistance phase.

Bitcoin & Altcoins: Technical Analysis and Market OutlookBitcoin (BTC) Analysis
Bitcoin is currently forming a short-term bullish pennant within a larger long-term pattern, projecting a potential target around $135K.
Key Levels: BTC is consolidating between the lower zone at $117.3K and the upper zone at $119.7K.
Breakout Potential: A break above this pattern could propel BTC toward a new all-time high (ATH), surpassing the current ATH at $123K.
Macro Events This Week:
Wednesday: The Federal Reserve will announce its interest rate decision, with no changes expected.
Wednesday: ADP Employment Report, providing insights into potential future rate cuts.
Friday: Non-Farm Payrolls (NFP) data release, which could further influence market sentiment.
Ethereum (ETH) Breakout
Ethereum has decisively broken through its 4-year historical resistance around $3,725, closing the week above this level. This breakout signals a strong bullish outlook for ETH, with potential for further upside.
Altcoin Highlights
BNB: Has shattered its previous all-time highs, showcasing significant bullish momentum.
XRP: Reached approximately $3.64, reflecting strong gains and market interest.
Market Context
The crypto market is showing robust activity, with altcoins following Bitcoin and Ethereum's lead. Key macroeconomic events this week could introduce volatility, so traders should stay vigilant.
Disclaimer: This is not financial advice. Every trader is responsible for their own strategy and risk management.
Happy trading and good profits! 🚀

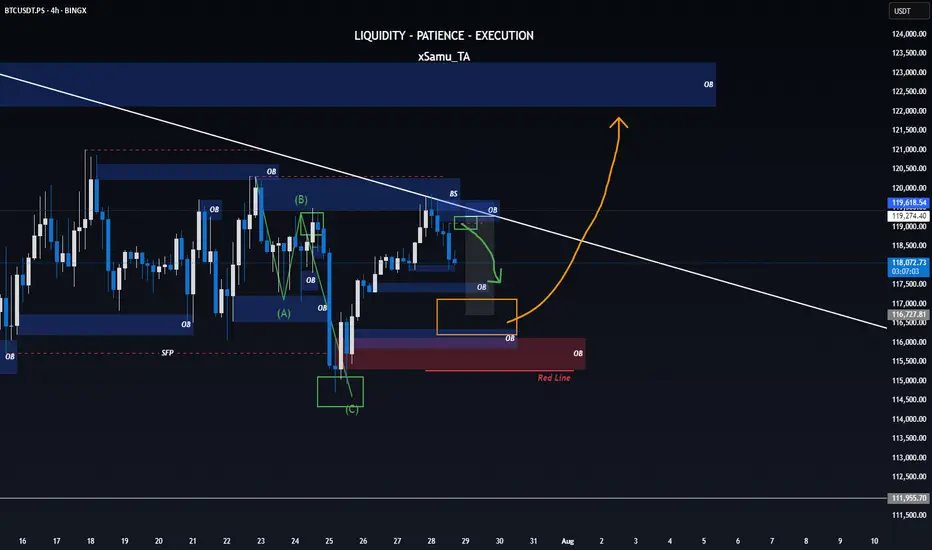
One last Correction till breakoutWith the most recent SFP printed on the higher timeframe and BTC still failing to break a significant high, all signs point toward one final dip – a move to shake weak hands and reload for the breakout that’s been brewing in silence.
⚡ If the orange level holds, consider it a highly bullish signal – supercycle potential unlocked?
Naturally, the Wizard plays both sides of the board:
📉 Short ideas would activate around the blue Order Block / green correction level.
📈 But should we bounce strong from orange… well, let’s just say you’ll want a seat for what comes next.
🟥 Bullish invalidation rests at the red line.
Let’s see how the game unfolds.