BTC roadmap to new ATHBTC roadmap to new ATH
We're in a bullish flag pattern. Might chop around here for the next few days before we get the breakout, re-test, then make our way to test the last ATH.
I'm going to trade the flag hi/low until we get a break.
USTBTC trade ideas
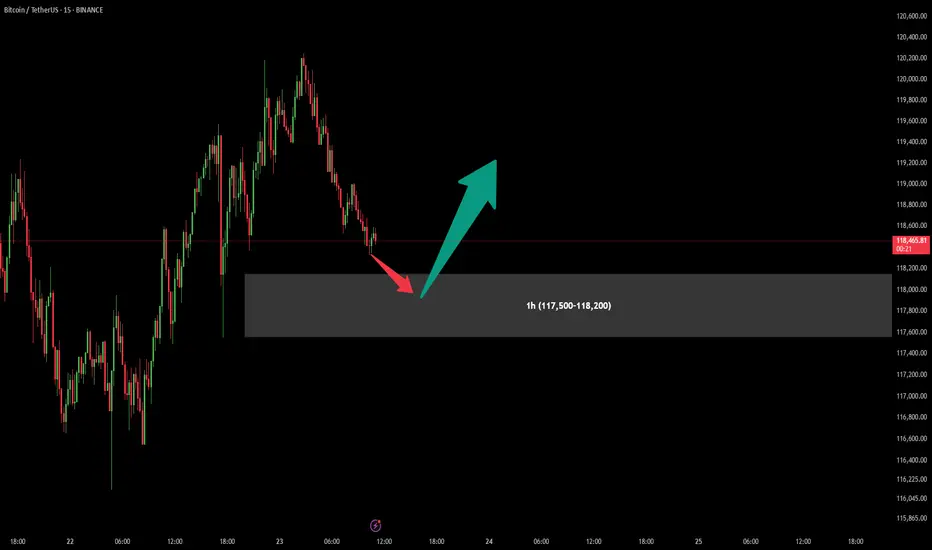
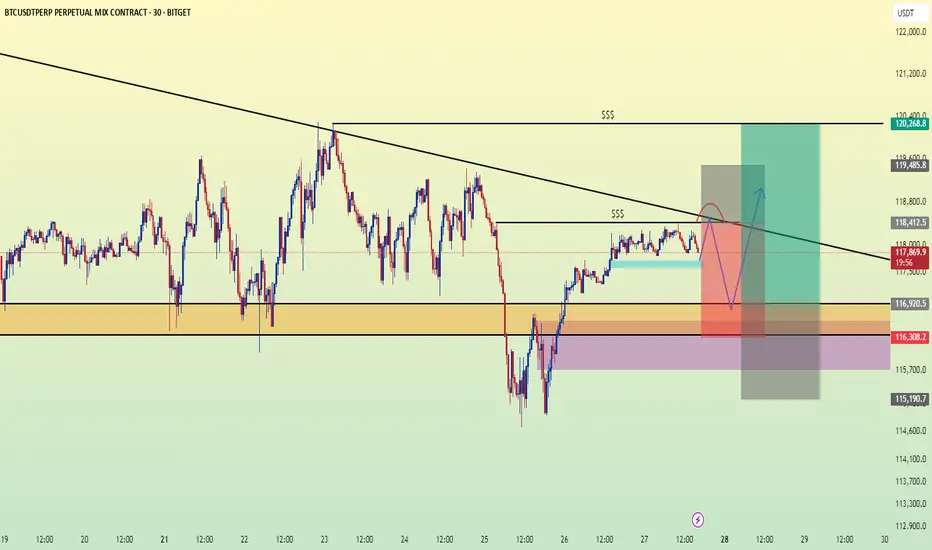
BitCoin BUY OfferAfter previous signal which have given us a good profit (more than 1:10 Risk to Reward), There is another chance for one more Buy position in specified are (117,500-118,200).
Attention : In my chart areas Stop Loss would be under the area (Over the area in Sell positions) and first Take Profit sets for at least R:R = 1:1
Let's see what will happen...
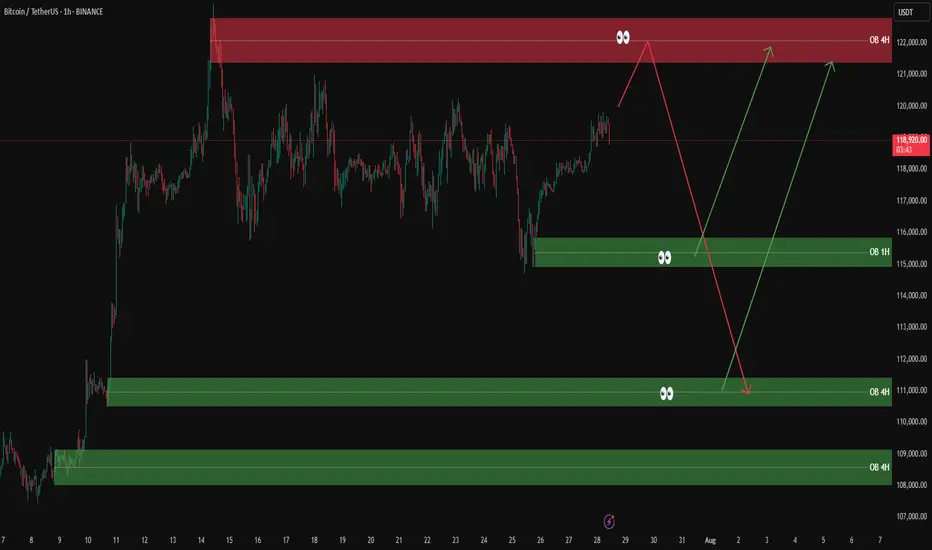
BTCUSDT analysis – 1H & 4H OB setups✅ The overall market trend is still bullish on the 1H and 4H timeframes. However, we’re watching the red 4H supply zone (around 122,000) closely for a possible short-term sell setup.
🟥 If price reaches this red OB, we’ll look for a light short position only with confirmation on the 5M or 3M timeframe.
🟩 On the downside, we are mainly interested in buy setups from the following key green OB zones:
🔹 OB 1H around 115,000
🔹 OB 4H around 111,000
🔹 OB 4H around 108,000
📌 Possible scenarios:
1️⃣ Price reaches the red OB → short with confirmation
2️⃣ Price pulls back to lower green OB zones → long with confirmation
3️⃣ Market bias remains bullish unless proven otherwise.
❌ No entry without confirmation.
Bitcoin (BTC): Gameplan Remains The Same | Targeting $140KOur game plan remains the same for Bitcoin; we are bullish and with the new weekly opening, we are seeing that buyers still have the dominance.
No signs of any major weaknesses so as long as we are above the $100K zone, we are aiming to reach that $140K zone within months!
Swallow Academy

BTC AI Prediction Dashboard - 6h Price Path (28.07.25)
Prediction made using Crypticorn AI Prediction Dashboard
Link in bio
BTCUSDT Forecast:
Crypticorn AI Prediction Dashboard Projects 6h Price Path (Forward-Only)
Forecast timestamp: ~07:30 UTC
Timeframe: 15m
Prediction horizon: 6 hours
Model output:
Central estimate (blue line): -119,580
Represents the AI’s best estimate of BTC’s near-term price direction.
80% confidence band (light blue): 119,215 – 119,825
The light blue zone marks the 80% confidence range — the most likely area for price to close
40% confidence band (dark blue): 118,653 – 120,531
The dark blue zone shows the narrower 40% confidence range, where price is expected to stay with higher concentration
Volume on signal bar: 255.22
This chart shows a short-term Bitcoin price forecast using AI-generated confidence zones.
Candlesticks reflect actual BTC/USDT price action in 15-minute intervals.
This helps visualize expected volatility and potential price zones in the short term.

BTCUSD sell "I had posted it before as well, but it got hiddenAnalyzing market structure and liquidity using Price Action and Smart Money Concepts. Focused on key supply/demand zones and institutional order flow

Bullflag double Double bull flag target 140,000 🚀
Everyone’s looking at 145,000
175,000 looks like the fib target
Bitcoin at Descending Channel Resistance – Rejection Imminent?🔻 Bitcoin at Descending Channel Resistance – Watch This Level Closely!
📉 BTC/USDT is currently testing the top boundary of a well-defined descending channel on the 2H chart.
🟨 This zone has acted as strong resistance in the past, and the current reaction suggests the potential for a short-term rejection.
Unless we see a clean breakout above $120K with strong volume and follow-through, the more probable scenario is a pullback towards the midline or lower boundary of the channel.
💡 Notably, this area also aligns with a local supply zone and prior liquidity sweep, making it a key decision point.
⸻
🧭 CryptoPilot’s Take:
This is where patience pays off. No breakout = no FOMO. Watch for confirmation before acting.
⸻
❓ What’s your view?
Will BTC break out and flip bullish here — or is a deeper correction on the way?
👇 Share your thoughts in the comments!
💬 Follow for daily high-probability setups using Smart Money & Wave Theory. Let's grow together!

BTCUSDT NEXT Impulse !Hi fellow traders, BTCUSD will be ready to make a move higher from the blue box after it completes the expanding flat pattern in a WXY formation. Target will be 113604.87 USD. Good luck and trade safe!

BTC-----Buy around 119000, target 120000-1205000 areaTechnical analysis of BTC contract on July 28:
Today, the daily level of the large cycle closed with a small positive line yesterday, the K-line pattern continued to rise, the price was above the moving average, and the attached indicator was dead cross. The general trend of rising is still very obvious, but from the trend law, it is not a very strong trend at present. The trend of oscillating upward and range is highly likely. In this case, we must find a good rhythm for trading, keep short-term, and don’t be greedy, otherwise it is easy to have profit-taking problems; the short-term cycle hourly chart yesterday’s US market rose and then fell under pressure to correct the low position near the 118700 area. The current K-line pattern is continuous, and the price is at a high level. The attached indicator is golden cross and shrinking. In general, the trend is still strong and the retracement is relatively small. If we look at the continuation of the rise today, it is still the old rule. The retracement cannot be large and cannot break the intraday low.
Today’s BTC short-term contract trading strategy:
Trade in the 119000 area when retreating, stop loss in the 118500 area, target 120000 and break to the 120500 area;

btcusdtbtc might form deep crab harmin pattern. so far our lower high is 120952 .until this level is breached we may go lower to 112 k area

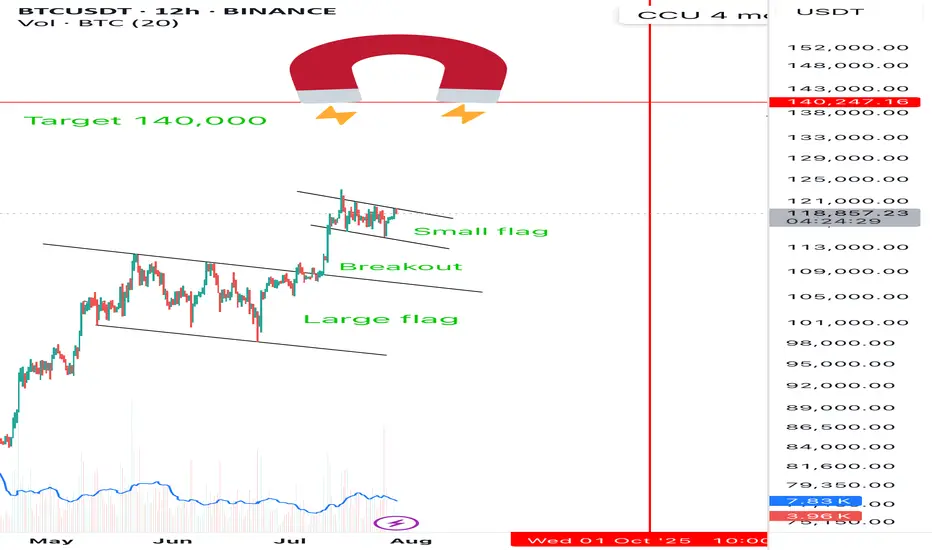
Double Bullish Flag on Bitcoin — Next Rally to $135K?📊 BTCUSDT (12H) In-Depth Analysis: Major Momentum Brewing
Bitcoin (BTC) is currently exhibiting a very promising technical structure — a Double Bullish Flag, a rare yet powerful continuation formation that often precedes strong upside momentum.
This dual-pattern structure reflects market strength and smart accumulation, with bulls maintaining control while allowing for healthy pauses before potential expansion to higher levels.
---
🔍 Technical Breakdown: Double Bullish Flag Structure
🔸 1. Primary Bullish Flag:
Formed after a sharp rally from around $95,000 to $113,000 (flagpole).
Price then consolidated within a clear descending channel, forming a classic Bullish Flag pattern.
Breakout from this pattern occurred in early July, confirming bullish continuation.
🔸 2. Secondary Bullish Flag (Mini Flag):
After the breakout from the main flag, BTC formed a second smaller flag pattern — a narrow descending channel from ~$123K to ~$119K.
This is known as bullish flag stacking — a pattern of "flag on top of flag", signaling trend strength and smart consolidation.
This mini-flag now acts as a launchpad for the next potential breakout.
---
🚀 Bullish Scenario: Preparing for a Breakout
If BTC breaks above the upper resistance of the mini flag (~$123,200), it will signal a fresh bullish continuation.
🎯 Potential Upside Targets:
Conservative target: $126,000 – $128,000
Full measured move target (from flagpole): $132,000 – $135,000
✅ Confirmation criteria:
Strong candle close above $123.2K
Accompanied by rising volume and upward RSI momentum (but not overbought)
---
🧨 Bearish Scenario: Breakdown and Retest
If BTC fails to break above the flag and instead drops below the flag support (~$119,400), we may see a short-term correction.
🔻 Key Support Levels:
$117,000 – minor horizontal support
$113,000 – $115,000 – strong demand zone and previous breakout area
⚠️ As long as price holds above $113K, the broader bullish trend remains intact. A pullback to this zone could offer a prime retest-buying opportunity.
---
📌 Key Price Levels to Watch:
Level Role
$123,200 Mini-flag resistance (breakout trigger)
$121,600 Mid-range resistance
$119,400 Flag support
$117,000 Horizontal retest zone
$113,000 Major support (trend invalidation if lost)
$132K – $135K Projected breakout target
---
💡 Conclusion: BTC in Critical Zone Before Potential Expansion
This Double Bullish Flag formation is one of the most technically constructive setups BTC has shown in weeks. It reflects a strong, patient market — with bulls preparing for another leg higher.
If the breakout from the second flag confirms, Bitcoin could rally toward $135,000, backed by momentum, volume, and clean structure. However, a breakdown would only signal a short-term cooldown unless support at $113K is lost.
🧭 Stay focused on breakout confirmation, volume spikes, and market sentiment. This could be the calm before a bullish storm.
#BTCUSDT #BitcoinBreakout #BullishFlag #TechnicalAnalysis #DoubleBullFlag #BTCMomentum #BitcoinRally #CryptoOutlook #BitcoinTo135K

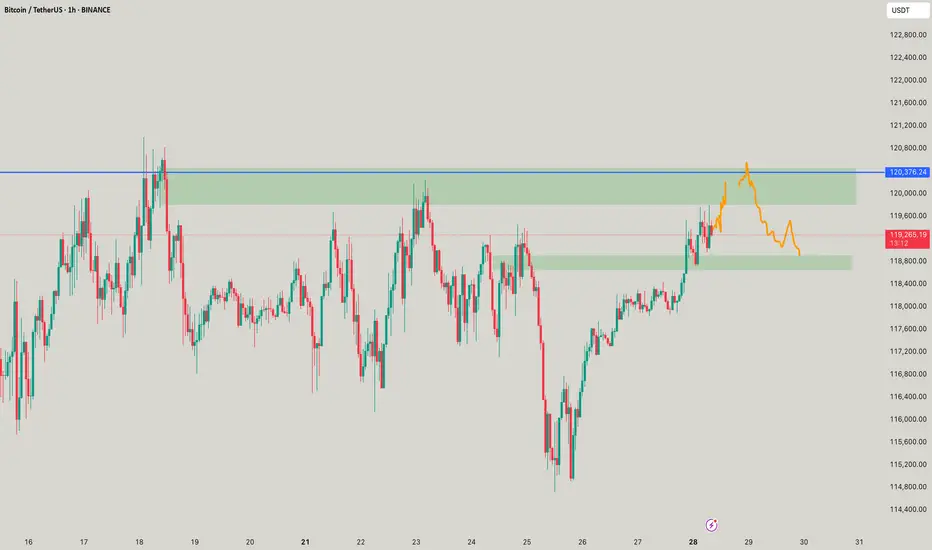
BTC - When 130k?This is BTC, As mentioned, has hit 119,540 and above, will make moves like this till 120,376 to max 120,578 and there if it breaks 120,578 in 1H and close above, then we see good move or we see a fountain which I call as waterfall.
BTC | Long | Target: + 121500This technical analysis is for informational and educational purposes only. It does not constitute financial advice. Remember to always research and consult with a professional before making investment decisions. Good luck! 📈💼🚀

ABC BTC LongCurrently in a Long position on btc, closed the short out in profit from previously posted short abc. Now in a great position from the start of the new ABC long as depicted on chart

BTC short and long setupBoth may happen. i want Bitcoin grab liquidity first and then fall tell next liquidity.
Bitcoin could go up again nowHi traders,
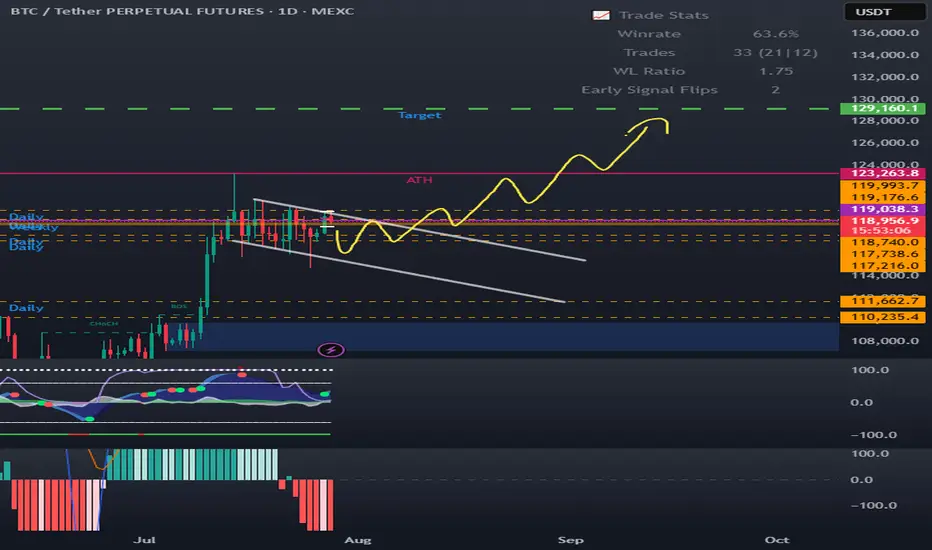
Last week Bitcoin made a Zigzag (break of previous low into the bullish Daily FVG) as I've predicted in my outlook.
After it came into the Daily FVG, price went up again.
Now if we see a small correction down, we could see the next impulsive wave up to a new ATH.
Let's see what the market does and react.
Trade idea: Wait for a correction down to finish.
Then after an impulse wave up, a small correction down on a lower timeframe and a change in orderflow to bullish you could trade longs.
NOTE: the next three weeks I'm on holiday so I will not post any outlooks publicly.
If you want to learn more about trading FVG's with wave analysis, please make sure to follow me.
This shared post is only my point of view on what could be the next move in this pair based on my analysis.
Don't be emotional, just trade your plan!
Eduwave

BTC/USD) bullish trend analysis Read The captionSMC Trading point update
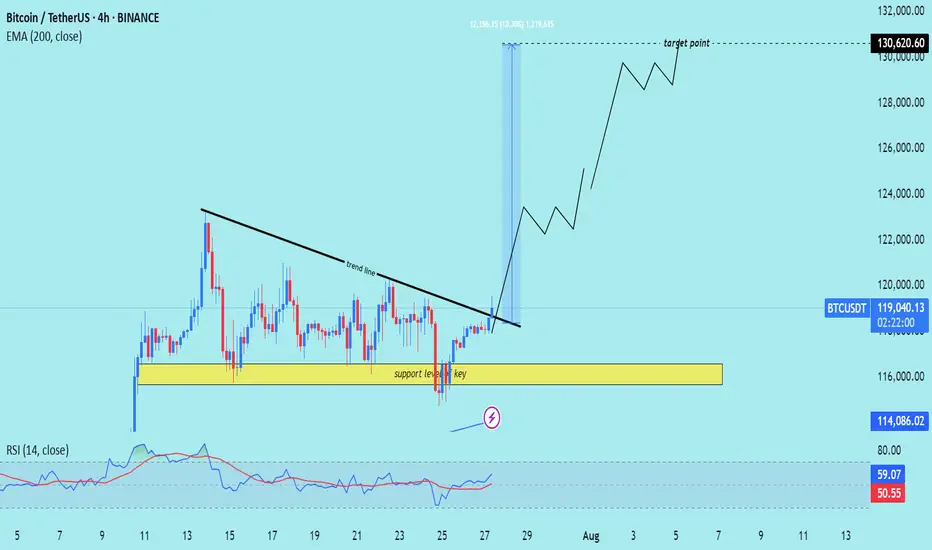
Technical analysis of Bitcoin (BTC/USDT) on the 4-hour timeframe, indicating a potential rally toward the $130,620.60 target zone. Here's the detailed breakdown:
---
Technical Analysis – BTC/USDT (4H)
1. Key Support Level Holding
The yellow zone highlights a strong support zone around $116,000, which has been tested multiple times without breaking.
Marked as “key support level,” it has acted as the foundation for a bullish reversal.
2. Trendline Breakout
A descending trendline was broken decisively with strong bullish candles, signaling a trend reversal.
The breakout was followed by increased momentum and volume, supporting the move higher.
3. Target Projection
The chart shows a projected move up to $130,620.60, labeled as the target point.
This target aligns with a measured move or prior resistance, suggesting a potential swing high objective.
4. 200 EMA Support
Price is well above the 200 EMA (at $114,088.52), confirming the uptrend and acting as dynamic support.
5. RSI Confirmation
RSI is at 60.62, reflecting bullish strength with more room before reaching overbought levels.
Momentum supports the continuation of the uptrend.
Mr SMC Trading point
---
Summary
Bias: Strong Bullish
Current Price: $119,291.13
Support Zone: $116,000 (key area)
Trendline: Broken with bullish confirmation
EMA 200: Acting as solid dynamic support ($114,088.52)
Target Zone: $130,620.60
RSI: 60.62 – bullish with upside potential
---
Please support boost 🚀 this analysis)
BTC & ETH Structural Market Analysis🚀 Don’t forget to hit follow and smash the 🚀 button if you enjoy this analysis! 🚀
BTC & ETH Structural Market Analysis
⭕️Methodology:
• Dow Theory
• 1D: HWC
• 4H: MDC
• 1H: LWC
Market Outlook:
Yesterday's structural analysis remains valid for today, but let’s review the key levels again.
Today’s approach:
1️⃣ Wait for Total2 to react at 1.53 – if it breaks upward, we hold our positions.
2️⃣ Take profits quickly – if weakness is spotted in the trend, close positions without hesitation.
Note: There’s a chance of fake breakouts on long positions, but personally, I’m willing to take this risk. If TOTAL breaks its key resistance, we may see a strong rally.
Key Levels & Scenarios:
♦️ BTC ♦️
• Important levels: 115 and 120.
• A breakout of these levels will define bullish or bearish scenarios.
• Long trigger remains at 120.
♦️ BTC.D ♦️
• Bullish above 61.44 and 62.17 – bearish momentum in altcoins.
• Bearish below 60.83 and 60.42 – bullish rally in altcoins.
• If BTC dominance climbs, 62.74 is the limit where we stay bullish on BTC pairs. Beyond that, focus shifts fully to BTC itself.
• If BTC breaks 119,500 while dominance drops, it confirms holding or entering longs on altcoins.
♦️ TOTAL ♦️
• Still struggling with the 3.85 resistance level.
♦️ TOTAL2 ♦️
• Successfully broke 1.48, leading to the recent altcoin move.
• Next critical level: 1.55 – a breakout could trigger a strong altcoin rally.
♦️ USDT.D ♦️
• Breakdown of 4.22: keep positions open.
• Breakdown of 4.13: start of a new bullish trend in BTC & altcoins.
• Fake breakout around 4.13: expect range-bound movement between 4.13 – 4.37.
• If 4.37 breaks upward: expect corrections in BTC & altcoins.
♦️ ETH ♦️
• Weakness visible in ETH/USDT chart; candles are not giving strong signals.
• ADX oscillator suggests a sharp move is coming (direction TBD).
• If RSI climbs above 70 with current ADX conditions: expect a sharp bullish move.
🔥 If this analysis helps you, hit that follow & smash the 🚀 to support my updates! And share your comments 🔥
Pessimistic scenario for BITCOINAfter Bitcoin touched the price of 123,218, it entered a corrective phase. According to previous analysis, we expected the price to touch the range of $115,000-113,000. With the formation of more waves, it seems that the recent correction that started on July 14, 2025 is a diametric (bowtie) where waves f and g of this diametric are not yet complete and this pattern is part of a higher degree diametric and after this pattern is completed I expect a move towards the range of 140,000-150,000
Pessimistic scenario:
The pessimistic scenario is that this wave becomes a double pattern and enters the price range of wave-b (marked with a red dashed line) of the higher degree diametric. The probability of this scenario occurring is low and I consider the first scenario more likely, but we must be prepared for all market movements.
Good luck
NEoWave Chart


Bitcoin ready to correct to 92,000A treasure channel that, after a little suffering and fear, cascades down.
Tp:92000

Why Everyone’s Stop Loss Gets Liquidated?!!...Why does your stop loss always get hit first?
Is it possible that everyone else placed theirs exactly where you did?
Maybe it's time to face an uncomfortable truth about the market and crowd psychology.
Hello✌️
Spend 3 minutes ⏰ reading this educational material.
🎯 Analytical Insight on Bitcoin:
BINANCE:BTCUSDT has established a well-defined range in this zone, triggering multiple stop hunts and now approaching a fresh daily resistance. A confirmed breakout above this level could open the door for an 8% upside move toward the 128,000 area. 📈🧠
Now , let's dive into the educational section,
🎯 Crowd Psychology: The Fixed Target of the Market
In crypto markets, when everyone thinks the same, they tend to lose the same way. One of the clearest signs of this is where stop losses are placed. When a level becomes too obvious to too many traders, it becomes a magnet for liquidity hunters.
Public stop losses are usually placed right below obvious lows or above clear highs. These are areas that everyone has mentally marked as strong support or resistance. Ironically, that’s exactly where a sudden wick appears, takes out stops, and then the market goes right back in the original direction.
🧠 Your Brain Wants Safety, The Market Wants Liquidity
New traders search for “safe” places to hide their stops. That very logic makes those places unsafe. The market needs liquidity to move, and the most liquidity sits right where people feel safe placing their stops.
Remember: stop losses are actual market orders, buy or sell triggers. When yours gets hit, someone else enters a position. Your loss is their entry. This is a zero-sum game.
🐋 Whale Activity Before the Trap
Ever noticed how, just before your stop gets hit, there’s a small move in the opposite direction? That’s bait. Right after, a strong wick sweeps through, takes out public stops, then reverses. It’s not an accident. It’s planned.
If you observe these small shifts with suspicion rather than trust, you’ll often catch the trap before it happens.
💡 Your Trigger Shouldn't Be Where Everyone Else Sets It
There’s a smarter way to manage your stops, ways that avoid the obvious traps:
Use ATR to dynamically calculate distance
Place stops based on candle structure, not just price levels
Wait for confirmed reversal patterns before setting stops
Consider mental stops based on invalidation logic, not fixed price points
⛔️ Blind Trust in Repeated Zones
When a support or resistance level holds multiple times, people begin to trust it blindly. That collective trust becomes a weakness. The market doesn’t respect obvious levels, it exploits them.
If you see it, everyone else sees it. And so does the market. But the market plays a different game. You seek safety, it seeks liquidity.
🎲 Is It Really Your Fault?
Many traders blame themselves when their stop gets hit. The truth? You’re not the problem, your thinking pattern is. Most traders make the same decisions because they learned the same textbook strategies. That’s what makes their stops predictable.
It’s not always about poor analysis. Sometimes, it’s just about being part of the herd.
📉 Practical TradingView Tools to Track Public Stop Zones
Here are a few powerful TradingView tools and indicators you can use to figure out where stop loss clusters are likely hiding. Use them together for better accuracy:
Session Volume (Fixed Range)
Apply this tool to recent ranges or high-volatility zones. Peaks in volume often reveal where most traders are entering or exiting, which means stops are likely nearby.
Liquidity Pools Finder
This indicator estimates areas with potential liquidity pools. These are often the next targets for large moves.
Horizontal Ray or Box Tool
Use these to mark the areas just above highs and below lows. These zones are where most public stops typically sit.
Fair Value Gap (FVG)
Gaps in price action can act as magnets. It's no coincidence that public stops often get hit in these areas during fakeouts or trap moves.
📌 Final Thoughts
When everyone looks at the same level, the market attacks it. Public stop losses are a primary fuel source for liquidity-based moves. Use TradingView tools, train your eye, and place your stops where no one else dares. That’s how you stay out of the trap.
✅ Wrap-Up
If your stop always gets hit right before the big move, it’s not a coincidence, it’s a mindset issue. Stop thinking like the crowd, and the market will stop treating you like one.
✨ Need a little love!
We pour love into every post your support keeps us inspired! 💛 Don’t be shy, we’d love to hear from you on comments. Big thanks , Mad Whale 🐋
📜Please make sure to do your own research before investing, and review the disclaimer provided at the end of each post.
